|
Everyone loves a list - and Hedge Clippings is no exception, provided of course we're near the top, and it's a list one would want to be on. In other words, if the list is "This Year's Best..." then most people would like to be there. On the other hand, if it's the bottom of the list, or it's titled "This Centuries Worst..." then most would duck for cover.
Some people seem to love being on the "Rich List". However, possibly because yours truly is never ever going to make the tail end of that one, it does not hold much more than a passing interest. It's probably of more interest to Lamborghini salesmen, or possibly potential kidnappers - there's another couple of reasons to justify not being on it.
Even if one's not actually on a list, people love reading them - good or bad. Lately, we've become used to the daily COVID results, and Hedge Clippings avidly reads the email we receive each night from Longview Economics in London, updating us on which country is doing well, and vice versa. Closer to home, but still on the COVID theme, we eagerly await the daily stats from each state - such is the world we live in.
Of course, at AFM we're a party to the LIST game, namely lists of the best performing funds in one category or another, and as recently as last week in Hedge Clippings we supplied the Top 20 All funds over 12 months to June 2020. We might be accused of keeping up with the Jones's - or in our case, Morningstar's or Mercer's - but in our opinion lists of best performing funds (and sometimes the worst ones) can be misleading, and dangerous. And by dangerous, we mean costly if one doesn't do a little - or a lot - of digging.
So, let's dig back a little in time:
If we look at the Top 10 funds over 1 year to June 2015, it was quite a year: Even the one at the bottom of the list returned 36%, whilst number 1 came in at 61%, for an average return of almost 48%. Pretty good, given the ASX200 returned just 5.68% and the S&P500 7.42%.
Of those 10 funds, 7 had a five-year track record at that time, with an average return p.a. of 18%, and 9 had at least a three-year track record, averaging 31% per annum.
Pretty impressive! Except that winding forward to 2017, only one of the 2015 Top 10 was still in the Top 10 list for the 12 months to June 2017. And only 6 of them made it in the 2017 Top 100, and 3 didn't make the Top 200!
Roll forward to June 2020, and of the Top of the Class in 2015, none made the 2020 Top 10, none in the Top 20, although 4 did make it into the Top 100, 2 into the Top 200, and 3 into the Top 300.
Let's try again, this time looking at the "Class of 2017". A tighter range, number 1 returned +36%, through to Number 10 at +27%. Average return for the Top 10 was just over 30% - impressive enough, but in a market where the ASX200 put on a more respectable 14%, and the S&P500 almost 18%.
All but one had a 5-year track record at that stage. Only one featured in the 2015 Top 10 list.
Of 2017's Top 10 (and you can probably guess what's coming) none made it to the 2020 Top 10. 4 were in the Top 100 (one by the skin of their teeth at 99), 3 into the Top 200, and the remaining 3 in the Top 300.
So, what does this say about the Top 10 - or 20 - for the 12 months to 2020?
You could be excused for thinking that we're giving them all the "kiss of death" normally reserved for those award recipients at gala managed fund industry evenings (there goes our invitation to this year's do).
However, digging down, and analysing rather than just scanning or compiling lists, a few things come to light:
4 out of the 2020 Top 10 (and 5 of the Top 20) have less than 3 years track record, and only 3 have 5 years or more. Only 9 of the Top 20 have a track record of 5 years or more. This seems to confirm our previous research that early stage and small managers provide good returns, in spite of the fact they're excluded form most APL's.
Against that, 7 of the 2020 Top 20 have over 15 years track record, so Hedge Clippings is pleased to see that age doesn't automatically exclude quality.
The average return of the 2020 Top 10 was +31% with a Sharpe of 1.65 against a market backdrop of -7.68% for the ASX200 and +7.51% for the S&P500.
Every PDS and IM warns that past returns are no guarantee of future performance, BUT, we do like to think that if a manager can navigate the volatility of the past 12 months and perform well, it augurs well for agility and being able to perform in a variety of conditions.
And as an avid (albeit old and conservative) believer in disruption and the future, Hedge Clippings also points to the fact that markets, or more accurately, economies, have changed, as have business models and valuations of stocks such as Afterpay and Tesla.
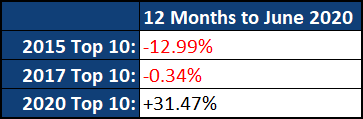
For the record, an equally weighted portfolio of the Top 10 Funds in 2015, 2017 and 2020 would have returned the following in the 12 months to June 2020:
|