

No events currently listed.
August 2026
RBA - Monetary Policy Decision
Find a Fund
Peer Group Analysis »
| Index Selector Links | 1 Year | 3 Year | 5 Year |
|---|---|---|---|
11.25% |
8.19% |
7.54% |
|
4.48% |
5.51% |
3.11% |
|
-27.25% |
16.08% |
11.04% |
|
5.54% |
8.96% |
3.60% |
|
6.60% |
8.27% |
5.99% |
|
19.08% |
13.72% |
9.43% |
|
7.86% |
11.60% |
6.63% |
|
19.26% |
13.81% |
5.47% |
|
1.86% |
7.63% |
5.79% |
|
11.27% |
14.35% |
8.58% |
|
4.28% |
9.68% |
4.15% |
|
15.71% |
16.23% |
7.15% |
|
4.14% |
5.45% |
1.94% |
|
11.21% |
11.14% |
9.69% |
|
9.07% |
8.79% |
5.71% |
|
6.54% |
8.32% |
7.06% |
|
1.37% |
2.53% |
1.25% |
|
8.52% |
8.92% |
8.12% |
Hedge Clippings

Hedge Clippings | 31 July 2026
Four separate data points landed this week and pointed in the same direction: housing demand is slowing more sharply than the RBA expected, while inflation undershot market and RBA forecasts.
Read more...

3 Aug 2026
Global Equity Peer Group Review
This review presents the FundMonitors.com database's three global equity peer groups together: 157 long only large cap funds, 34 long only small and mid cap funds, and 52...

3 Aug 2026
Manager Insights | FarmCap
Chris Gosselin, CEO of FundMonitors.com, speaks with Jonathan Weinstock, Founder and Managing Director at FarmCap.

31 Jul 2026
Performance Report: Cyan C3G Fund
The Cyan C3G Fund returned -0.63% in June, outperforming the ASX Small Ordinaries Total Return benchmark by +1.37%. The fund has delivered positive returns 78% of the time...

31 Jul 2026
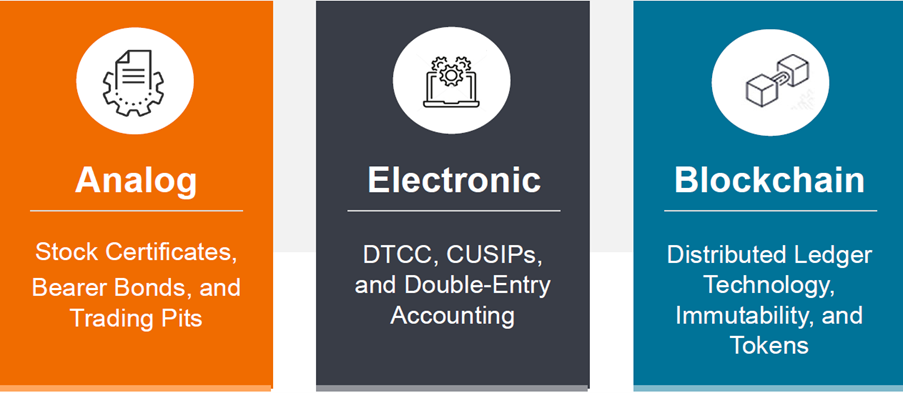
Tokenisation: Why blockchain rails could redefine...
Innovation Strategist Patrik Björklund examines why tokenisation may be nearing an inflection point in institutional finance. As blockchain infrastructure matures, benefits...

30 Jul 2026
Performance Report: Equitable Investors Dragonfly...
The Equitable Investors Dragonfly Fund rose by +14.79% in June, outperforming the ASX 200 Total Return benchmark by +14.12%.

30 Jul 2026
Why even the world's best players need a team
The best portfolios are greater than their parts. (3-minute read)

29 Jul 2026
Performance Report: Bennelong Twenty20 Australian...
The Bennelong Twenty20 Australian Equities Fund rose by +0.33% in June. Since its inception in November 2009, the fund has returned +8.72% per annum, an outperformance of...

28 Jul 2026
Performance Report: Altor AltFi Income Fund
The Altor AltFi Income Fund rose by +0.74% in June. Since its inception in April 2018, the fund has returned +11.48% per annum, an outperformance of +4.29% relative to the...

28 Jul 2026
Glenmore Asset Management - Market Commentary
Global equity markets were again volatile in June. (2-minute read)

27 Jul 2026
Performance Report: Bennelong Long Short Equity...
The Bennelong Long Short Equity Fund rose by 1.66% in June, outperforming the ASX 200 Total Return benchmark by +0.99%. Since its inception in February 2002, the fund has...
3 Aug 2026
Manager Insights | FarmCap
Chris Gosselin, CEO of FundMonitors.com, speaks with Jonathan Weinstock, Founder and Managing Director at FarmCap.

6 Jul 2026
The changing world order and what it means for...
Geopolitical events are no longer just creating short-term market volatility, they're reshaping the global investment landscape in more lasting ways. (38-minutes)
30 Jun 2026
Netflix: Navigating deals, AI and growth
As streaming competition intensifies and AI reshapes the media landscape, Deputy Portfolio Manager Ryan Joyce explores how Netflix is navigating a pivotal period for the...
19 Jun 2026
Expert Analysis of the RBA's June 16 Rate Decision
Chris Gosselin, CEO of FundMonitors.com, speaks with Nicholas Chaplin, Director and Portfolio Manager at Seed Funds Management.

2 Jun 2026
National Adviser Roadshow - The Great Mispricing
Emma Fisher, Airlie's Deputy Head of Australian Equities, explores the "Great Mispricing" we're currently witnessing in Australian equities and where she is uncovering...
1 Jun 2026
Manager Insights | Digital Asset Funds Management
Chris Gosselin, CEO of FundMonitors.com, speaks with Clint Maddock, Director and Co-Founder at Digital Asset Funds Management. Clint discussed how the fund has remained...
21 May 2026
Global Perspectives: Addressing the most...
In this episode, Portfolio Manager Denny Fish takes a deep dive into the current state of artificial intelligence (AI), including the latest advancements, its potential to...
20 May 2026
Who's winning the AI race - and does it matter?
In this episode, we explore how artificial intelligence (AI) is reshaping global competition. (Duration: 27 Mins)

15 May 2026
Manager Insights | Datt Capital
Chris Gosselin, CEO of FundMonitors.com, speaks with Emanuel Datt, founder and Chief Investment Officer at
Datt Capital.
Datt Capital.
8 May 2026
Expert Analysis of the RBA's May 5 Rate Decision
Chris Gosselin, CEO of FundMonitors.com, speaks with Nicholas Chaplin, Director and Portfolio Manager at Seed Funds Management and Renny Ellis, Director & Head of Portfolio...
AFM News / Info
Global Equity Peer Group Review
This review presents the FundMonitors.com database's three global equity peer groups together: 157 long only large cap funds, 34 long only small and mid cap funds, and 52 alternative structure funds spanning long/short, geared, market...
Read more...
Online Applicatons

Free, simple and secure
Olivia123 - the fast simple and secure online alternative to completing paper based application forms.
Featured Funds
Education
What Our Clients Say
"I've been subscribing to AFM for over two years and love it. The ability to compare funds, do in-depth research and gain data-driven insights into performance metrics and performance rankings in a highly visual way is second to none. Highly recommended."
~ James Waggett,
Managing Director of Waggett Wealth Advice Ltd