NEWS

18 Jun 2026 - Funding renewable projects across the world
|
Funding renewable projects across the world Pendal June 2026 (2 minutes read time) |
Around two thirds of global emissions come from electricity generation. Renewables and low carbon energy is a fundamental requirement in the transition to a net zero world. Regnan Credit Impact Trust and Pendal Sustainable Australian Fixed Interest Fund invested in an AUD green bond by the Canada Pension Plan Investment Board (CPP Investments). CPP Investments is controlled by the Canadian government and is one of the largest pension funds in the world. It issued its first green bond in 2018[1] and continues to raise funds for investments in renewable energy and energy efficiency, low carbon and clean transportation and green buildings. In the past, these types of bonds have invested in renewable energy projects across the world. This includes two wind parks in northeastern Brazil run by Votorantim Energia, six wind and solar power projects in Canada operated by Cordelio Power, and three offshore wind farms in France that are under construction by Maple Power. We anticipate this green bond to invest in similar types of projects. A component of investing in this green bond includes reporting of environmental impact indicators associated with underlying projects. This includes renewable energy generated per year, emissions avoided, waste reused or recycled, and reduction in air pollutants due to implementing low carbon and clean transportation. |
|
Funds operated by this manager: Pendal MicroCap Opportunities Fund , Pendal Global Select Fund - Class R , Pendal Sustainable Australian Fixed Interest Fund - Class R , Pendal Focus Australian Share Fund , Pendal Horizon Sustainable Australian Share Fund , Regnan Credit Impact Trust Fund , Pendal Sustainable Australian Share Fund , Pendal Sustainable Balanced Fund - Class R , Pendal Multi-Asset Target Return Fund |
|
This information has been prepared by Pendal Fund Services Limited (PFSL) ABN 13 161 249 332, AFSL No 431426 and is current as at December 8, 2021. PFSL is the responsible entity and issuer of units in the Pendal Multi-Asset Target Return Fund (Fund) ARSN: 623 987 968. A product disclosure statement (PDS) is available for the Fund and can be obtained by calling 1300 346 821 or visiting www.pendalgroup.com. The Target Market Determination (TMD) for the Fund is available at www.pendalgroup.com/ddo. You should obtain and consider the PDS and the TMD before deciding whether to acquire, continue to hold or dispose of units in the Fund. An investment in the Fund or any of the funds referred to in this web page is subject to investment risk, including possible delays in repayment of withdrawal proceeds and loss of income and principal invested. This information is for general purposes only, should not be considered as a comprehensive statement on any matter and should not be relied upon as such. It has been prepared without taking into account any recipient's personal objectives, financial situation or needs. Because of this, recipients should, before acting on this information, consider its appropriateness having regard to their individual objectives, financial situation and needs. This information is not to be regarded as a securities recommendation. The information may contain material provided by third parties, is given in good faith and has been derived from sources believed to be accurate as at its issue date. While such material is published with necessary permission, and while all reasonable care has been taken to ensure that the information is complete and correct, to the maximum extent permitted by law neither PFSL nor any company in the Pendal group accepts any responsibility or liability for the accuracy or completeness of this information. Performance figures are calculated in accordance with the Financial Services Council (FSC) standards. Performance data (post-fee) assumes reinvestment of distributions and is calculated using exit prices, net of management costs. Performance data (pre-fee) is calculated by adding back management costs to the post-fee performance. Past performance is not a reliable indicator of future performance. Any projections are predictive only and should not be relied upon when making an investment decision or recommendation. Whilst we have used every effort to ensure that the assumptions on which the projections are based are reasonable, the projections may be based on incorrect assumptions or may not take into account known or unknown risks and uncertainties. The actual results may differ materially from these projections. For more information, please call Customer Relations on 1300 346 821 8am to 6pm (Sydney time) or visit our website www.pendalgroup.com |

17 Jun 2026 - Are we losing the AGM,and does it matter?

16 Jun 2026 - Federal Budget 2026-27: Winners, Losers and Opportunities for the Mining Sector

15 Jun 2026 - Pressure at the pump

12 Jun 2026 - Frontier market bonds: the next phase of diversification
|
Frontier market bonds: the next phase of diversification abrdn May 2026 (Duration: 4 Mins) Frontier market bonds are moving out of the margins of portfolios and into sharper focus. As emerging market debt has matured, investors are looking further down the development curve - towards economies offering higher yield and return potential, driven less by global macro and more by idiosyncratic country fundamentals. That last point matters. Over the past decade, frontier market bonds have shown a correlation of just 0.03 to US Treasuries, highlighting how differentiated this segment can be [1]. In an environment where diversification is harder to achieve, that kind of independence is rare and valuable. But this is not just a diversification story. Frontier markets themselves are changing - structurally, economically and financially - in ways that are reshaping the investment case. Opening the gatesFrontier economies have historically been defined by limited market access and reliance on official financing. That is changing. Over time, issuance of Eurobonds bonds has increased, policy frameworks have improved, and foreign investor participation has broadened. Recent activity underlines the shift. In March 2026, the Democratic Republic of Congo came to market with six- and 11-year bonds that were around four times oversubscribed, signalling strong demand even in less established markets. Elsewhere, repeat issuance from countries such as Kenya, Nigeria, Ghana and Zambia is reinforcing the depth of the opportunity. Local currency markets are also growing rapidly. Following the pandemic, several countries have liberalised foreign exchange regimes, tightened monetary policy and undertaken fiscal consolidation, attracting renewed portfolio inflows. Markets such as Nigeria, Egypt and Kazakhstan are increasingly accessible and relevant to global investors. The engines of expansion
Beyond capital markets, frontier economies are benefiting from powerful long-term trends. Demographics is one. Over the next two decades, hundreds of millions of people will join the workforce across frontier markets, supporting consumption, investment and productivity growth. This so-called 'demographic dividend' remains largely untapped. Technology is another. In 2010, there were just 13 million mobile money accounts globally. By 2024, that figure had reached nearly 800 million, with much of the growth concentrated in Sub-Saharan Africa [2]. Financial inclusion is improving quickly, bringing more people into the formal economy and accelerating development. Natural resources also play a critical role. Frontier markets account for a meaningful share of global production in several key commodities. Gabon produces almost a quarter of global manganese output, Morocco around one eighth of phosphate rock, and Nigeria and Rwanda together supply more than a third of tantalum - all essential inputs for batteries, fertilisers and digital technologies. At the same time, efforts by developed and emerging economies to diversify energy sources are supporting the trade balances of many frontier countries, strengthening external positions and improving resilience. Returns that behave differently
For investors, these structural shifts are translating into a distinctive return profile. Frontier market sovereign bonds have delivered annualised returns of 8.22% over the past decade, broadly comparable to emerging market equities, but with significantly lower volatility [3]. This combination reflects the idiosyncratic nature of frontier markets. Returns are often driven less by global macro conditions and more by country-specific developments such as policy reforms, commodity dynamics or political shifts. That can create both opportunity and mispricing. Countries undergoing reform or recovery can reprice quickly, while others facing stress may offer attractive entry points for investors with the expertise to assess long-term value. Recent market behaviour illustrates this dynamic. Following the 'Liberation Day' sell-off in 2025, frontier bonds rebounded sharply and went on to deliver close to 20% total returns over 2025 [4]. Risks remain - but so does progressNone of this is to underplay the risks. Frontier markets still face challenges around liquidity, currency volatility and governance. Over the past six years, 10 countries have defaulted on external debt, reminding investors of the potential for stress. Liquidity, in particular, remains a defining feature. Frontier markets are generally thinner and less actively traded than their emerging market counterparts, leading to wider spreads and sharper price movements during periods of volatility. However, the direction of travel is improving. Policy credibility has strengthened in many countries, and responses to shocks are becoming more orthodox. Post the outbreak of the conflict in Iran, Egypt's decision to allow currency depreciation as a shock absorber, rather than exhaust reserves, is one example of a more disciplined approach. At the same time, fiscal and debt metrics are improving in several markets. Angola provides a clear case: its debt-to-GDP ratio has fallen sharply from pandemic-era highs of around 120% to roughly 50% in recent years, supported by higher oil prices and policy reform [5]. Final thoughts...Frontier market debt remains a specialist area, and it is not suitable for every investor. But as market access improves, local currency markets deepen and global diversification becomes more challenging, its relevance is growing. For those able to navigate the complexity, the opportunity is clear: a segment of the fixed income universe that offers genuinely differentiated returns, exposure to structural growth, and a set of risks that are - increasingly - better understood and better managed. That combination is what makes frontier market bonds less of a curiosity, and more of a natural next chapter for investors navigating a changing fixed income landscape. [1] Source: Bloomberg, 31 December 2025. [2] Source: World Bank, February 2026. [3] Source: J.P. Morgan, January 2026. [4] Aberdeen Investments, December 2025. [5] Aberdeen Investments/IMF, 2026. |
|
Funds operated by this manager: abrdn Sustainable Asian Opportunities Fund , abrdn Emerging Markets Equity Fund , abrdn Sustainable International Equities Fund , abrdn Global Corporate Bond Fund (Class A) |

11 Jun 2026 - What we learnt from the AI SaaSpocalypse: Opportunities in SaaS and beyond

10 Jun 2026 - Australian Secure Capital Fund - Property Update
|
Australian Secure Capital Fund - Property Update Australian Secure Capital Fund May 2026 (1-minute read)
April was a slower month for Australian property values, posting a national rise of 0.3%, the lowest monthly growth rate since January 2025. Once again, Perth (+2.1%) led the way with a fourth consecutive monthly rise of greater than 2%, with its annual increase now reaching 26%. Likewise, Brisbane (+1.2%) and Adelaide (+1.1%) continued to add value, again posting monthly increases of greater than 1%. However, values in Melbourne and Sydney (both -0.6%) declined for a third straight month. Additionally, estimates of capital city home sales over the past three months were down 5.4% compared to last year and 7.4% below the previous five-year average, indicating a slowdown in buyer demand. Regional areas have been more resilient in the face of this, with values increasing by 4.2% over the first four months of the year, compared to 1.8% for the capital cities.
April Edition Funds operated by this manager: ASCF Select Income Fund , ASCF High Yield Fund , ASCF Premium Capital Fund , ASCF Private Fund
|


9 Jun 2026 - Shock absorption: managing the impact of the Middle East conflict on listed infrastructure

5 Jun 2026 - What a Structural Shift in Yields Means for Portfolios
|
What a Structural Shift in Yields Means for Portfolios JCB Jamieson Coote Bonds May 2026 (6-minute read) Government bond yields around the world have reached decade highs, driven by higher energy costs and potentially ongoing inflationary pressures stemming from the U.S.-Iran conflict and disruption to global oil supply routes. Beyond the immediate conflict, there are structural reasons yields may stay elevated. Government balance sheets across many advanced economies are increasingly stretched, with debt-fuelled expenditure supporting ambitious policy reforms - from defence to energy transition. Beyond determining government borrowing costs, yields play a central role within the financial system. As the risk-free rate of interest, they underpin the cost of capital across the economy, meaning the current move higher in yields has implications well beyond bonds, reshaping valuations across equities, credit and real assets. If government bond yields stay higher for longer across most of the world, the cost of capital will also rise inexorably. Higher yields translate directly into higher discount rates, and that matters for every asset in a portfolio. Whether its equities, credit or property, valuations are derived by discounting future cash flows at the risk-free rate plus a premium for investment risk. When that base rate moves higher, asset prices adjust lower. A higher cost of capital will likely prompt investors to revise their hurdle rates higher for all investment opportunities and may suggest a more cautious approach to investment risk in general. This could reveal vulnerabilities across asset classes which have benefited from a secular decline in interest rates, and therefore the cost of capital, over the past several decades. Infrastructure, private credit and private equity have benefited from the valuation effects of a relatively low cost of capital, but this is now set to change as higher hurdle rates and revaluations unveil which asset classes and investment strategies can continue to sustain and deliver compelling risk-adjusted returns, and which will struggle to do so going forward. "When the risk-free rate rises, every asset is repriced." Higher bond yields increase discount rates across equities, credit and property--resetting valuations and raising hurdle rates for all investments. Turning to domestic developments, this month's Commonwealth Budget brought significant tax reform and policy announcements alongside a compositional change in revenue and expenditure forecasts that led to modest improvements in the budget balance over the next decade. Drilling into the tax policy changes, reforms to capital gains tax (CGT) and negative gearing may make property as an asset class less attractive to investors and dampen investment activity in the property market. Some analysts forecast a consequent moderation in house prices across the country and frame the contractionary economic effects of the tax reforms as akin to that of one or two RBA rate hikes, foreshadowing the conclusion of an already well progressed RBA rate hike cycle. As investors reassess their portfolios for tax efficiency under the new CGT regime, fixed income and other income generating assets such as high dividend domestic equities could be well placed to benefit from this shift in focus. Ultimately, the budget forecasts depict Australia's fiscal conditions in a highly favourable light relative to our peers, and re-affirms that Australia's government debt remains very low by global standards. For investors, this environment calls for a fundamental reassessment of portfolio construction - where return is coming from, what risks are being compensated, and whether allocations built in a low-rate world remain fit for purpose in a higher-rate one. Funds operated by this manager: CC Jamieson Coote Bonds Active Bond Fund (Class A) , CC Jamieson Coote Bonds Dynamic Alpha Fund This information is for professional and wholesale investors only and has been prepared by JamiesonCooteBonds Pty Ltd ACN 165 890 282 AFSL 459018 ('JCB'). Channel Investment Management Limited ACN 163 234 240 AFSL 439007 ('CIML') is the Responsible Entity and issuer of units for the CC JCB Active Bond Fund ARSN 610 435 302, CC JCB Global Bond Fund ARSN 631 235 553 and the CC JCB Dynamic Alpha Fund ARSN 637 628 918 (collectively 'the Funds'). Channel Capital Pty Ltd ACN 162 591 568 AR No. 001274413 ('Channel') provides investment infrastructure and distribution services for JCB and is the holding company of CIML. |

4 Jun 2026 - Global smaller companies: When everyone owns the same names, what next?
|
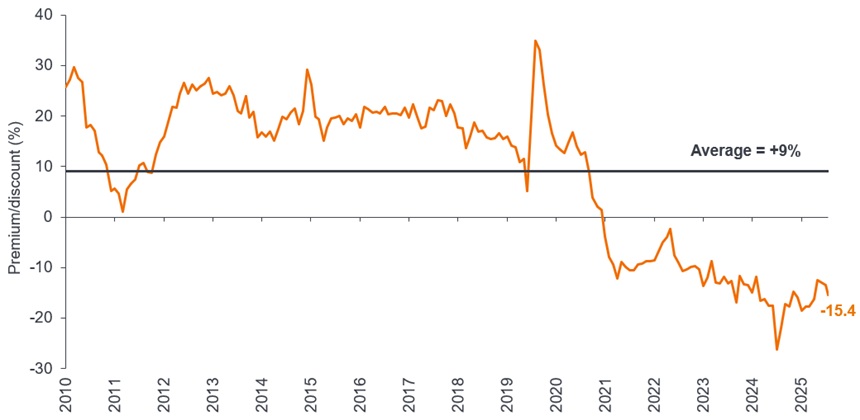
Global smaller companies: When everyone owns the same names, what next? Janus Henderson Investors May 2026 (8-minute read) Portfolio Manager Nick Sheridan explores why shifting market leadership, geopolitical uncertainty, and changing investor behaviour are bringing smaller companies back into focus, offering a broader set of opportunities beyond the most crowded trades. Markets started 2026 on an uncertain footing, pulled in different directions by geopolitical instability. The conflict in the Middle East, which began at the end of February, brought energy markets back into stark focus. Blocked supplies through the Strait of Hormuz pushed oil prices higher and raised fresh concerns about inflation just as central banks were attempting to stabilise growth. For investors, this has created a challenging mix of risks and uncertainties. Risk appetite has weakened as attention has become fixed on the conflict and its implications. Meanwhile, expectations for fiscal and monetary policies have shifted. Higher energy prices have complicated the outlook for interest rates. The uncertainty of government policy announcements via social has led to rapid swings in sentiment. The path to a lasting resolution remains obscured. Despite this backdrop, one notable feature of recent market behaviour has been the resilience of global smaller companies. This is typically the part of the market that struggles when uncertainty is elevated and policy is restrictive. In our view, this reflects modest starting valuations, positive earnings expectations, and a gradual shift in how investors are approaching markets. But even periods of tentative improvement in sentiment have seen investors look beyond the most heavily owned areas, suggesting that attention is no longer as narrowly focused as it once was. A turning point for market concentration Over the past decade, market returns have been dominated by a small group of large-cap technology companies (ie. the 'Magnificent 7' - Apple, Microsoft, Alphabet, Amazon, Meta, Nvidia and Tesla). At the same time, higher interest rates, macro uncertainty, and a preference for liquidity has favoured larger, more resilient businesses. Combined with passive flows, this has created an increasingly concentrated market, turning investor allocations into a tacit call on technology stocks. What appears to be changing is not a sudden reversal but a gradual broadening of leadership. The focus is shifting from owning what has worked to reassessing where future returns may come from. It has been driven by a subtle change in behaviour, with investors showing greater sensitivity to valuation, a more questioning approach to crowded trades, and growing awareness of how concentrated portfolios have become, particularly at a time of heightened geopolitical uncertainty. The dominance of the largest companies has not disappeared, but it is no longer unquestioned. Artificial intelligence remains a powerful structural theme, yet investors are starting to look beyond the most obvious beneficiaries, to smaller companies exposed to adjacent areas of growth. At the same time, the earnings picture for smaller companies is improving. Combined with more modest starting valuations relative to global large caps (Exhibit 1), we believe it supports the conditions for a re-rating, even in an uneven market. Exhibit 1: Attractive valuations of global small caps relative to large caps
Source: Bloomberg, Janus Henderson Investors Analysis, as at 9 April 2026. Shows global small cap premium/discount versus global large caps (forward P/Es). Different regions, different strengths Much like their larger counterparts, global smaller companies provide exposure to a diverse set of local economies and sector opportunities. Unlike large multinationals, however, they tend to be more closely tied to domestic or regional growth, which can be an advantage in a more fragmented geopolitical environment. They also tend to be more entrepreneurial and agile, often driving advances within specialised niches, rather than at scale. Another defining feature is how little attention they receive. Smaller companies are typically under-owned and under-researched, with materially less coverage from stock analysts. A combination of less scrutiny and more varied outcomes creates opportunity for active investors taking a selective approach. Particularly so, given how strong earnings forecasts are for smaller companies relative to their large-cap peers[1]. But there are also important differences across regions, offering built-in diversification within the small-cap category. In the US, deep capital markets and a strong culture of innovation support a broad pipeline of companies across technology, healthcare, and specialised industrials. In Europe, the market is more weighted towards industrials, manufacturing, and niche export-led businesses. Many of these have strong technical expertise and pricing power, alongside tailwinds from defence and infrastructure spending. Japan offers another distinct profile, characterised by high-quality industrial and technology businesses. Improving corporate governance and a greater focus on shareholder returns are helping to unlock value in companies that have historically been overlooked. Market inefficiency equals opportunity for active investors Global smaller companies remain one of the few areas of genuine inefficiency in equity markets. Limited analyst coverage and the diversity of the opportunity set mean there is real scope to add value through detailed research and engagement. This increases the value of information in the small cap space, given that outcomes in smaller companies are driven more by stock-level factors than by broad market movements. Sector and stock dispersion is wide, meaning the gap between winners and losers can be significant. This makes a research-led, data-driven approach essential, with a focus on characteristics such as return on equity, balance sheet strength, and the sustainability of earnings. For investors willing to take a longer-term view, this part of the market offers exposure to businesses earlier in their growth journey. After all, many of today's dominant companies, such as Nvidia, began as small caps. This is not to overlook the risks; smaller companies can be more volatile and more sensitive to economic cycles. Navigating these risks requires a disciplined, structured approach to stock selection. Overall, we believe that global smaller companies continue to offer a compelling opportunity set. In a market long dominated by a narrow group of large-cap stocks, they provide diversification, exposure to innovation, and access to domestic growth trends across regions. The macro environment remains uncertain. However, for investors focused on fundamentals, the breadth of opportunities within global smaller companies remains significant. References made to individual securities do not constitute a recommendation to buy, sell or hold any security, investment strategy or market sector, and should not be assumed to be profitable. Janus Henderson Investors, its affiliated advisor, or its employees, may have a position in the securities mentioned. [1] Source: Bloomberg, Janus Henderson Investors, as at 9 April 2026. There is no guarantee that past trends will continue, or forecasts will be realised. Past performance does not predict future returns. Active investing: An investment management approach where a fund manager actively aims to outperform or beat a specific index or benchmark through research, analysis, and the investment choices they make. Asset allocation: The allocation of a portfolio between different asset classes, sectors, geographical regions, or types of security to meet specific objectives of risk, performance, or time horizon. Balance sheet: A financial statement that summarises a company's assets, liabilities, and shareholders' equity at a particular point in time. Each segment gives investors an idea as to what the company owns and owes, as well as the amount invested by shareholders. Diversification: A way of spreading risk by mixing different types of assets or asset classes in a portfolio on the assumption that these assets will behave differently in any given scenario. Assets with low correlation should provide the most diversification. Inflation: The rate at which the prices of goods and services are rising in an economy. The consumer price index (CPI) and retail price index (RPI) are two common measures. Interest rates: The amount charged for borrowing money, shown as a percentage of the amount owed. Base interest rates (the Bank Rate) are generally set by central banks, such as the Federal Reserve in the US or Bank of England in the UK, and influence the interest rates that lenders charge to access their own lending or saving. Liquidity: A measure of how easily an asset can be bought or sold in the market. Assets that can be easily traded in the market in high volumes (without causing a major price move) are referred to as 'liquid'. Premium: When the market price of a security is thought to be more than its underlying value, it is said to be 'trading at a premium'. Return on equity (ROE): A company's net income (income minus expenses and taxes) over a specified period, divided by the amount of money its shareholders have invested. It is used as a measurement of a company's profitability compared to its peers. A higher ROE generally indicates that a management team is more efficient at generating a return from investment. Returns/return: The total return of a portfolio over a specified period as opposed to its relative return against a benchmark. It is measured as a gain or a loss and stated as a percentage of a portfolio's total value. |
|
Funds operated by this manager: Janus Henderson Australian Fixed Interest Fund , Janus Henderson Conservative Fixed Interest Fund , Janus Henderson Diversified Credit Fund , Janus Henderson Global Natural Resources Fund , Janus Henderson Tactical Income Fund , Janus Henderson Australian Fixed Interest Fund - Institutional , Janus Henderson Conservative Fixed Interest Fund - Institutional , Janus Henderson Cash Fund - Institutional , Janus Henderson Global Multi-Strategy Fund , Janus Henderson Global Sustainable Equity Fund , Janus Henderson Sustainable Credit Fund All opinions and estimates in this information are subject to change without notice and are the views of the author at the time of publication. Janus Henderson is not under any obligation to update this information to the extent that it is or becomes out of date or incorrect. The information herein shall not in any way constitute advice or an invitation to invest. It is solely for information purposes and subject to change without notice. This information does not purport to be a comprehensive statement or description of any markets or securities referred to within. Any references to individual securities do not constitute a securities recommendation. Past performance is not indicative of future performance. The value of an investment and the income from it can fall as well as rise and you may not get back the amount originally invested. Whilst Janus Henderson believe that the information is correct at the date of publication, no warranty or representation is given to this effect and no responsibility can be accepted by Janus Henderson to any end users for any action taken on the basis of this information. |