
NEWS

Performance Report: Bennelong Australian Equities Fund
The Bennelong Australian Equities Fund rose by +3.63% in April, outperforming the ASX 200 Total Return benchmark by +1.45%. Since inception in February 2009, in the months where the market was positive, the fund has provided positive...
Read more...

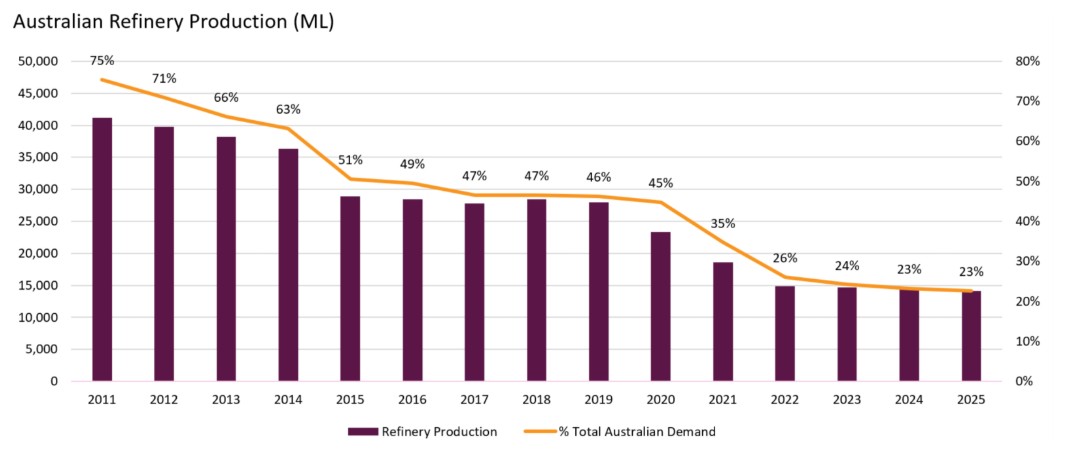
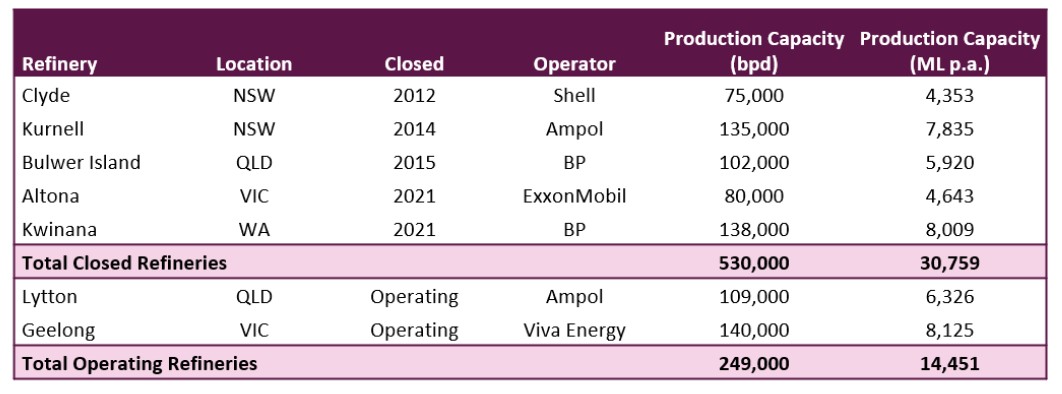
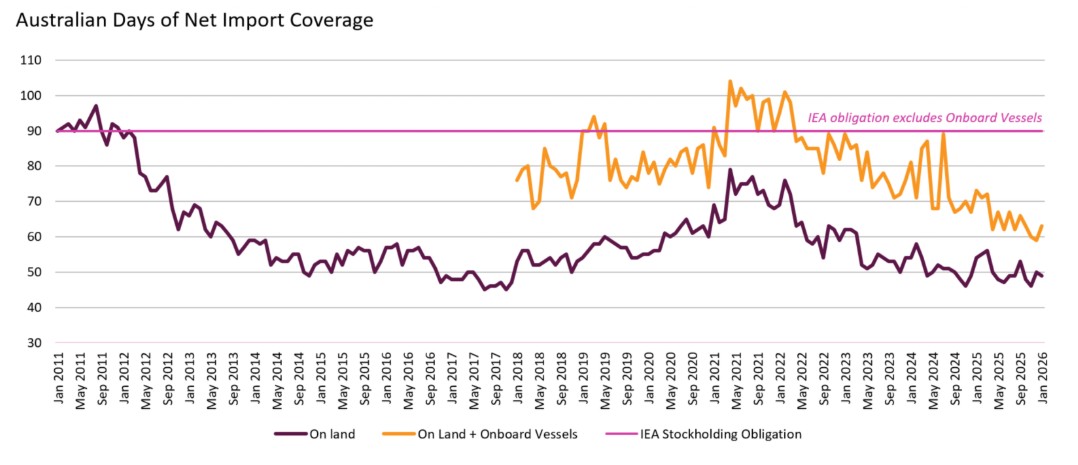
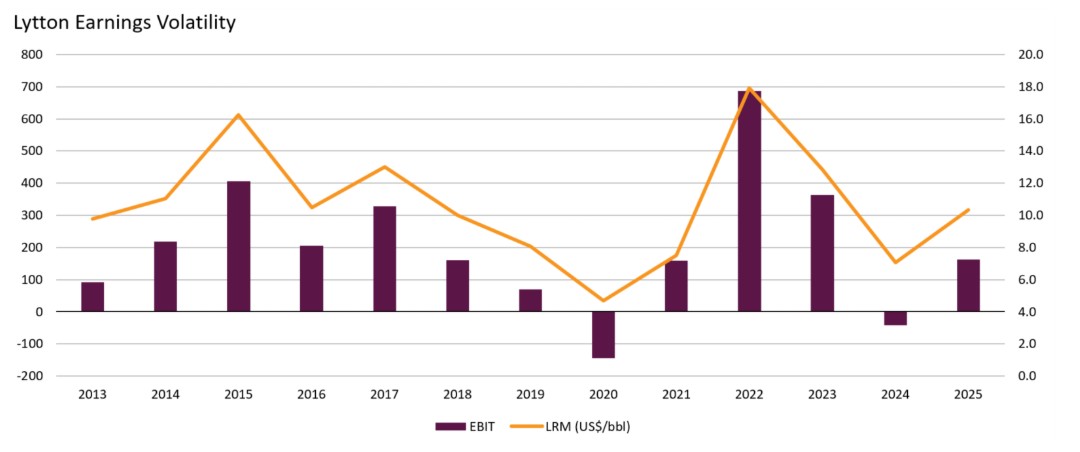
Stock Story: Ampol
Pathway to unlocking value outside the headlines. (5-minute read)
Read more...

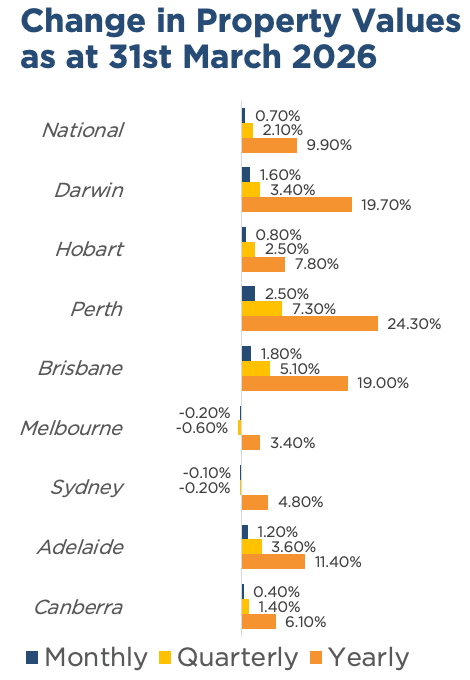
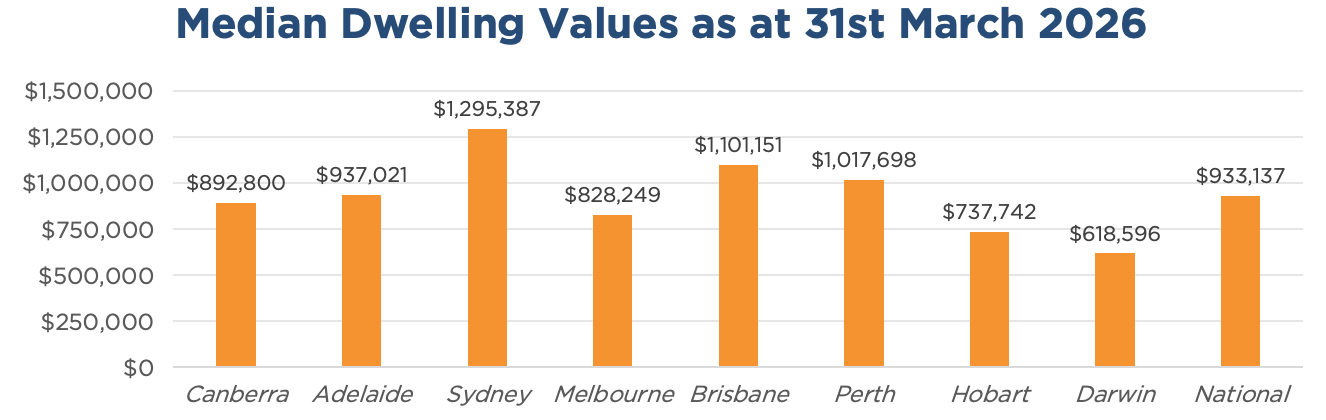
Australian Secure Capital Fund - Property Update
March was another steady month for Australian property values, posting a national rise of 0.7%, down slightly from 0.8% in February. (1-minute read)
Read more...

Manager Insights | Altor Capital
Chris Gosselin, CEO of FundMonitors.com, speaks with Benjamin Harrison, Chief Investment Officer at Altor Capital.
Read more...

Expert analysis on what the RBA will do next Tuesday, May 5
Chris Gosselin, CEO of FundMonitors.com, speaks with Nicholas Chaplin, Director and Portfolio Manager at Seed Funds Management and Renny Ellis, Director & Head of Portfolio Management at Arculus Funds Management.
Read more...

Hedge Clippings | 01 May 2026
The March inflation number looks ugly at first glance. Headline CPI jumped to 4.6%, up from 3.7% in February, with transport, housing and food doing much of the damage.
Read more...

Performance Report: Equitable Investors Dragonfly Fund
The Equitable Investors Dragonfly Fund has delivered positive returns 58% of the time since inception in September 2017, in months when the market was positive. March was a challenging month for microcaps, with Energy Technologies the top...
Read more...
Performance Report: Bennelong Twenty20 Australian Equities Fund
The Bennelong Twenty20 Australian Equities Fund has delivered positive returns 93% of the time since inception in November 2009, in months when the market was positive.
Read more...

Performance Report: Glenmore Australian Equities Fund
The Glenmore Australian Equities Fund has returned +16.73% per annum since its inception in June 2017, an outperformance of +8.08% relative to the ASX 200 Total Return benchmark which has returned +8.65% on an annualised basis over the same period.
Read more...

Performance Report: Cyan C3G Fund
The Cyan C3G Fund has delivered positive returns 77% of the time since inception in August 2014, in months when the market was positive.
Read more...