
NEWS

11 Apr 2025 - Performance Report: DS Capital Growth Fund
[Current Manager Report if available]

11 Apr 2025 - Performance Report: Quay Global Real Estate Fund (Unhedged)
[Current Manager Report if available]

11 Apr 2025 - Data is (still) the "new oil"
|
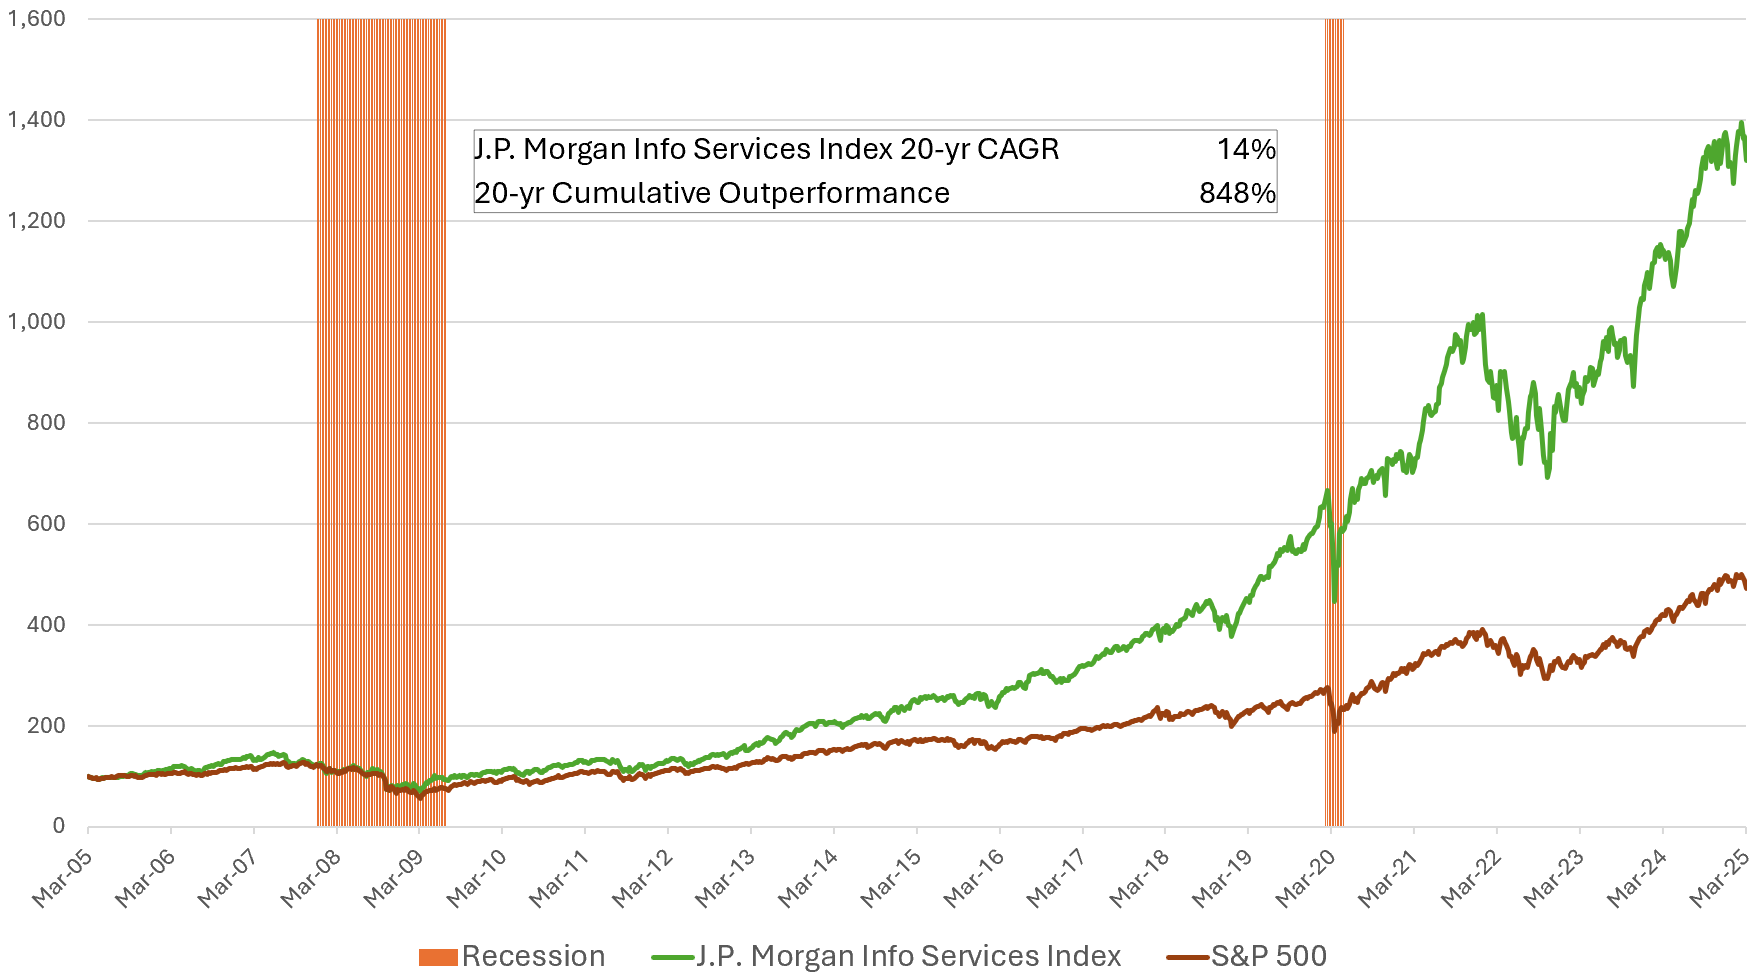
Data is (still) the "new oil" Janus Henderson Investors March 2025 Exploring the transformative power of data in the digital age, we uncover the strategic advantages that position data asset companies for unprecedented growth in the AI-driven economy, while simultaneously displaying compelling sustainability alignment. IntroductionJust as oil once propelled the engines of the global economy, powering everything from vehicles to industries, data today fuels the intricate mechanisms of the digital world, driving advancements and dictating the pace of technological progress. This shift marks a profound transformation in how we perceive value and utility in the modern economy. Both oil and data are essential resources in their respective economies. Information can be extracted from data, similar to energy from oil. Data powers new technologies like driverless cars, just as oil powered traditional transportation. However, unlike oil, data is not finite, and it has lower transfer and storage costs. Data's lifecycle is also defined by relationships, while oil's is defined by processes. In this article, we delve into a journey of understanding these parallels, which sheds light on the investment opportunities of sustainable data asset companies and their influence on our future. The value of data asset companies in an AI-driven worldThe world's most valuable companies, including tech giants like Microsoft which we own in our portfolio, have set a precedent in utilising data to cement their dominance across various sectors. These data asset companies possess a unique blend of characteristics that not only allow them to thrive in today's economy but also position them to be even more valuable in an AI-driven future. One of the key attributes of these companies is their possession of extensive, proprietary data sets. Whilst some data is commoditised in nature1, in the context of an increasingly AI-centric world, the demand for high-quality, proprietary data has surged. AI and machine learning technologies require vast amounts of reliable data to train algorithms and improve their accuracy and efficiency. Public data, often plagued with issues of reliability and legal risks, such as copyright infringement, falls short of meeting these demands. As a result, companies with large and rich data troves find themselves at a strategic advantage, with the ability to fuel AI innovations. This can lead to breakthroughs in critical fields like medical diagnostics, where it can enhance accuracy, reduce errors, and democratise access to advanced medical support. Furthermore, ownership of proprietary business-to-business (B2B) data grants these companies significant pricing power, enabling them to unlock new revenue streams by monetising latent data through cross-selling, new product development, and subscription software services. The "build it once, sell it many times" database business model not only drives operating leverage but also ensures consistent and rising earnings per share and free cash flow generation for these companies. Figure 1: Information Services sector stock performance
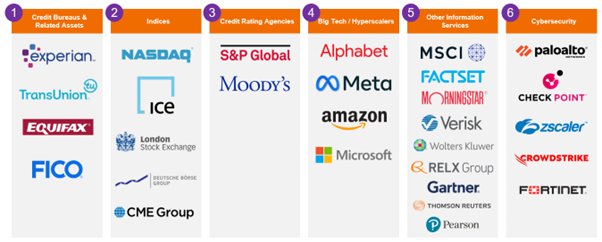
Source: J.P. Morgan and Bloomberg Finance L.P., as of 7 March 2025. CAGR = Compound annualised growth rate, which is essentially the cumulative 20-year performance represented as a return per year. Note: The firms included in the index are DNB, EFX, EXPN, FICO, MCO, MSCI, REL, SPGI, TRI, TRU, VRSK, and WKL. Recent high-profile deals and legal challenges highlight the growing recognition of the value of proprietary data for training AI models. Google's US$60 million per year agreement with Reddit2 and OpenAI's partnership with Axel Springer3 showcase the burgeoning demand for unique data sets to feed the insatiable appetite of AI algorithms. Conversely, legal disputes, such as The New York Times' lawsuit against OpenAI and Microsoft, underscore the complexities and challenges of navigating the data landscape in an AI-driven era. These developments underline the critical role of exclusive data assets in powering the next generation of AI technologies and reinforce why companies rich in these assets are poised to become even more valuable as we advance further into the AI frontier. Defining the data asset ecosystemData stands as the backbone of innovation. From tech giants harnessing big data to optimise their services, to those leveraging analytics for market insights, the ecosystem of data-related companies is as diverse as it is dynamic. Figure 2 shows one way in which we have endeavoured to segment a cross-section of these businesses into five broad verticals with a few representative examples, some of which we are exposed to in our strategy. Cybersecurity has been added as a sixth vertical, since this area is concomitant with the proliferation of data. Some of the common attributes among these verticals include exposure to recurring revenue models, critical workflow-embedded service propositions, scalability, high incremental margins, customer captivity, generally low capital expenditure requirements, and high cash flow predictability. These are all features that we value in quality businesses, which gives us some confidence that businesses of this kind could positively answer one of the two vital questions comprising our investment process: will this company compound wealth? Figure 2: Segmentation of data-related companies
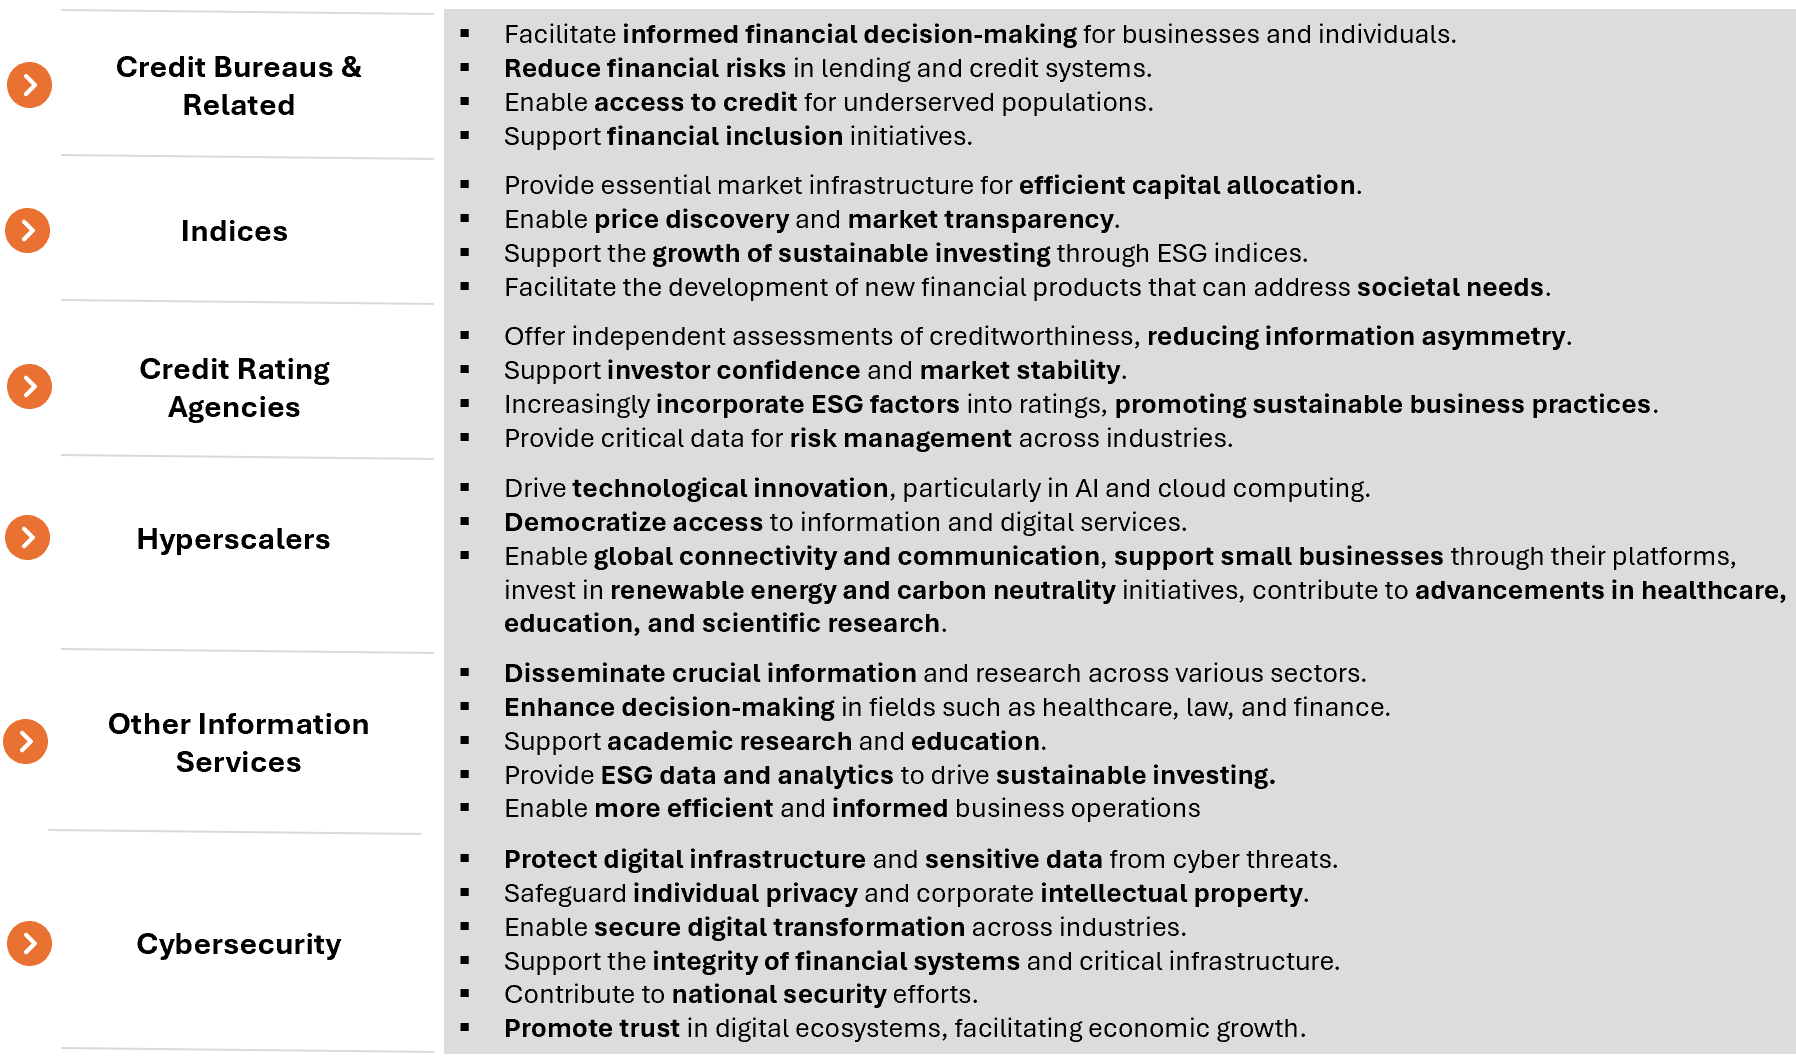
Source: Janus Henderson Investors Note: these are representative examples of companies, some of which may not fulfil the Janus Henderson Global Sustainable Equity strategy's sustainability requirements, so they should not be interpreted as an investable universe of stocks for our strategy, but rather as illustrative of the types of business models that fit into the verticals defined. The verticals defined are not exhaustive. We do deep due diligence on the sustainability profiles of companies before they enter our investable universe and abide by our exacting standards. As a team, we believe there is an inextricable link between sustainability, innovation, and long-term compounding growth. Therefore, we want to invest in compounding businesses that also answer the second question in our investment process: is the world a better place because of this company? Our research suggests that characteristics of the broad verticals that we have outlined align well with the ideals that we typically seek out in sustainable businesses, including mitigating financial risks, fostering financial inclusion, promoting market transparency, as well as democratising access to information, among others. Figure 3 highlights some of the factors that showcase the environmental and social impacts of these areas, making this entire complex an exciting place to explore from an investment research perspective. Figure 3: Sustainability alignment: Why do they make the world a better place?
Source: Janus Henderson Investors How are we playing the data-asset companies?Apart from Microsoft, our strategy is exposed to companies within the Credit Rating Agencies and Other Information Services verticals, notably, S&P Global and Wolters Kluwer. S&P Global exemplifies how data can serve as both a competitive advantage and a moat while fostering positive global outcomes. The company's extensive databases, built over decades, provide credit ratings, market intelligence, and unparalleled insights that are trusted globally. Its ability to deliver accurate, reliable, and actionable data creates high barriers to entry for competitors, solidifying its position as a leader in the financial information industry. The acquisition of IHS Markit on 28 February 2022 further enhanced S&P Global's data capabilities, enabling deeper analysis across sectors like commodities, climate change, and supply chain management. This synergy allows the company to scale its offerings and cross-sell services effectively, reinforcing its defensible business model. Moreover, S&P Global leverages advanced technologies such as AI and machine learning to innovate its analytics platforms, ensuring clients can make informed decisions efficiently. Beyond its business success, S&P Global positively impacts the world through initiatives aligned with sustainability and economic development. It supports the energy transition by providing data that helps businesses and governments address climate challenges. Additionally, its philanthropic efforts include funding job training programs for underrepresented communities and aiding vulnerable populations in adapting to climate realities. By facilitating efficient capital flows toward impactful investments, S&P Global drives innovation, job creation, and inclusive growth globally. In essence, S&P Global's mastery of data not only fortifies its competitive edge but also empowers stakeholders to tackle critical global issues, embodying the dual role of a profitable enterprise and a force for good. Wolters Kluwer is another prime example of a company leveraging data as an edge while being closely aligned with sustainability. With roots dating back to 1836, the company has evolved from traditional publishing to providing mission-critical digital solutions for professionals in healthcare, law, finance, and accounting. Its ability to manage vast amounts of data with precision and accuracy, enhanced by AI technologies, creates high barriers to entry for competitors and ensures customer trust. The company's Corporate Performance and ESG division exemplifies its data-driven strategy. By integrating financial and non-financial reporting tools, Wolters Kluwer helps businesses navigate complex ESG regulations, ensuring compliance and fostering sustainable practices. Solutions like Enablon and CCH® Tagetik empower organisations to streamline processes, enhance decision-making, and quantify ESG impacts on business performance. Wolters Kluwer also prioritises sustainability and social responsibility. It has set science-based targets to reduce greenhouse gas emissions and optimises its global office footprint with eco-friendly standards. Initiatives like solar lamp assembly for underprivileged communities highlight its commitment to societal impact. Additionally, its Risk Reporter app promotes workplace safety, showcasing innovative ways to address global challenges. By combining advanced data capabilities with a focus on sustainability and governance, Wolters Kluwer not only maintains a strong competitive advantage, but also contributes to health, justice, prosperity, and environmental protection worldwide. ConclusionThe rise of data asset companies, underscored by their strategic utilisation of proprietary data sets and their pivotal role in the advancement of AI technologies, marks a significant shift in the source of economic and technological power. These companies not only lead the charge in the current digital revolution but also lay the groundwork for a future where AI's potential can be fully realised, impacting everything from medical diagnostics to personal and business decision-making processes. The journey through the similarities and contrasts between oil and data, and the deep dive into the value and impact of data asset companies, highlights the critical importance of navigating the data landscape with foresight and strategic acumen. As we stand on the brink of an AI-driven era, the decisions made today by businesses, investors, and policymakers regarding data acquisition, usage, and governance will shape the technological advancements and societal norms of tomorrow. As W. Edwards Deming remarked - "In God we trust, all others must bring data". |
|
Funds operated by this manager: Janus Henderson Australian Fixed Interest Fund, Janus Henderson Australian Fixed Interest Fund - Institutional, Janus Henderson Cash Fund - Institutional, Janus Henderson Conservative Fixed Interest Fund, Janus Henderson Conservative Fixed Interest Fund - Institutional, Janus Henderson Diversified Credit Fund, Janus Henderson Global Equity Income Fund, Janus Henderson Global Multi-Strategy Fund, Janus Henderson Global Natural Resources Fund, Janus Henderson Tactical Income Fund All opinions and estimates in this information are subject to change without notice and are the views of the author at the time of publication. Janus Henderson is not under any obligation to update this information to the extent that it is or becomes out of date or incorrect. The information herein shall not in any way constitute advice or an invitation to invest. It is solely for information purposes and subject to change without notice. This information does not purport to be a comprehensive statement or description of any markets or securities referred to within. Any references to individual securities do not constitute a securities recommendation. Past performance is not indicative of future performance. The value of an investment and the income from it can fall as well as rise and you may not get back the amount originally invested. Whilst Janus Henderson believe that the information is correct at the date of publication, no warranty or representation is given to this effect and no responsibility can be accepted by Janus Henderson to any end users for any action taken on the basis of this information. |

10 Apr 2025 - Performance Report: Skerryvore Global Emerging Markets All-Cap Equity Fund
[Current Manager Report if available]

10 Apr 2025 - The Evolving Landscape of Fixed Income Investing

9 Apr 2025 - Performance Report: Glenmore Australian Equities Fund
[Current Manager Report if available]

9 Apr 2025 - Performance Report: Bennelong Long Short Equity Fund
[Current Manager Report if available]

9 Apr 2025 - Everyone has a plan until they get punched in the face
|
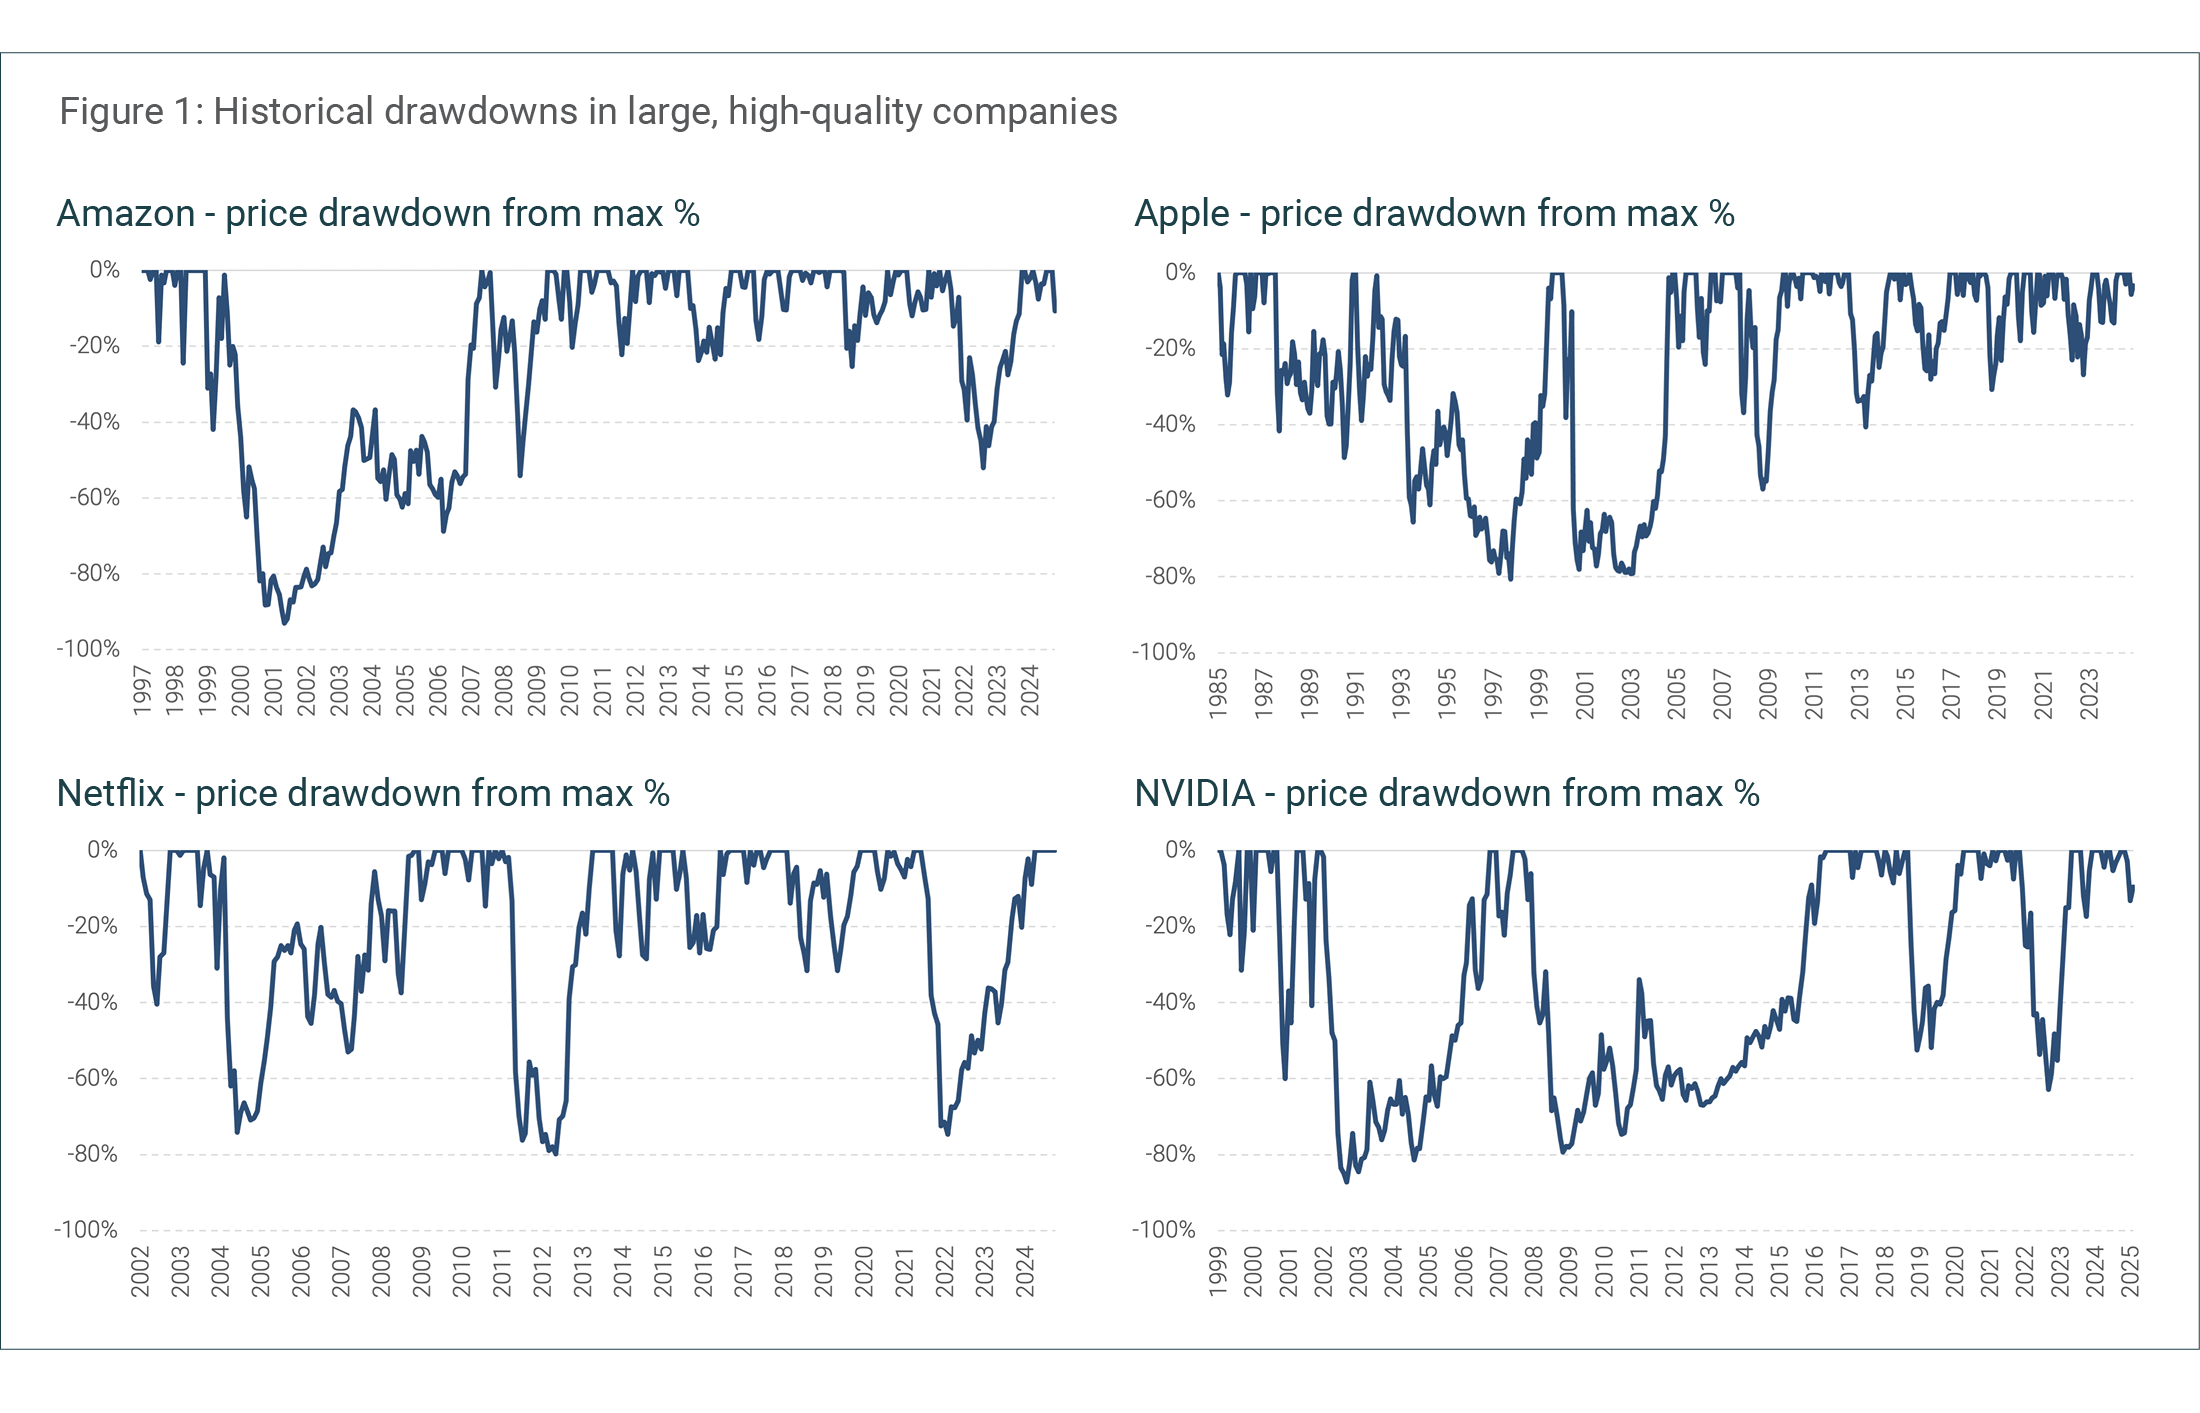
Everyone has a plan until they get punched in the face Canopy Investors March 2025 "Know what you own and know why you own it." Long-term investment success requires differentiated thinking supported by genuine conviction. At Canopy, we believe conviction cannot be borrowed or assumed; it must be built through detailed research and a deep understanding of the businesses we invest in. When markets turn volatile and uncertainty reigns, the strength of our conviction can be the difference between seizing opportunity and capitulating at precisely the wrong moment. The challenge of maintaining conviction Maintaining conviction through market volatility is one of the toughest challenges investors inevitably face. As shown in the charts below, even the largest and highest quality companies can experience significant price declines that test investor resolve. Amazon's share price fell 93% between December 1999 and September 2001, took eight years to regain its prior high, and then dropped more than 50% again during the Global Financial Crisis. Similarly, Apple, Netflix and NVIDIA have each weathered multiple declines exceeding 70% on their paths to becoming some of the world's most valuable companies.
This pattern isn't limited to a few notable exceptions. In a study of the top 100 most successful companies of each decade since 1950, Bessembinder (2020) found that even these exceptional investments experienced average drawdowns of 32.5%, lasting 10 months. Volatility has real consequences for realized investment returns. A long-running analysis by market research firm DALBAR (2022) found that, over the last three decades, the average US equity fund investor has underperformed the S&P 500 by 3-4% annually - primarily because of buying high and selling low during volatile periods. When share prices decline and negative sentiment builds, many investors abandon sound investments precisely when they should maintain or increase their positions. As Cullen Roche put it, "The stock market is the only store where, when everything is on sale, people run away." At the root of this behaviour is what we call 'borrowed conviction' - investment theses adopted from respected investors, the financial media or popular sentiment rather than developed through independent research. When negative headlines accumulate and prices fall, borrowed conviction can crumble in the face of mounting pressure to sell. Only by developing one's own conviction - built on a deep understanding of a business, its competitive advantages, its long-term prospects and cash flow generation - can investors maintain confidence in the face of market pessimism or temporary setbacks. Being different and right "To achieve superior investment results, you have to hold views that are different from the consensus and be right." - Howard Marks. Being different alone is not sufficient; contrarianism without insight typically leads to poor results. Detailed research reveals opportunities where the market's understanding is incomplete or incorrect. These opportunities often arise in several ways:
Strong conviction must be balanced with intellectual flexibility. As Charlie Munger observed, "Part of what you must learn is how to handle mistakes and new facts that change the odds." This balance helps distinguish between appropriate persistence and mere stubbornness - knowing when to hold firm in your thesis and when to adapt to new evidence. Our approach At Canopy, we have developed a structured research process designed to build knowledge, test assumptions and size positions based on conviction levels:
Investing with conviction We believe conviction built on detailed research is essential for long-term investment success. Our structured research process develops this conviction through comprehensive business analysis, clear investment theses, collaborative team input and systematic position sizing. This disciplined approach enables us to identify opportunities amid volatility and maintain positions when others capitulate. |
|
Funds operated by this manager: Canopy Global Small & Mid Cap Fund |
 Source: FactSet, Canopy Investors.
8 Apr 2025 - Performance Report: 4D Global Infrastructure Fund (Unhedged)
[Current Manager Report if available]

8 Apr 2025 - Performance Report: Bennelong Emerging Companies Fund
[Current Manager Report if available]