
NEWS

February due to reporting season, persistent AI disruption
fears and ongoing geopolitical tension. (2-minute read)
23 Mar 2026 - Glenmore Asset Management - Market Commentary
|
Market Commentary - February Glenmore Asset Management March 2026 (2-minute read) The volatility of the last few months was amplified in February due to reporting season, persistent AI disruption fears and ongoing geopolitical tensions. Domestically, large caps materially outperformed small/mid caps, resulting in the All Ordinaries Accumulation Index rising +3.3% compared to a -2.6% decline in the ASX Small Ordinaries Accumulation Index. The ASX50 had an extremely strong month, increasing by +7.9%, whilst at the smaller end, the Small Ords Industrials declined -4.5%. Capital light businesses, such as software and technology companies fell sharply due to investor fears around disruption from AI, whilst resources and mining services outperformed. In comparing the fund's performance versus the benchmark in February, it should be noted the fund has a strong small/mid cap focus. Over the long term, there is clear evidence that these companies deliver superior returns to large caps, however during periods of investor risk aversion (such as the current environment where the RBA is raising interest rates to combat inflation), investor funds typically move out of small caps to the perceived safety of large cap companies. In the US, the tech heavy NASDAQ was weighed down by similar factors, resulting in a -3.4% decline in the month, underperforming the S&P 500 which fell -0.9%. Outside of the US, the Euro Stoxx 50 and FTSE 100 maintained their recent momentum, rising +3.2% and +6.7%, respectively. As we have discussed, the expectation of further RBA rate hikes has continued to drive a rotation back into large caps. Bluechip names rebounded in February, including CBA (+17%), NAB (+13%), BHP (+16%) and Woolworths (+16%). Whilst the market continues to expect 1-2 more RBA rate hikes over the next 12 months, past cycles have shown that the underperformance of small/mid caps tends to bottom well before the end of a rate hiking cycle. In bond markets, the US 10-year bond yield recorded a sharp decline, falling -30 basis points (bp) to 3.94%, whilst its Australian counterpart fell -16bp to 4.65%. The Australian dollar continued to rise, increasing +2.2% to US$0.71, implying an increase of 1.5 cents. Funds operated by this manager: |

20 Mar 2026 - Investment considerations of prolonged uncertainty over Iran
|
Investment considerations of prolonged uncertainty over Iran Janus Henderson Investors March 2026 (8-minute read) The conflict in the Middle East has escalated over the last few days and hopes for a short war have faded. Regional diplomatic efforts to de-escalate appear to be failing and Iran continues to retaliate in response to strikes from the US and Israel. As a result, the Strait of Hormuz - the world's most important gateway for energy commodities - remains effectively closed to all but the most buccaneering of shipping companies. The Strait closure is a result of a lack of insurance, firms not willing to risk the loss of future capacity if ships are sunk, and concerns for the welfare of sailors after several fatalities already. However, there are now risks of more intensive intervention from the US and/or Israel following reports that they are considering putting boots on the ground, either to try and extract Iranian enriched nuclear material or to take Kharg Island, a key sea terminal for Iranian oil exports. At the same time, a new Supreme Leader of Iran has been chosen who is seen as another hardliner. This is unlikely to be taken well by the US, who would have preferred someone more moderate, and the choice appears unlikely to create a path to de-escalation. The desired end point is still uncertainIt is still not immediately clear what the ultimate objectives for the US and Israel are. Various intentions have been publicly stated but it is not clear which of these are red lines and which are just preferences. A further reduction of the potential for Iran to build nuclear weapons appears to be the closest to a requisite. However, given that strikes in 2025 were deemed to have achieved this, defining the outcome is difficult. Similarly, a desire to destroy Iran's long-range missile program has been expressed, but this may similarly be difficult to guarantee. Finally, regime change, either for military or humanitarian reasons, is now touted as a key objective, but it remains unclear how this can be achieved with airstrikes alone. The objective mattersUnderstanding the motivating objectives is important when considering how long the war might last and the subsequent economic impact. We can look to several factors that suggest this could be a more prolonged campaign. Iran has indicated that it can continue with its current rate of response for six months, far longer than the weeks-long engagement that markets appeared to have been pricing. The US has expressed that it wishes to remove the previously enriched uranium that could be used in nuclear weapons, but it has been a long time since the last international inspection and its whereabouts are likely to be very uncertain. Similarly, the continuity of a new hardline leader suggests that Iran is feeling little pressure to change tack yet. However, there are also ways in which the conflict could be wound up sooner. The most obvious is that US President Trump has shown a willingness to abruptly change direction on policy multiple times throughout his leadership, no matter the scale of the impact. With mid-term elections coming up later in the year, the US government is likely to be highly sensitive to anything that pushes up the cost of living. Therefore, finding a way to declare victory and return oil prices to lower levels may ultimately dominate any longer-term military objectives. The length mattersA longer-term conflict raises the danger of greater destabilisation in the region, creates greater potential for more severe damage to key infrastructure and risks longer-lasting impact on energy supplies. While there are some ways to mitigate the impact in the near term, such as sending oil through pipelines to ports less likely to be targeted, or by releasing strategic reserves outside of the Middle East, these are either inherently temporary or lack the potential capacity to offset prolonged restrictions in the Strait of Hormuz. Oil is often seen as the key commodity when considering conflicts in the Middle East, given its relevance to US gasoline prices in particular, but natural gas supplies are crucial for other regions, such as Europe, and other base products feed into areas from chemicals to fertilisers. Last week, markets appeared to be pricing energy commodities in line with a short-term interruption to the ease of supply. Assumptions around this appear to have changed over the weekend, with prices now moving to incorporate greater risk of a prolonged engagement. The lack of clarity around the US/Israeli objectives does nothing to reduce the uncertainty that markets hate. Impact on marketsThe price of oil has spiked above US$100 per barrel as concerns about supplies have intensified. European natural gas prices have almost doubled since the end of February. This is raising the spectre of the inflationary impulse generated by the Russian invasion of Ukraine in early 2022 and the subsequent removal of much of the Russian supply into energy markets. Concerns about a jump in European inflation or simply prolonged stickiness in the US are lifting bond yields. US Treasury yields have moved higher as markets have taken out one of the US Federal Reserve interest rate cuts that were anticipated by the end of the year. Yields on 10-year Treasuries have seen less movement than their European counterparts, as US jobs numbers on Friday served to offset some upward yield pressure from expected inflation. Concerns about inflation have seen surges in German and UK breakeven rates, with market pricing for the European Central Bank interest rates at the end of 2026 now looking at over 1.5 hikes. Since the end of February, expectations for the Bank of England have shifted from two cuts by the end of 2026 to a better than 50:50 chance that there will be an interest rate hike - a marked shift in the outlook. Markets are now pricing in higher oil prices for the foreseeable future, with concerns mounting about a stagflationary outcome, should higher energy costs stall a re-acceleration in economic growth. The uncertainty has provided support for the much-maligned US dollar, given the American economy is looking better set to weather an energy shock than elsewhere. However, higher bond yields and a stronger greenback have dampened gold's ability to rally in the current environment, following strong performance during other recent periods of volatility. Equity markets are seeing something of a reversal of recent performance dynamics. Markets that started the year positively, to the end of February, suddenly look under greater pressure. A stronger dollar and higher oil prices are weighing on Asian stocks that had been surging in the first two months of the year. Gas prices remain Europe's geopolitical Achilles heel and markets are clearly concerned that the region is overly exposed again. In the US, last week saw some signs of a reversal of the recent outperformance of Value stocks over their Growth counterparts. AI-related stocks have struggled in 2026 so far compared to the rest of the market, but the fears that higher oil prices could dent the very rosy economic outlook are leading to something of a reconsideration. The effective closure of the Strait of Hormuz is unprecedented, undoubtedly making for severe impacts on risk assets. However, to put the sell-off in proper context, investors must also recognise that equities entered the conflict trading at a meaningful premium over historical valuation levels. The forward price/earnings ratios (P/Es) of major global equity markets were at top quartile levels versus their 20-year histories[1], roughly a 15%-30% premium compared to median levels. Indeed, the markets experiencing the largest sell-offs are the ones that entered the conflict with the highest returns year to date[2]. Risks of a prolonged war but don't rule out a quick "victory"Situations like this demonstrate the value of well-diversified multi-asset portfolios. Geopolitical events are rarely easy to gain complete clarity on, with the current US administration apparently embracing uncertainty as a negotiation strategy. What we can take away from the events of the last few days is that it is likely the conflict could last longer than many had initially hoped. This means there is the potential for greater economic impact - and markets have moved to price in this change. There is the potential for faster inflation and slower economic growth, with assets focusing on different aspects thus far. However, risks remain two-sided. US political pressures means that a quick "victory" should not be ruled out. Asset prices, driven by energy prices, are likely to swing violently as investors alter their expectations for either outcome. [1] Source: Datastream, 27 February 2026. Past performance does not predict future returns. [2] Source: Bloomberg, 31 December 2025 to 9 March 2026. Past performance does not predict future returns. |
|
Funds operated by this manager: Janus Henderson Australian Fixed Interest Fund , Janus Henderson Conservative Fixed Interest Fund , Janus Henderson Diversified Credit Fund , Janus Henderson Global Natural Resources Fund , Janus Henderson Tactical Income Fund , Janus Henderson Australian Fixed Interest Fund - Institutional , Janus Henderson Conservative Fixed Interest Fund - Institutional , Janus Henderson Cash Fund - Institutional , Janus Henderson Global Multi-Strategy Fund , Janus Henderson Global Sustainable Equity Fund , Janus Henderson Sustainable Credit Fund All opinions and estimates in this information are subject to change without notice and are the views of the author at the time of publication. Janus Henderson is not under any obligation to update this information to the extent that it is or becomes out of date or incorrect. The information herein shall not in any way constitute advice or an invitation to invest. It is solely for information purposes and subject to change without notice. This information does not purport to be a comprehensive statement or description of any markets or securities referred to within. Any references to individual securities do not constitute a securities recommendation. Past performance is not indicative of future performance. The value of an investment and the income from it can fall as well as rise and you may not get back the amount originally invested. Whilst Janus Henderson believe that the information is correct at the date of publication, no warranty or representation is given to this effect and no responsibility can be accepted by Janus Henderson to any end users for any action taken on the basis of this information. |

19 Mar 2026 - Correlation and How to Think About Diversifying Alternatives
|
Correlation and How to Think About Diversifying Alternatives Fidante February 2026 (7-minute read) Achieving diversification and uncorrelated returns are a common objective when constructing investment portfolios. Understanding what those terms really mean is essential to properly appreciate how alternative investments can contribute to robust long-term portfolios.
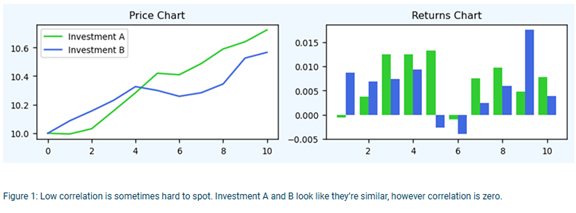
What is correlation?Correlation is a statistical measure of the relationship between the returns of two investments (rather than price levels). It ranges from -1 to +1. Investments with high correlation tend to move in the same direction at the same time, while investments with little or no correlation tend to move independently of each other. Negatively correlated investments tend to move in opposite directions. Importantly, two investments that both deliver positive long-term returns can nevertheless exhibit zero or even negative correlation. Conversely, investments that appear to move in opposite directions over time can be positively correlated. For example, daily price movements may show a very different relationship from the point to point one-year return. In figure 1, at first glance it may appear that the two investments shown in the left-hand chart below are positively correlated. After all, for the period shown, both have increased by about the same amount. Looking at the daily returns in the chart on the right, we can see that most days the two investments do indeed move up together, however, on some days they move in opposite directions. Counterintuitively, the correlation of these two strategies turns out to be zero. An important implication is that investors can derive diversification benefits from two investments that both go up over time.
It's also important to note that statistically high correlation does not imply causation. Just because two return series are highly correlated does not mean one necessarily causes the other to move. As a result, correlation can and does change over time.
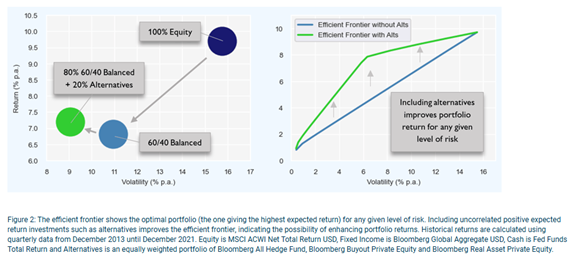
Why does correlation matter?By combining uncorrelated investments, we can construct portfolios with lower risk and/or higher returns. This is the power of diversification. The lower the correlation between assets, the greater the potential benefit. This is where alternatives come in - no other asset class offers the same variety and breadth of uncorrelated investments as the universe of alternative investments.
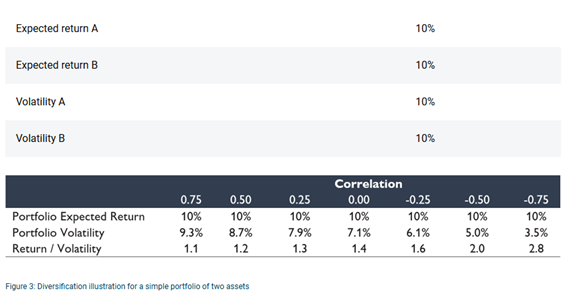
A simple illustrationTo see why uncorrelated assets produce better portfolios, consider two investments, A and B. Both are expected to return 10% per year and each has volatility of 10%.
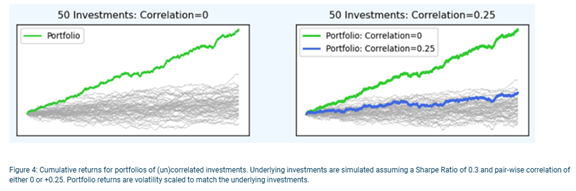
Figure 3 shows that when these investments are highly correlated, combining them does little to reduce portfolio risk. However, when correlation is low or even negative, portfolio volatility drops to levels far below that of either A or B individually, even though expected returns remain the same. This leads to higher risk adjusted returns - the portfolio earns the same return with less volatility. The effect becomes even more powerful in larger diversified portfolios. Consider an equally weighted portfolio of 50 completely uncorrelated investments, all with the same ex-ante expected return and ex-ante volatility and a modestly positive Sharpe Ratio2 of 0.3. The portfolio returns are shown by the green line on the left-hand chart, and the Sharpe Ratio is now 1.94, a significant improvement on any individual investment. However, even a small increases in correlation can significantly dilute these benefits. If these 50 investments now have a pair-wise correlation of 0.25 (still a relatively low correlation), the cumulative portfolio return becomes dramatically lower than when correlation was zero, as shown by the blue line in the right-hand chart. \While the above is a contrived example from a simulation, it illustrates just how powerful the combination of uncorrelated investments can be. This is where alternatives have the potential to play such an important role in investment portfolios.
In practice, it is extremely difficult to find large numbers of investments that are truly uncorrelated at all times. However, each additional uncorrelated investment introduced into a portfolio increases the potential diversification benefits for the portfolio. Alternative investments are often uncorrelated not only to traditional assets like equities and bonds, but also to each other, making a rich hunting ground for investors seeking to maximise the power of diversification. There is, however, an important caveat. Just as low or negative correlation enhances diversification, even small changes in correlation can undermine it, sometimes quickly and unexpectedly. What factors affect correlation?Correlation can increase during periods of market stress, economic shocks or major shifts in monetary policy. Events such as the COVID market sell off in early 2020 saw correlations spike as many assets moved sharply lower at the same time. Even if only temporary, this can have a devastating impact on portfolios if previously uncorrelated investments all move in the same direction at the same time. The experience of 2022 provided another stark example. Rising interest rates negatively affected both equities and bonds, causing the traditional 60/40 portfolio to suffer unusually large losses. Assets that investors expected to diversify one another instead moved together. Understanding the common drivers of returns is therefore critical when thinking about how correlation might change. When many investments rely on similar economic factors, such as low interest rates, correlation can rise sharply when those conditions change, as we saw in 2022. Some investors attempt to anticipate these shifts and rebalance portfolios accordingly. However, this can be difficult, so alternative investments that are less susceptible to correlation changes can be useful as 'anchor' diversifiers in a portfolio. The challenges of measuring correlation While uncorrelated investments can improve portfolio diversification and resilience, measuring correlation is not straightforward. There is no single measure to determine "true" correlation. Investors need to consider:
Useful techniques include examining rolling correlations, analysing how investments behave during market downturns and monitoring whether regime changes have altered the relationship between two investments. It's also worth remembering that correlation is only one part of the investment decision. Some investments may be attractive because of their risk/return profiles, even if diversification benefits are modest. Understanding the role of alternatives in diversification While investors often think about alternative investments as a single category, they can play very different roles within a portfolio. Broadly, alternatives can be grouped into three types based on their primary objective: growth alternatives, which aim to enhance overall portfolio returns; diversifying alternatives, which seek to improve risk adjusted returns by delivering low or uncorrelated performance; and defensive alternatives, which are designed to provide an explicit buffer during periods of market stress. Understanding these distinctions is critical, as the value an alternative investment brings depends not just on its standalone return, but on how it interacts with the rest of the portfolio. Correlation and diversification are particularly central to the second category of diversifying alternatives. Investments with low correlation can materially improve portfolio outcomes by reducing volatility without sacrificing expected returns. Diversifying alternatives can therefore allow investors to achieve better risk adjusted returns rather than simply higher absolute returns, improving the efficiency and resilience of the portfolio as a whole. In this sense, alternatives that consistently deliver diversification benefits can be among the most valuable long term building blocks in a well constructed investment portfolio. Final thoughts Correlation measures how investment returns move relative to one another, but it is not fixed and cannot be relied upon to remain stable. Because correlation is based on historical data, there is no guarantee that it won't change in the future. That said, portfolios constructed with investments with low correlation can deliver higher returns for a given level of risk than those with more highly correlated investments. Correlation can therefore be an essential part of assessing any potential investment and is of particular importance when considering alternative investments. A solid understanding of correlation, its applications and limitations allows investors to unlock the power of diversification. While correlations can change, alternative investments that deliver consistently low correlation to traditional assets can be particularly valuable in building more robust, resilient portfolios. 1Markowitz, H.M. (March 1952). "Portfolio Selection". The Journal of Finance. |

17 Mar 2026 - 10k Words | March 2026
|
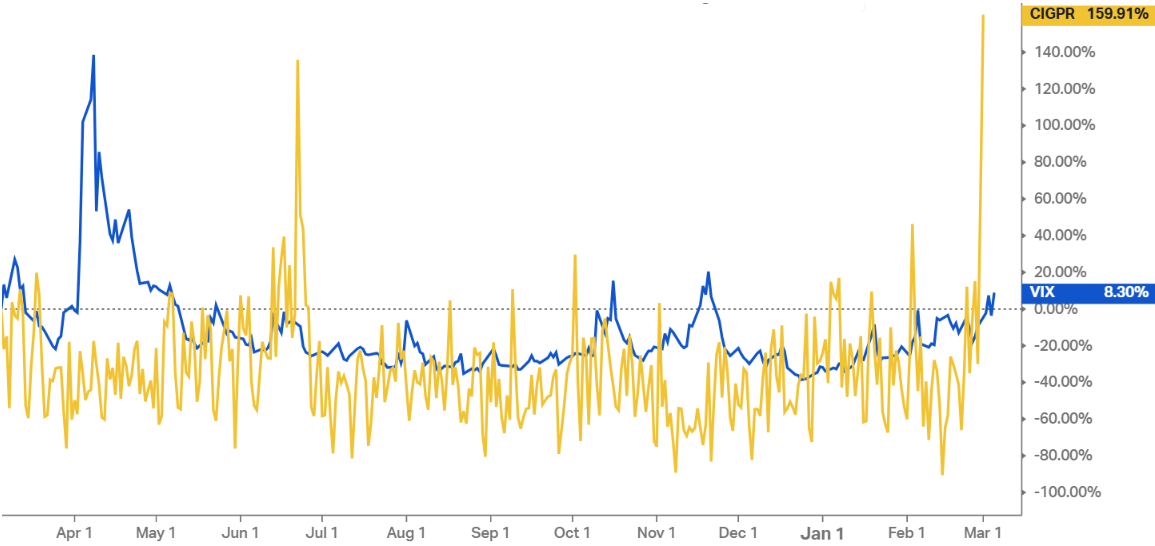
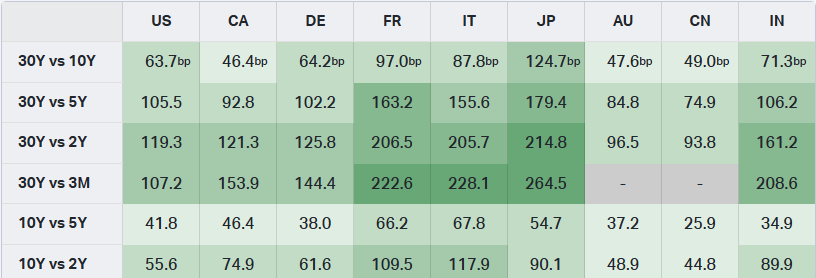
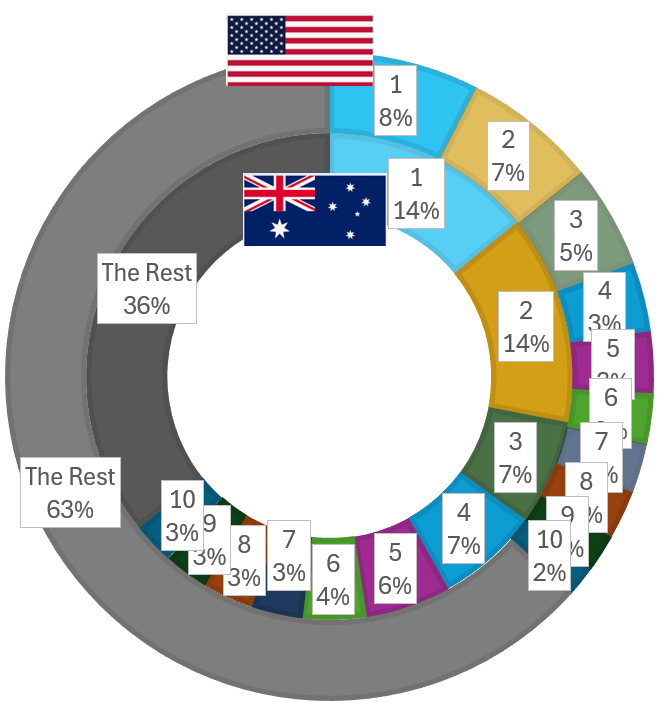
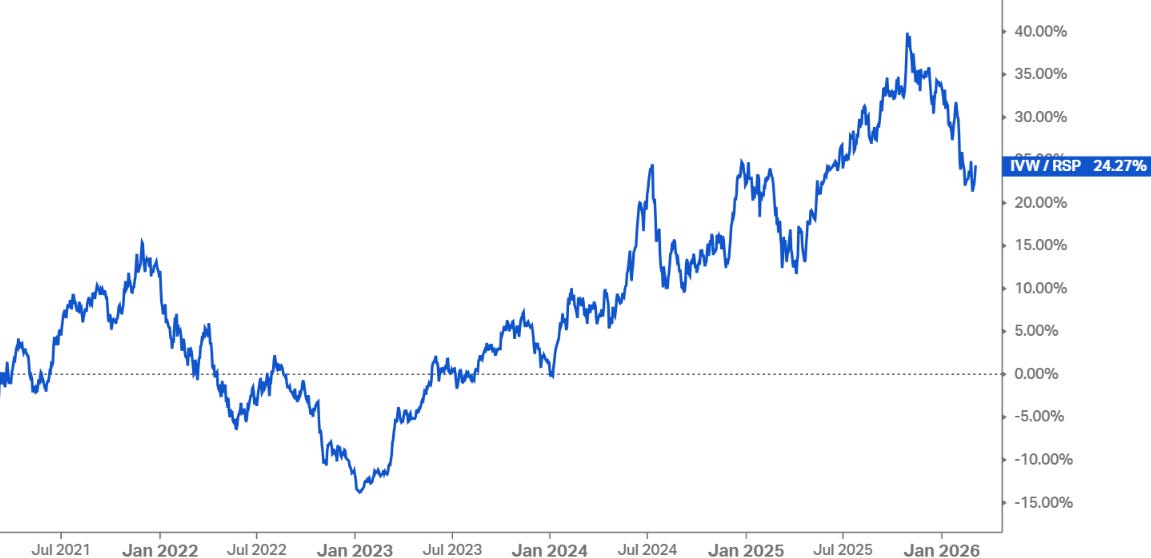
10k Words Equitable Investors March 2026 (2-minute read) Geopolitical risk spikes. After a long period of significant divergence, long term bond yields and forecast earnings yields have reunited. Worth considering alongside the relative performance of "Growth" v "Value". Long-term inflation expectations seem to have stabilised at higher levels than was the case pre-COVID - possibly baking in higher volatility in inflation. Military action swung equity investors straying to emerging markets back to the US. That US market may be concentrated but its a lot less concentrated than the ASX - and in the current period of turbulence concentration has performed very differently relative to equal-weight portfolios in the two countries. There does seem to be more interest in active investing currently. Finally, we can't escape without a chart on the decline of listed SaaS valuations - but in the context of a convergence with unlisted AI valuations. Geopolitical Risk Index relative performance to VIX (US volatility) over 1 year
Source: Caldara and Iacoviello, Koyfin US 10-year bond yield v S&P 500 forward earnings yield
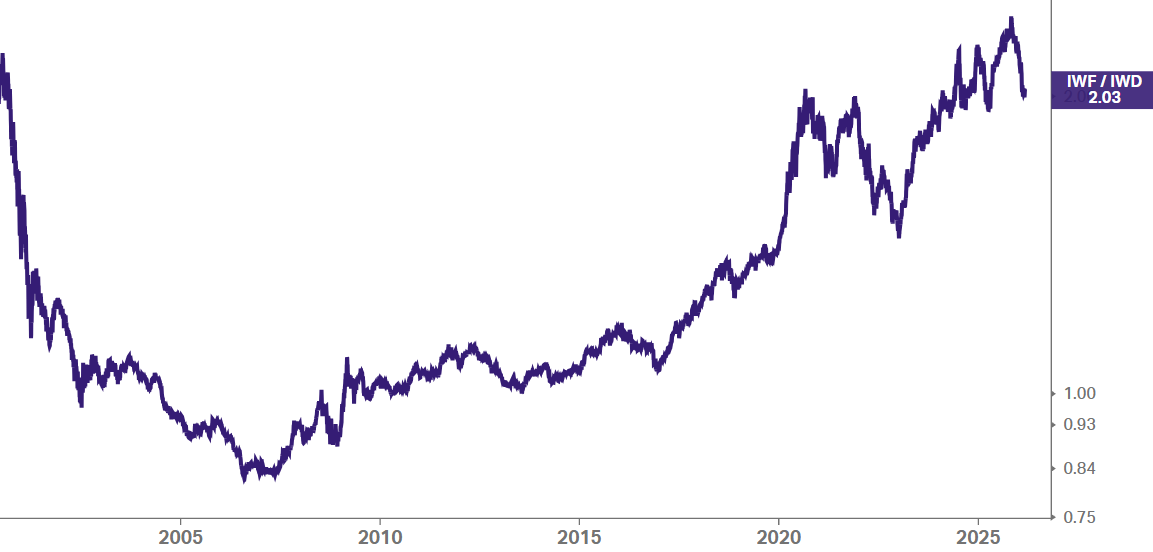
Source: Yardeni Growth relative to Value (iShares Russell 1000 Growth / iShares Russell 1000 Value)
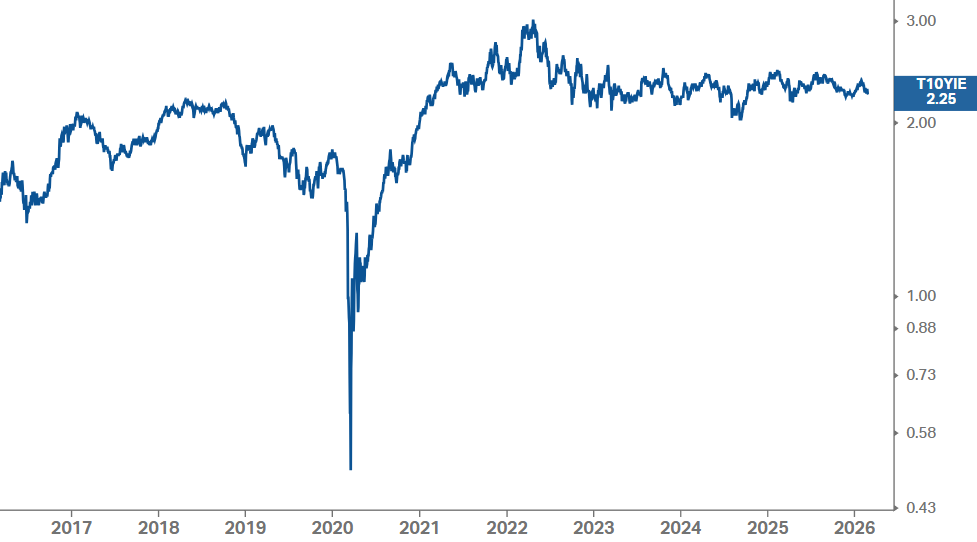
Source: Koyfin US 10-Year Breakeven Inflation Rate - relatively stable for past three years
Source: Koyfin Australian 10-year Breakeven Inflation Rate
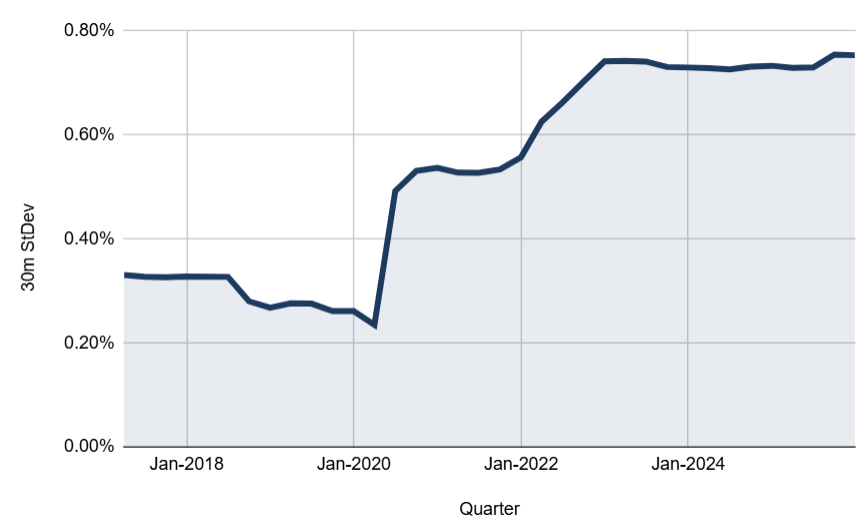
Source: Equitable Investors, RBA CPI (Australia) - standard deviation of quarter-on-quarter change (rolling 30 quarters)
Source: Equitable Investors, ABS Global yield spreads matrix
Source: Koyfin S&P 500 relative to FTSE Emerging Index - reversal post Iran attack
Source: Bloomberg Equities concentration - top 10 holdings' dominance of Aus and US major benchmarks (using iShares ETF proxies)
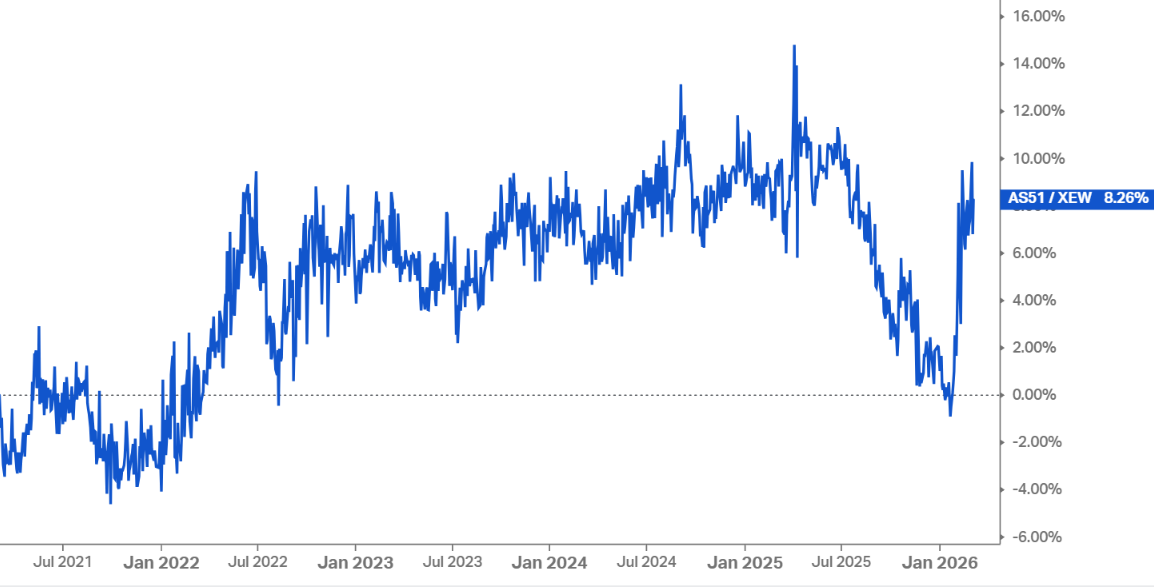
Source: Equitable Investors, Koyfin S&P/ASX 200 - Free-float weighted (AS51) v equal-weighted indices (XEW)
Source: Equitable Investors, Iress, Koyfin S&P 500 ETFs - Free-float weighted (IVW) v equal-weighted (RSP)
Source: Equitable Investors, Koyfin The number of active ETFs launched each year in the US
Source: Morningstar Public SaaS valuations have converged with AI-led software
Source: Arcadia Capital via Archtis Funds operated by this manager: Equitable Investors Dragonfly Fund Disclaimer Past performance is not a reliable indicator of future performance. Fund returns are quoted net of all fees, expenses and accrued performance fees. Delivery of this report to a recipient should not be relied on as a representation that there has been no change since the preparation date in the affairs or financial condition of the Fund or the Trustee; or that the information contained in this report remains accurate or complete at any time after the preparation date. Equitable Investors Pty Ltd (EI) does not guarantee or make any representation or warranty as to the accuracy or completeness of the information in this report. To the extent permitted by law, EI disclaims all liability that may otherwise arise due to any information in this report being inaccurate or information being omitted. This report does not take into account the particular investment objectives, financial situation and needs of potential investors. Before making a decision to invest in the Fund the recipient should obtain professional advice. This report does not purport to contain all the information that the recipient may require to evaluate a possible investment in the Fund. The recipient should conduct their own independent analysis of the Fund and refer to the current Information Memorandum, which is available from EI. |


13 Mar 2026 - Beyond 'Quality at any price'

12 Mar 2026 - When Geopolitics Moves Markets, Most Portfolios Aren't Ready
|
When Geopolitics Moves Markets, Most Portfolios Aren't Ready East Coast Capital Management March 2026 3-minute read There is a particular kind of market risk that doesn't show up cleanly in a spreadsheet. It doesn't follow earnings seasons or central bank calendars. It arrives through a headline, a border dispute, a sanctions announcement - and by the time most investors have processed it, the repricing has already begun. Geopolitical risk is not new. But the current environment has a different character to it. What we are seeing is not a series of isolated shocks, but an accumulation of structural pressures: fractured supply chains, sustained conflict, and policy unpredictability operating simultaneously across multiple geographies. That combination has a way of staying in markets longer, and running deeper, than a single event. The question for investors is not whether this will eventually resolve. It's whether their portfolios are positioned to navigate the period before it does. What Markets Are Actually Signalling In periods of genuine geopolitical stress, the signal tends to show up in commodities and currencies before it surfaces in equities. Energy markets become a key transmission mechanism: oil price volatility doesn't just reflect supply anxiety, it flows directly into inflation expectations, corporate cost structures, and consumer sentiment. We have seen exactly this dynamic play out. Supply disruptions have kept energy markets volatile and directional. Currency markets have repriced on shifting capital flows and policy divergence. These are not peripheral markets - they sit at the centre of how geopolitical stress propagates through the real economy. Systematic trend following is well-suited to precisely this environment. Not because it predicts geopolitical outcomes (it doesn't) but because it is built to detect and follow the price trends that geopolitical stress tends to produce. When energy trends, it captures energy. When currencies move on safe-haven flows, it captures that too. The strategy doesn't need to know why a trend is happening. It needs to know that it is. The Diversification Assumption Worth Re-examining Most portfolios carry an implicit assumption: that diversification across asset classes will provide protection when conditions deteriorate. In stable regimes, this assumption generally holds. In stress regimes, it often doesn't. When a single macro force - geopolitical risk, an energy shock, a sudden policy reversal - moves through markets simultaneously, assets that appeared uncorrelated begin moving together. The diversification that looked sound on paper compresses exactly when it needs to expand. This is not a flaw to be corrected with more asset classes. It is a feature of how modern markets behave under stress, and it requires a different solution: exposure to return streams that are structurally independent of traditional beta, rather than just spread more widely across it. "True diversification isn't about just holding more assets," says Simone Haslinger, CEO of East Coast Capital Management. "It's about holding assets that behave differently when conditions become difficult. That's a higher bar -- and it's the bar that matters." A Framework Built for Uncertainty, Not Despite It At ECCM, we are often asked how trend following performs in "normal" markets. The reality is that trend following is designed for the full range of market conditions, but it tends to earn its keep most visibly in environments like the current one. Geopolitical stress produces the extended, directional moves across commodities, currencies, and rates that trend following is built to capture. Elevated volatility, far from being a headwind, is the raw material the strategy works with. And because our approach is rules-based, it doesn't require us to take a view on how a conflict resolves, which policy will be enacted, or how long uncertainty will persist. The price action tells us what we need to know. This matters in practice. When uncertainty is high, discretionary decision-making is most prone to error: anchoring to prior regimes, hesitating at inflection points, or seeking safety in familiar assets regardless of what the trends are telling them. A systematic process removes that vulnerability. Conclusion Geopolitical uncertainty is not a phase to be endured while waiting for markets to normalise. For investors with the right framework in place, it is a productive environment - one that generates the kind of clear, sustained trends that systematic strategies are built to capture. At ECCM, our ECCM Systematic Trend Fund is designed to do exactly that: to respond to what markets are doing, wherever the opportunity arises, and to deliver return streams that remain genuinely uncorrelated to traditional portfolios through periods of stress and stability alike. Wholesale clients can find more information on ECCM and the ECCM Systematic Trend Fund at Australian Fund Monitors and ECCM's website. Funds operated by this manager: |

11 Mar 2026 - Beyond scale: rethinking the engine room of European infrastructure
|
Beyond scale: rethinking the engine room of European infrastructure abrdn February 2026 (4-minute read) The prevailing narrative in infrastructure favours scale. Large funds, large assets, and large ambitions dominate the conversation. Yet, as Europe's energy transition continues and policy reforms reshape the investment landscape, it's increasingly clear that meaningful progress is being driven by the small- and mid-cap segments. Transactions below €500 million account for the majority of European infrastructure deals. This is the centre of gravity for new investment and innovation. Our experience over more than a decade - with around €3 billion invested across energy, transport and digital infrastructure - consistently points to the same conclusion. The lower mid-market is where policy ambition, operational delivery and investor returns align most effectively. There's less need for intermediaries, and it's materially less competitive. This gives space for genuine value creation, rather than simply financial engineering. Policy tailwinds and competitive advantageRecent reforms in the EU's market design for electricity, quicker permit approvals, and the Net-Zero Industry Act have shifted the balance in favour of assets that can adapt quickly and align with local policy priorities. Small- and mid-cap platforms have a structural advantage. In practice, this means utilities that work constructively with municipalities, transport assets embedded within national and regional strategies, and energy platforms that can adapt business models as subsidy regimes and security-of-supply priorities evolve. Large, centralised assets often struggle to respond at this pace. Risk, value and evidenceThe notion that smaller assets are riskier doesn't stand up to scrutiny. In regulated sectors, risk is defined far more by framework stability and governance quality than by asset size. Our utility investments in Finland, for example, operate under the same regulatory regimes as larger peers, yet benefit from more conservative capital structures and greater scope for hands-on asset management. Agility, local solutions and systemic changeSmall- and mid-cap assets move at a different pace. Development timelines are shorter, adaptation is faster, and innovation is less encumbered by bureaucracy. In Finland, this has enabled the rapid deployment of electric boilers to exploit periods of low-cost renewable power, the co-location of data centres to capture waste heat, and the diversification of fuel sources within district heating networks to improve resilience. These initiatives were delivered through close engagement with management teams and local authorities, and implemented within months rather than years. Final thoughts...The infrastructure required to support Europe's changing economy won't be delivered solely by megaprojects or flagship assets. It will be built incrementally, through thousands of local decisions across infrastructure systems. It will also be shaped by those who can combine agility, results, and local insight to deliver measurable outcomes - especially as policy and competitiveness trends continue to evolve. |
|
Funds operated by this manager: abrdn Sustainable Asian Opportunities Fund , abrdn Emerging Markets Equity Fund , abrdn Sustainable International Equities Fund , abrdn Global Corporate Bond Fund (Class A)
|

10 Mar 2026 - Ben McVicar discusses the data centre effect
|
Ben McVicar discusses the data centre effect Magellan Investment Partners February 2026 (6-minute read) |
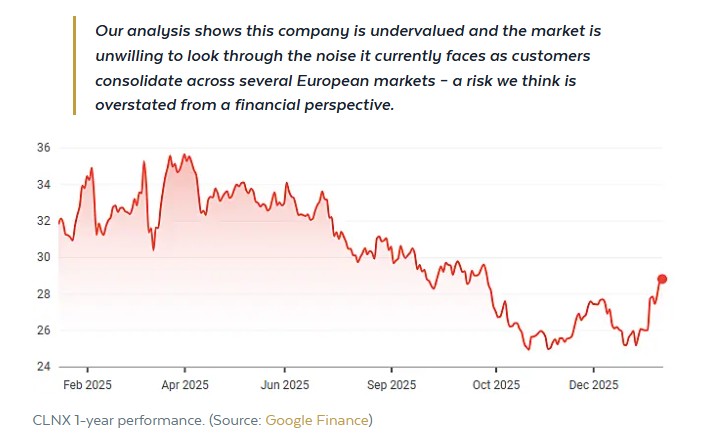
Power demand is rising again. And this time, it is not a short-term cycle.Ben McVicar, Co-Head of Infrastructure and Portfolio Manager at Magellan, sees a decisive shift underway. "There's an upswing in power demand that is data centre related." After more than a decade where electricity demand barely moved, data centres are changing the equation. Systems that once operated in a world of flat consumption are now under pressure to expand capacity and fund the next wave of build-out. That shift matters. In this Q&A, McVicar explains where he believes the market is misreading the landscape, how supply constraints are shaping investment decisions, and why patience remains a competitive advantage. What's your most recent investment and why?We operate a low-turnover portfolio, but one of the more substantial positions we have entered of late is Cellnex (BME: CLNX). The business is the largest mobile tower company in Europe.
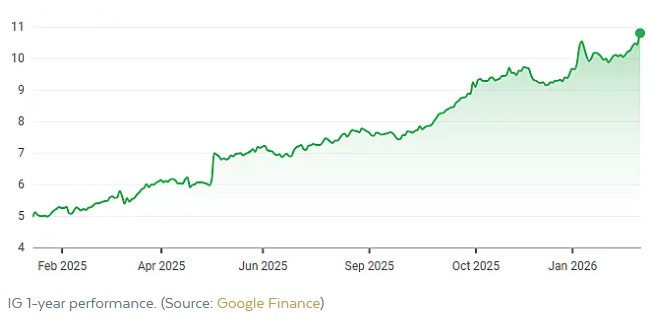
Which investment did you add to your watchlist this week?We have a universe of about 130-140 companies. It's a tightly defined list, so not a lot falls in and out often. These are all high-grade infrastructure companies that have met the quality thresholds we require. So the watch list doesn't change too much. But things move up and down on our radar. The companies highest on our radar are the mobile phone tower companies like Cellnex, but also its peers across the Atlantic. What is the most recent investment you have trimmed or sold and what drove this decision?We have trimmed our position in Italgas (BIT: IG) after a very strong run. This is a gas utility in Italy that is run by a very strong management team. They acquired the second-largest gas network in Italy and expect to create significant synergies from the combined company. But as the price has gone up, the opportunity has narrowed.
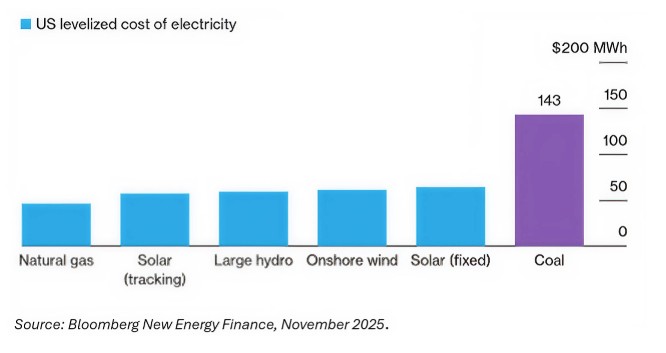
What's your favourite chart or data point from this week?
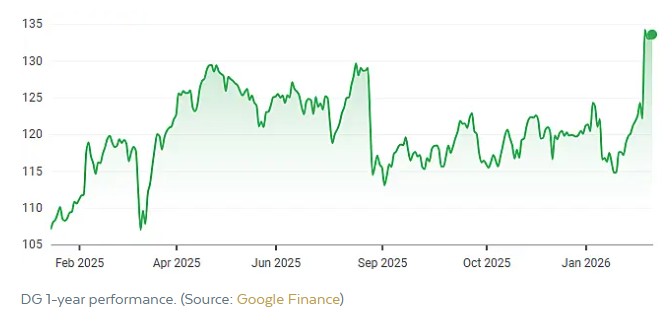
This shows the levelised cost of energy estimates. There's an upswing in power demand that is data centre related. This is a change from the 2005-2020 experience, where power demand growth was limited. This is leading to pressure to develop new power capacity. Gas generation is viable but constrained by supply chain bottlenecks. This makes renewables the most cost-effective and available source of new power. Combined with national and corporate carbon targets, this explains the ongoing investment we're seeing in the technologies. What was your weekly high - a standout market moment or highlightVinci (EPA: DG), a French infrastructure and contracting business, went up almost double-digit on its results. This is a long-standing position, and we've added to it during dips caused by French political turmoil. It's good to see the market focused on the robust fundamentals of this business.
What was your weekly low - a market disappointment or challenge?Customer power prices have gone up as demand has gone up in many regions. In the US utilities, we're diving into the risks and opportunities that come from the outlook of customer rate affordability and the impacts of an election year in many states. What first drew you to markets and what continues to keep you inspired today?I knew I wanted to be an investor before I even started uni. The craft of investing, finding opportunity and building a portfolio to take advantage of these opportunities while managing risk is an endlessly interesting job to be in. What's one piece of advice you'd give to new investors?Be patient, don't overestimate your abilities and wait for the opportunity that jumps off the page at you. You'll know it when you see it. How do you unwind when you're not thinking about the market?Why would you do that? But seriously, exercise. I find I need active 'rest' to stop me thinking about different opportunities or problems I'm focused on in markets. Rapid fire!Favourite investing book? Snowball by Alice Schroeder. Favourite investing or finance/markets-related podcast? I enjoy listening to learn new ideas - the Knowledge Project Podcast (Shane Parish). The first thing you read each morning? I check how the portfolio is trading and then get onto the international press (FT, etc.). Favourite restaurant? Continental Deli - Newtown. Something people are surprised to learn about you? I first started dating my (now) wife when I was 16 and she was 15. I get the impression it's unusual for my generation! |
|
Funds operated by this manager: Vinva Global Alpha Fund - Active ETF (ASX: V1AC) , Vinva Australian Equity Fund , Vinva Global Equity Fund , Vinva Australian Alpha Extension Fund , Vinva Global Alpha Extension Fund , Magellan Infrastructure Fund , Magellan Global Opportunities Fund No.2 , Magellan Infrastructure Fund (Unhedged) , Magellan Core Infrastructure Fund , Magellan Global Opportunities Fund Active ETF (ASX:OPPT) Important Information: This material has been delivered to you by Magellan Asset Management Limited ABN 31 120 593 946 AFS Licence No. 304 301 trading as Magellan Investment Partners ('Magellan Investment Partners') and has been prepared for general information purposes only and must not be construed as investment advice or as an investment recommendation. This material does not take into account your investment objectives, financial situation or particular needs. This material does not constitute an offer or inducement to engage in an investment activity nor does it form part of any offer documentation, offer or invitation to purchase, sell or subscribe for interests in any type of investment product or service. You should obtain and consider the relevant Product Disclosure Statement ('PDS') and Target Market Determination ('TMD') and consider obtaining professional investment advice tailored to your specific circumstances before making a decision about whether to acquire, or continue to hold, the relevant financial product. A copy of the relevant PDS and TMD relating to a Magellan Investment Partners financial product may be obtained by calling +61 2 9235 4888 or by visiting www.magellaninvestmentpartners.com Past performance is not necessarily indicative of future results and no person guarantees the future performance of any financial product or service, the amount or timing of any return from it, that asset allocations will be met, that it will be able to implement its investment strategy or that its investment objectives will be achieved. This material may contain 'forward-looking statements'. Actual events or results or the actual performance of a Magellan Investment Partners financial product or service may differ materially from those reflected or contemplated in such forward-looking statements. This material may include data, research and other information from third party sources. No guarantee is made that such information is accurate, complete or timely and no warranty is given regarding results obtained from its use. This information is subject to change at any time and no person has any responsibility to update any of the information provided in this material. Statements contained in this material that are not historical facts are based on current expectations, estimates, projections, opinions and beliefs of Magellan Investment Partners or the third party responsible for making those statements (as relevant). Such statements involve known and unknown risks, uncertainties and other factors, and undue reliance should not be placed thereon. No representation or warranty is made with respect to the accuracy or completeness of any of the information contained in this material. Magellan Investment Partners will not be responsible or liable for any losses arising from your use or reliance upon any part of the information contained in this material. Any third-party trademarks contained herein are the property of their respective owners and Magellan Investment Partners claims no ownership in, nor any affiliation with, such trademarks. Any third-party trademarks contained herein are the property of their respective owners, are used for information purposes and only to identify the company names or brands of their respective owners, and no affiliation, sponsorship or endorsement should be inferred from such use. This material and the information contained within it may not be reproduced, or disclosed, in whole or in part, without the prior written consent of Magellan Investment Partners. (080825-#W17) |

5 Mar 2026 - From Record Issuance to Renewed Opportunity: European & Australian ABS in Focus
|
From Record Issuance to Renewed Opportunity: European & Australian ABS in Focus Challenger Investment Management February 2026 (9-minute read) 2025 Wrap-up and 2026 Outlook2025 closed as another strong year for the European and Australian ABS markets despite intermittent macro uncertainty. Investors continued to demonstrate robust demand, supporting spread compression amid record issuance volumes. For 2026, we expect elevated funding needs and stable performance across core collateral types, alongside ongoing innovation in new and esoteric asset classes. Regulatory changes in Europe may further encourage issuance and broaden the investor base. Overall, floating rate securitised assets remain a compelling component of diversified fixed income portfolios, continuing to offer an attractive spread pick up to similarly rated corporates, floating rate protection, and structural resilience. Issuance and Market TechnicalsAs we mentioned in our European and Australian ABS 2025 Q3 update, a strong start to 2025 was halted when broader markets faced uncertainty in early April given President Trump's tariff announcements. The ABS markets recovered relatively quickly and despite continued macro and tariff related uncertainty, demand across the capital structure continued to be strong, leading to spread compression across global ABS markets. Sustained investor demand and relatively attractive funding levels continued to keep the asset class attractive for issuers for both funding as well as for credit risk transfer. So...another record-breaking year for issuance? Indeed, although slightly less dramatic than in 2024. European ABS issuance closed the year just over €95bn and Australia continued momentum with another year of strong issuance for the market at just under €41bn, the second highest year of issuance, and a little short of the record set in 2024 of €46.5, according to JPM research figures. The supply we have seen in Europe and Australia over the last couple of years has led to an outstanding market size of just under €700bn publicly available/distributed bonds excluding CLOs. This underlines ABS as a significant sector within fixed income markets. Similarly, since the GFC, the Australian securitisation market has demonstrated steady, consistent growth, but the recent acceleration signals robust investor appetite combined with increased supply from a growing non-bank issuer base. In addition, JPM research notes that both the European and Australian markets finished the year with not just record issuance but also positive net supply: net distributed European and Australian ABS issuance reach +€19.3bn and +€6.4bn, respectively, for FY 2025. A healthy securitisation market is one where innovation and new asset classes emerge, and 2025 did not disappoint. Europe has continued to see stable issuance from traditional mortgage and consumer collateral sectors but there was also a significant number of new deals and issuers which debuted in the market, giving investors a good source of diversity across platforms and collateral types. In Australia, while RMBS continued to dominate supply last year, non-RMBS issuance has grown significantly with sizeable volumes of auto/equipment issuance over recent years and more non-bank lenders in the consumer and SME space adding greater diversity. Liquidity in the asset class, globally, continued to show resilience, demonstrated by secondary market depth and investor demand even through significant bouts of market volatility such as that seen in April. Some examples of this:
For 2026, we anticipate the need for funding and reinvestment to continue and issuance to remain elevated. If the current environment persists all signs are pointing to the potential for another record year! We expect strong demand for the asset class to persist and increased origination in traditional consumer underlying assets as well as newer types of collateral to support growth in the asset class. Despite potential macroeconomic volatility, the sector's resilience and the stable investor base make it well placed for the sector to continue. Asset PerformanceHeadline fundamentals stayed healthy in 2025 year but were accompanied by a side of tiering - both for consumer as well as levered corporate performance. Capital market volatility, macroeconomic uncertainty and credit stories such as Tricolour emerging in the US kept investors on their toes but structured finance ratings were largely stable through 2025 maintaining a stable to positive ratings drift. Looking forward, the performance outlook for most collateral types is expected to be stable but we remain mindful of macro and interest rate uncertainty for consumer and corporate borrowers. Despite global central bank rates continuing to reduce from their 2024 peaks during 2025, interest rates are persisting in a higher for longer phase compared to pre-Covid levels, particularly as inflation has remained somewhat "sticky" during 2025. Investors should be focused on limiting risks around macro-led shocks to borrowers by analysing collateral through the interest rate cycle, keeping in mind the key issue of affordability for customers and the importance of strong, effective underwriting by issuers. Unemployment indicators continue to drift upwards and remain front of mind for investors looking for read across into consumer credit performance. Esoteric and new asset classes were a key theme in 2025Clearly, securitisation continues to be a key funding tool for traditional consumer and mortgage asset classes, but the past few years have seen exciting developments in new collateral types coming to market. Funding levels in structured finance are attractive for issuers and these new sectors have generally been received well by the market. Additionally, through 2025 we noted a number of new issues in sectors with positive ESG characteristics and considerations. These include solar and heat pump ABS as well as later life mortgages and transactions described as shariah compliant RMBS on the social side. EV auto financing continues to be a growing segment within Auto ABS portfolios. Risks and Opportunities in 2026:Macro and geopolitical risks continue: Writing this just a couple of weeks into 2026, political and geopolitical risks continue to be front-of-mind for market participants. We expect this dynamic to persist this year and for investor sentiment to remain sensitive to developments in geopolitics, global trade policy as well as the path of interest rates in the US and in Europe. Consumer performance: Structural protection in ABS structures mitigate risks In Europe, consumers continue to face structural and cyclical risks, being described as financially resilient but behaviorally cautious. However, expectations for unemployment to remain broadly stable maintains a base for low and stable credit card and ABS arrears performance. We do expect tiering to continue between better quality prime collateral and more non prime lenders who support underserved borrowers. Structural protections afford to investors in securitised structures, help mitigate risk, often with increasing protection over time as transactions or assets de-lever. Housing Market Valuations: Asset prices, in particular housing, in the UK, Australia and Europe remain on a stable or improving trend given the consistent undersupply seen in construction of housing seen across the major RMBS markets together with continued increase in demand. Where there has been some slowing in segments of the market, in the UK for example, with London apartment valuations facing pressure, we note that the Buy to Let RMBS performance remains consistent given stable unemployment and rental streams. Any unforeseen shock to unemployment or regulatory impacts are key to performance but, post GFC affordability regulations and appropriate stress testing of borrowers' together with stability in underwriting gives investors comfort beyond the structural features of RMBS. Amongst and despite the risks above we note some significant opportunities for experienced investors in Global structured finance markets: New and Esoteric Asset Classes: As noted above, we have seen issuance beyond traditional platforms over the last couple of years emerging. The use of securitisation as a funding tool beyond "on the run" platforms is valuable to investors. New issuers to the market, including those establish issuers that diversifying their funding via securitisation, and collateral types in Europe and Australia present opportunities to earn a premium over more traditional platforms and provide diversity to portfolios. That said, we should be cognisant of potential additional risks that may need to be considered relating to new lending types as well as the short historical performance available for some types of collateral which is needed to structure, rate and stress transactions appropriately. European Markets give investors depth, diversity and Liquidity We continue to see opportunities in the European ABS and CLO markets with an overall size of over €600bn now, the market gives investors good relative value where diversity of jurisdictional collateral risk alongside strong historical performance. This is all within the context of a dedicated investor base and proven liquidity in the asset class. Regulation, regulation, regulationRegulation will remain a key consideration in 2026, particularly in Europe, where the European Securitisation legislation aims to reduce barriers to issuance and investment in EU securitisation:
Collectively, these developments should improve funding conditions and make securitisation more attractive to a broader investor base albeit with a fluid timeline. Implications of the motor finance commission rulings for UK Auto ABSThe FCA consultation on motor finance broker commissions is still ongoing, but any impact on ABS has been limited and if the redress scheme is as expected, focussed on discretionary commission arrangements, we expect little to no impact on new and outstanding UK auto asset-backed securities (ABS) transactions as a negligible amount of collateral in outstanding securitised bonds would be affected. Secondary liquidity was more challenged until more clarity was reached. Issuance in UK Auto ABS across bank and non-bank lenders, was €3.6bn in 2024 compared to 2025 where no issuance at all was seen until September, when VW opened the market and priced well with strong demand. As we noted in one of our published articles at the time we expected this to be a positive signal for UK non-bank lenders, giving them confidence in execution. Indeed, Oodle came with a Dowson transaction soon after which was taken well by the market. That said, given lower origination volumes over 2025 for the UK non bank lenders, particularly in the non prime space, funding needs may be more muted in 2026. It is also worth noting, that used car prices fell as supply of cars normalised post covid, residual values have also corrected back down; stabilising for ICE vehicles but falling sharply for EVs, where residual values proved significantly over forecast. Looking forward to 2026:The depth and diversity of the European and Australian markets continue to support the role of global securitised products as a strategic allocation within fixed income portfolio; enabling diversification across jurisdictions, collateral types and issuer profiles while maintaining liquidity. Looking forward, regulatory developments, continued innovation in collateral and an expanding issuer base should reinforce market depth and opportunity, making securitised credit not merely a tactical allocation but a durable, scalable and resilient cornerstone of fixed income portfolios in 2026 and well beyond. Challenger IM Credit Income Fund , Challenger IM Multi-Sector Private Lending Fund For Adviser & Investors Only Disclaimer: This material has been prepared by Challenger Investment Partners Limited (Challenger Investment Management or Challenger), ABN 29 092 382 842, AFSL 329 828. This document does not relate to any financial or investment product or service and does not constitute or form part of any offer to sell, or any solicitation of any offer to subscribe or interests and the information provided is intended to be general in nature only. This should not form the basis of, or be relied upon for the purpose of, any investment decision. This document is not available to retail investors as defined under local laws. This document has been prepared without taking into account any person's objectives, financial situation or needs. Any person receiving the information in this document should consider the appropriateness of the information, in light of their own objectives, financial situation or needs before acting. This document is provided to you on the basis that it should not be relied upon for any purpose other than information and discussion. The document has not been independently verified. No reliance may be placed for any purpose on the document or its accuracy, fairness, correctness, or completeness. Neither Challenger Investment Management nor any of its related bodies corporates, associates and employees shall have any liability whatsoever (in negligence or otherwise) for any loss howsoever arising from any use of the document or otherwise in connection with the presentation. |

4 Mar 2026 - Volatility Is Information: Reading the Signals Beneath the Surface
|
Volatility Is Information: Reading the Signals Beneath the Surface JCB Jamieson Coote Bonds February 2026 (3-minute read) The investment outlook this year remains shrouded by uncertainty, accompanied by elevated volatility in expected returns. Markets are searching for direction, and investors are navigating an environment where conviction feels harder earned. Volatility, of course, wears many faces. We can observe it in the lived experience of asset price return variability across securities, sectors and markets. Or we may deduce the anticipated range of returns over the next week, month or quarter from options prices. Either way, the direction, size and interdependencies (correlations) of movements in market pricing at all frequencies can provide important signals for astute investors. Volatility is not simply noise, it is information. Right now, equity prices, cryptocurrencies, and precious metals are relatively more volatile. Yet in contrast, most bond markets remain curiously subdued. Yields remain broadly rangebound, only tentatively challenging the edges of recent ranges, reticent to enter an elusive new regime or steady state. That restraint in bond markets is notable, and perhaps more revealing than the visible turbulence elsewhere. After hiking rates earlier this month, RBA Governor Michelle Bullock stopped short of offering explicit forward guidance, indicating that the Monetary Policy Board is heavily data dependent. This suggests further policy restriction may have limited efficacy in controlling persistently above-band inflation back to the target range. Australian government bond yields decreased markedly in response, and the market is paring back pricing for hikes and beginning to tentatively pre-empt future rate cuts next year. The tone has shifted, from further restriction to a growing debate about how long policy will need to remain restrictive at all. More broadly, attention is turning to the Government for direction ahead of the upcoming Federal Budget. There is growing recognition that boosting labour productivity through innovation, enhanced competition and meaningful structural and tax reform remains the only sustainable path to higher national income and improved living standards for all Australians. Meanwhile, across the Pacific in the U.S., economic activity continues to show surprising resilience. January brought unexpectedly strong employment growth, thanks in part to seasonal factors (despite large historical downward revisions). Price pressures, meanwhile appear to be cooling, although the data remains messy and influenced by lingering U.S. federal government shutdown-related disruptions. The result? Short-dated Treasury yields have drifted to multi-year lows, reflecting cautious optimism among investors. The market has almost priced for three U.S. Federal Reserve rate cuts this year under U.S. Federal Reserve Chair nominee Kevin Warsh, although the upcoming midterm elections loom large over the U.S. macro outlook and the Trump administration's near-term policy priorities. In Europe, inflation appears to be well controlled and the European Central Bank comfortably on hold, but recent geopolitical events have raised existential questions around the protection and advancement of national and regional interests, and defence and security strategy. While this may be the quintessential European moment to rebalance the world order away from U.S. dominance if traditional allegiances like NATO are set to be dissolved, there have been fundamental disagreements between Germany and France around policy priorities to restore competitiveness and how to fund quickly growing defence expenditures. Yields on German government bonds have also dropped materially in recent weeks. In Japan, the Liberal Democratic Party lead by Sanae Takaichi has emerged victorious from lower house elections. Takaichi's expanded mandate and firm command over political and economic power (for instance, Japan's central bank is not independent of government) after her historic win, combined with a sense of renewed optimism across global markets that the realisation of her vision for Japan will not unduly impact interest rates and exchange rates beyond what is already envisaged, has led to a relief rally in Japanese Government Bonds after a tumultuous January. What signal can we draw from the subdued historical measures of volatility across bond yields, especially when viewed against the domestic and global macro backdrop? There are three key takeaways. First, periods of volatility and uncertainty (whether obvious or hidden) can bring significant opportunity to generate attractive returns for those who act thoughtfully. Second, fortune rewards the diligent and there are only downside risks to complacency. And third, and most importantly, diversification, both within and across asset classes and sectors is the primary means with which to dampen the effects of volatility and protect long-term investment outcomes. Volatility may rattle markets, but it also sharpens our focus, driving better portfolio construction and smarter asset allocation decisions. Funds operated by this manager: CC Jamieson Coote Bonds Active Bond Fund (Class A) , CC Jamieson Coote Bonds Dynamic Alpha Fund This information is for professional and wholesale investors only and has been prepared by JamiesonCooteBonds Pty Ltd ACN 165 890 282 AFSL 459018 ('JCB'). Channel Investment Management Limited ACN 163 234 240 AFSL 439007 ('CIML') is the Responsible Entity and issuer of units for the CC JCB Active Bond Fund ARSN 610 435 302, CC JCB Global Bond Fund ARSN 631 235 553 and the CC JCB Dynamic Alpha Fund ARSN 637 628 918 (collectively 'the Funds'). Channel Capital Pty Ltd ACN 162 591 568 AR No. 001274413 ('Channel') provides investment infrastructure and distribution services for JCB and is the holding company of CIML. |