NEWS

9 Apr 2026 - Phil Strano: Staying the course in credit

8 Apr 2026 - Q&A: Four forces currently shaping equity markets
|
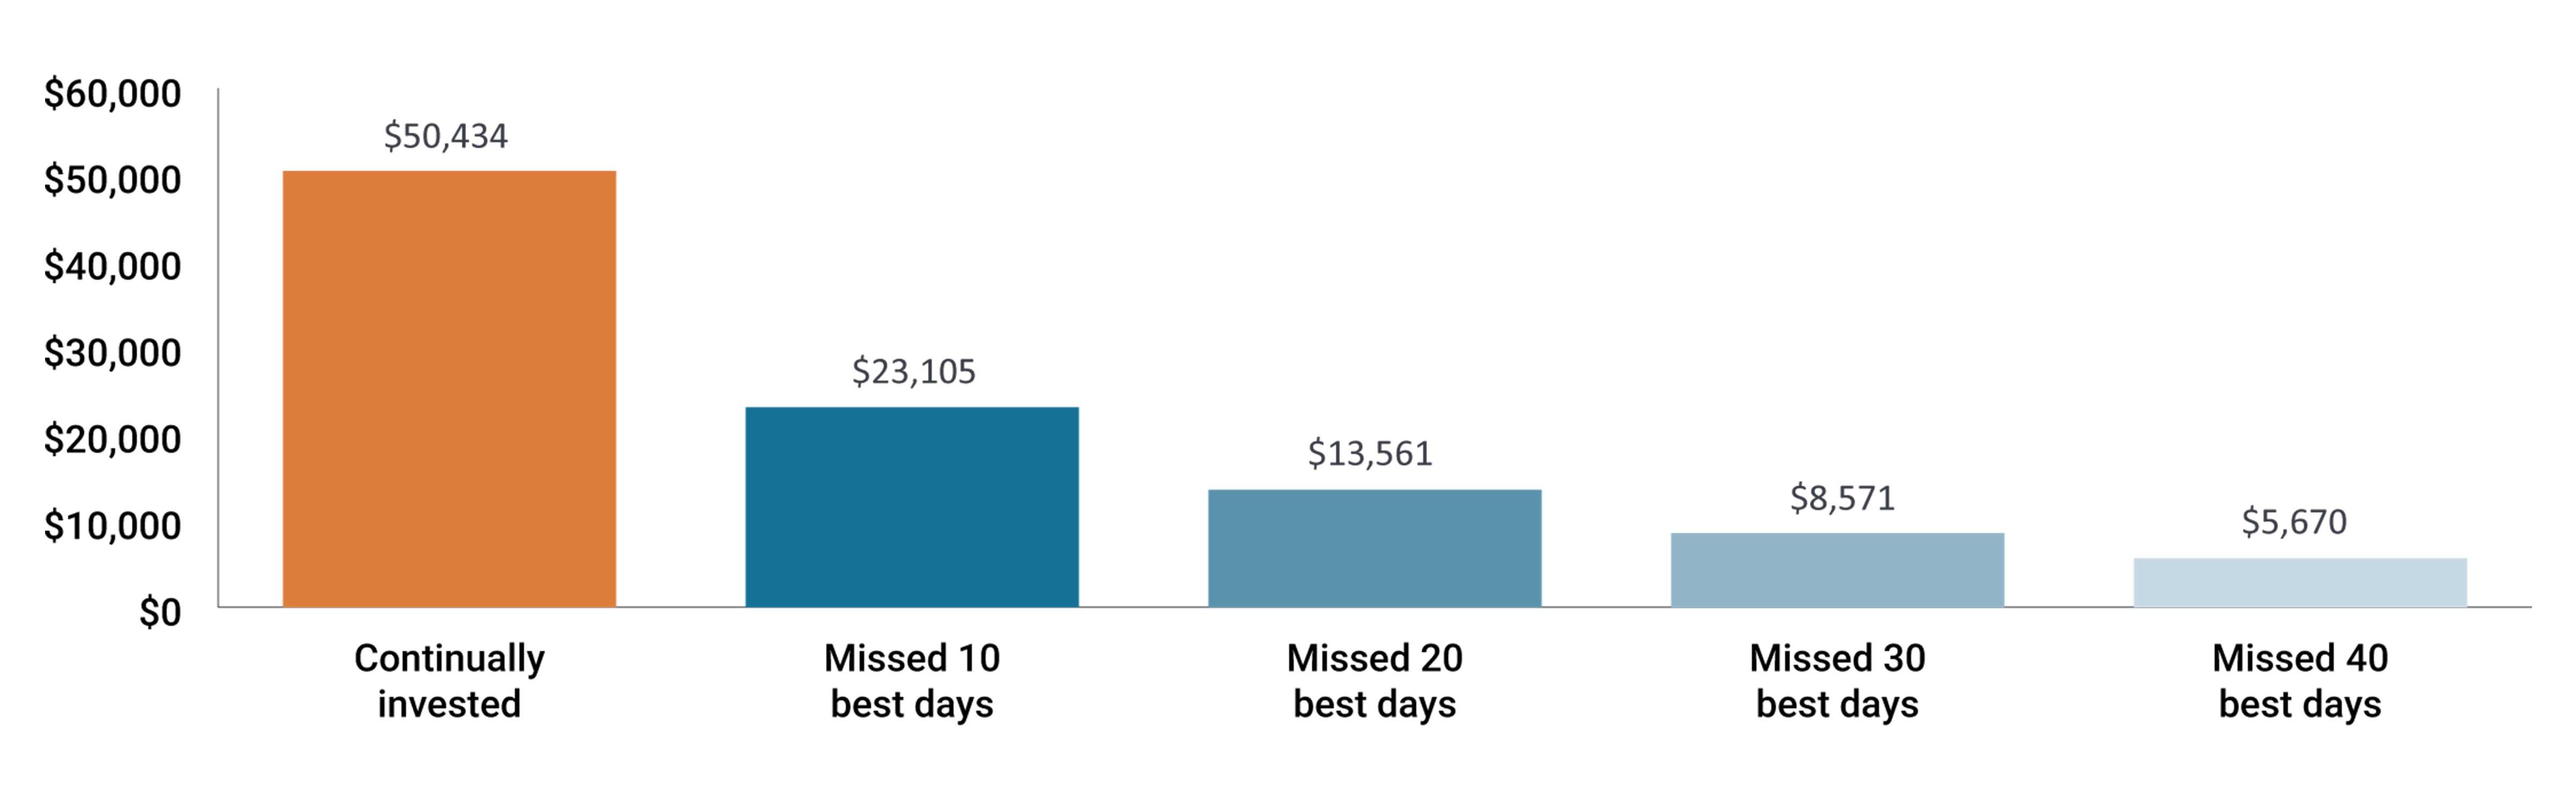
Q&A: Four forces currently shaping equity markets JCB Jamieson Coote Bonds March 2026 (6-minute read) In this Q&A, Portfolio Managers Jeremiah Buckley and Michael Keough share their perspectives on geopolitical uncertainty, why they remain constructive on earnings growth, where they see inflation settling, and what AI disruption means for software. Q: Geopolitical events like the war in Iran can move markets quickly. How do you approach investing through that kind of uncertainty? Michael Keough: Geopolitical events can carry real tail risks that are hard to model, but the key question is what will the sustained economic impact actually be? Often, it's more limited than the initial reaction suggests. Our current read is that this appears to be a shorter-duration campaign focused on specific military infrastructure rather than broader energy systems. If the Strait of Hormuz reopens in the near future and energy infrastructure is not significantly disrupted, we expect the oil price spike is likely to be temporary but potentially lasting the first half of the year. We are also mindful that the administration must balance their objectives for this campaign with the upcoming midterm elections. It also helps to consider where we started. Oil had been at fairly low levels, around $50 to $60 a barrel, and the world was already oversupplied by roughly 2 million barrels a day heading into this. Iran produces about 3 million barrels a day, and we do not expect a sustained removal of that supply. More broadly, our approach during periods like this is to lean into quality and use volatility as an opportunity. In our asset allocation portfolios, we came into 2026 with a meaningful overweight to equities based on our view that earnings growth would remain positive. We didn't anticipate this level of geopolitical disruption, but we don't see it materially changing the fundamental picture for the year, which is supported by a number of tailwinds. If markets continue to sell off, our bias is to add to equities selectively. It's worth noting the opportunity cost of becoming too defensive. Over the last couple of years, being too conservative, such as holding too much cash or underweighting equities, meant missing the recoveries that drove the bulk of returns. Historically, a handful of strong market days have contributed an outsized share of long-term equity returns, and investors need to be positioned to capture them. Exhibit 1: Value of a hypothetical $10,000 investment in the S&P 500® Index from 1999 - 2024.
Q: You mentioned the fundamental picture remains intact. What gives you confidence, and where are you seeing the opportunity? Jeremiah Buckley: The earnings story has broadened considerably, and that's central to our constructive view. AI infrastructure and large internet platforms have been growing strongly, but they are no longer carrying the market alone. Other sectors have started contributing meaningfully, including biotech, healthcare equipment, digital payments, and financial services. Innovation in these areas is translating into earnings. Technology-related capital expenditures are contributing roughly a third of GDP growth in 2026, and the benefits are flowing well beyond the infrastructure build itself. Exhibit 2: Strong revenue and earnings growth is expected broadly across sectors for 2026
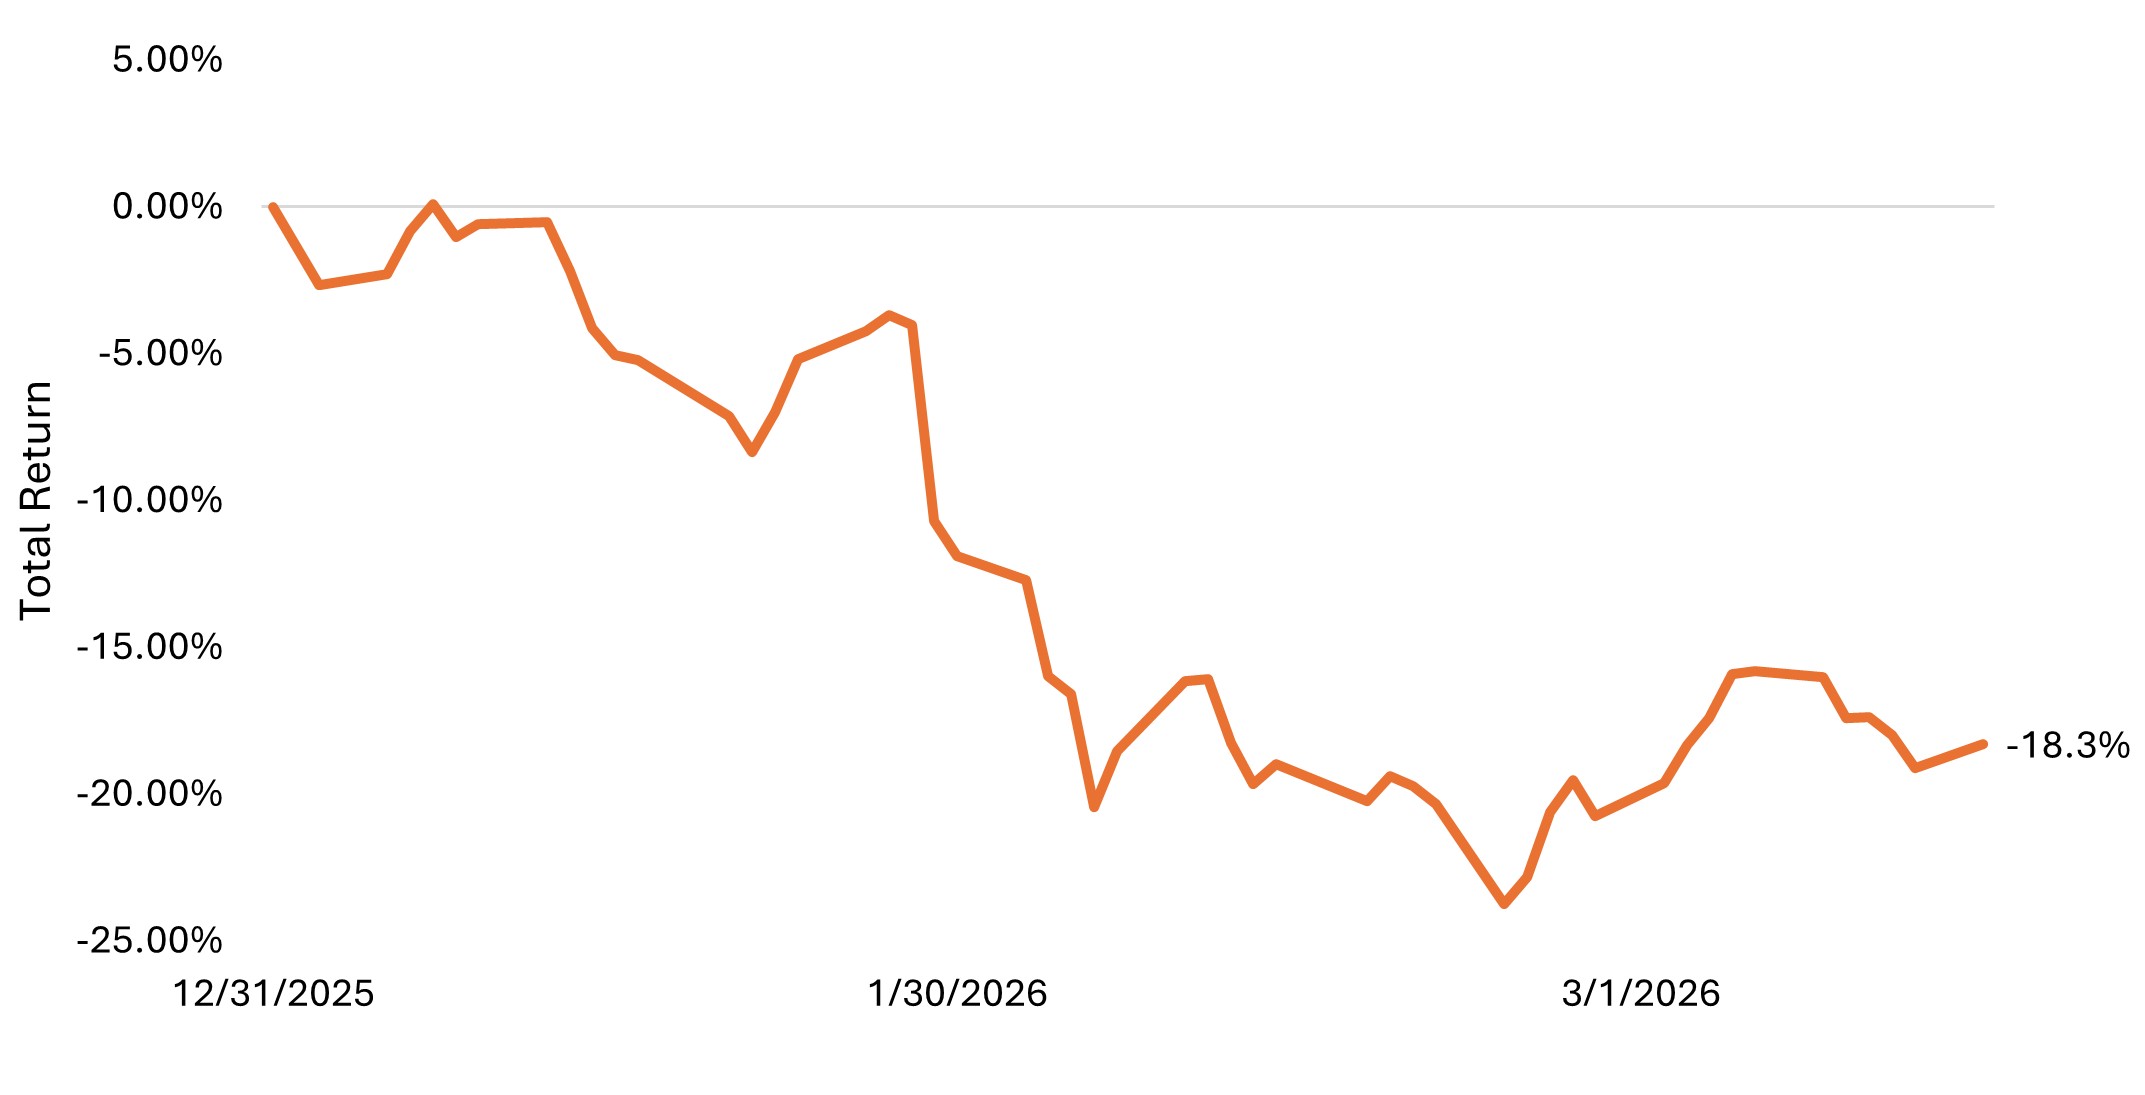
Source: Bloomberg, as of January 2026. CY=calendar year. There are also tailwinds that tend to get overshadowed by headlines from geopolitical events. Tax reform, deregulation, and the early productivity gains from technology investment are all constructive for corporate earnings and haven't gone away. We can also be active in how we are positioning through near-term volatility. In 2025, we used periods when cyclical sectors were being indiscriminately sold off to rotate into more cyclical exposure. We think a similar dynamic may be developing now, and we'll be looking for opportunities to act on it. Q: There's been a lot of debate about whether inflation can get back to 2% or whether 3% is the new normal. What is your view? Keough: We think getting back to 2% is going to be difficult to sustain. Structural pressures remain, including supply constraints, a modest degree of deglobalization, higher energy prices, and slower population weighing on labor. AI could help offset that last point, but probably not enough on its own unless productivity gains substantially exceed current expectations. That said, some of the forces that held inflation elevated are fading. Tariff-related goods inflation is being lapped, year-over-year comparisons are getting easier, and some tariffs have since been reduced by court rulings. Those headwinds are becoming less of a factor as the year progresses. Our base case is around 2.5%, with long-term inflation expectations closer to 2%, and we'd argue that's a reasonably healthy environment for equities. It gives companies a bit of pricing power without forcing the Federal Reserve to tighten. Given the other tailwinds supporting earnings growth, it fits into what we still see as a constructive backdrop. Q: As AI is adopted more broadly, risks to certain parts of the market are becoming clearer. How are you thinking about those risks, and what does it mean for software? Buckley: Having watched many technology cycles, we do think there is some degree of overhype embedded in this one, and we're watching returns on invested capital closely across the infrastructure build. Spending will plateau at some point, and the market will need to digest it. The early evidence on returns is encouraging. Meta's advertising revenue growth is perhaps the clearest example of AI investment generating real, measurable results, but that is one data point in an evolving story. Where we're seeing the hype manifest most acutely is in the market's treatment of software. The software index is down roughly 18% year to date as investors price in disruption from AI. Some of that concern is legitimate, but we don't think the market is distinguishing well between companies that will be genuinely disrupted and those that are adapting effectively. Exhibit 3: S&P Software & Services Industry Index, year-to-date through 16 March 2026
Source: Bloomberg, as of 17 March 2026. The S&P Software & Services Select Industry Index comprises stocks in the S&P Total Market Index that are classified in the GICS Application Software, Interactive Home Entertainment, IT Consulting & Other Services and Systems Software sub-industries. For high-quality software businesses, there's more to their competitive position than the software itself - distribution, customer relationships, and implementation support all factor into the equation. Those advantages don't disappear overnight. We're starting to see some stabilization in the space, but the longer-term sorting out process is underway, and we expect it to create real opportunities for active management. IMPORTANT INFORMATION Artificial intelligence ("AI") focused companies, including those that develop or utilize AI technologies, may face rapid product obsolescence, intense competition, and increased regulatory scrutiny. These companies often rely heavily on intellectual property, invest significantly in research and development, and depend on maintaining and growing consumer demand. Their securities may be more volatile than those of companies offering more established technologies and may be affected by risks tied to the use of AI in business operations, including legal liability or reputational harm. Equity securities are subject to risks including market risk. Returns will fluctuate in response to issuer, political and economic developments. Funds operated by this manager: CC Jamieson Coote Bonds Active Bond Fund (Class A) , CC Jamieson Coote Bonds Dynamic Alpha Fund This information is for professional and wholesale investors only and has been prepared by JamiesonCooteBonds Pty Ltd ACN 165 890 282 AFSL 459018 ('JCB'). Channel Investment Management Limited ACN 163 234 240 AFSL 439007 ('CIML') is the Responsible Entity and issuer of units for the CC JCB Active Bond Fund ARSN 610 435 302, CC JCB Global Bond Fund ARSN 631 235 553 and the CC JCB Dynamic Alpha Fund ARSN 637 628 918 (collectively 'the Funds'). Channel Capital Pty Ltd ACN 162 591 568 AR No. 001274413 ('Channel') provides investment infrastructure and distribution services for JCB and is the holding company of CIML. |
 Past performance is no guarantee of future results. Investing involves risk, including the possible loss of principal and fluctuation of value.
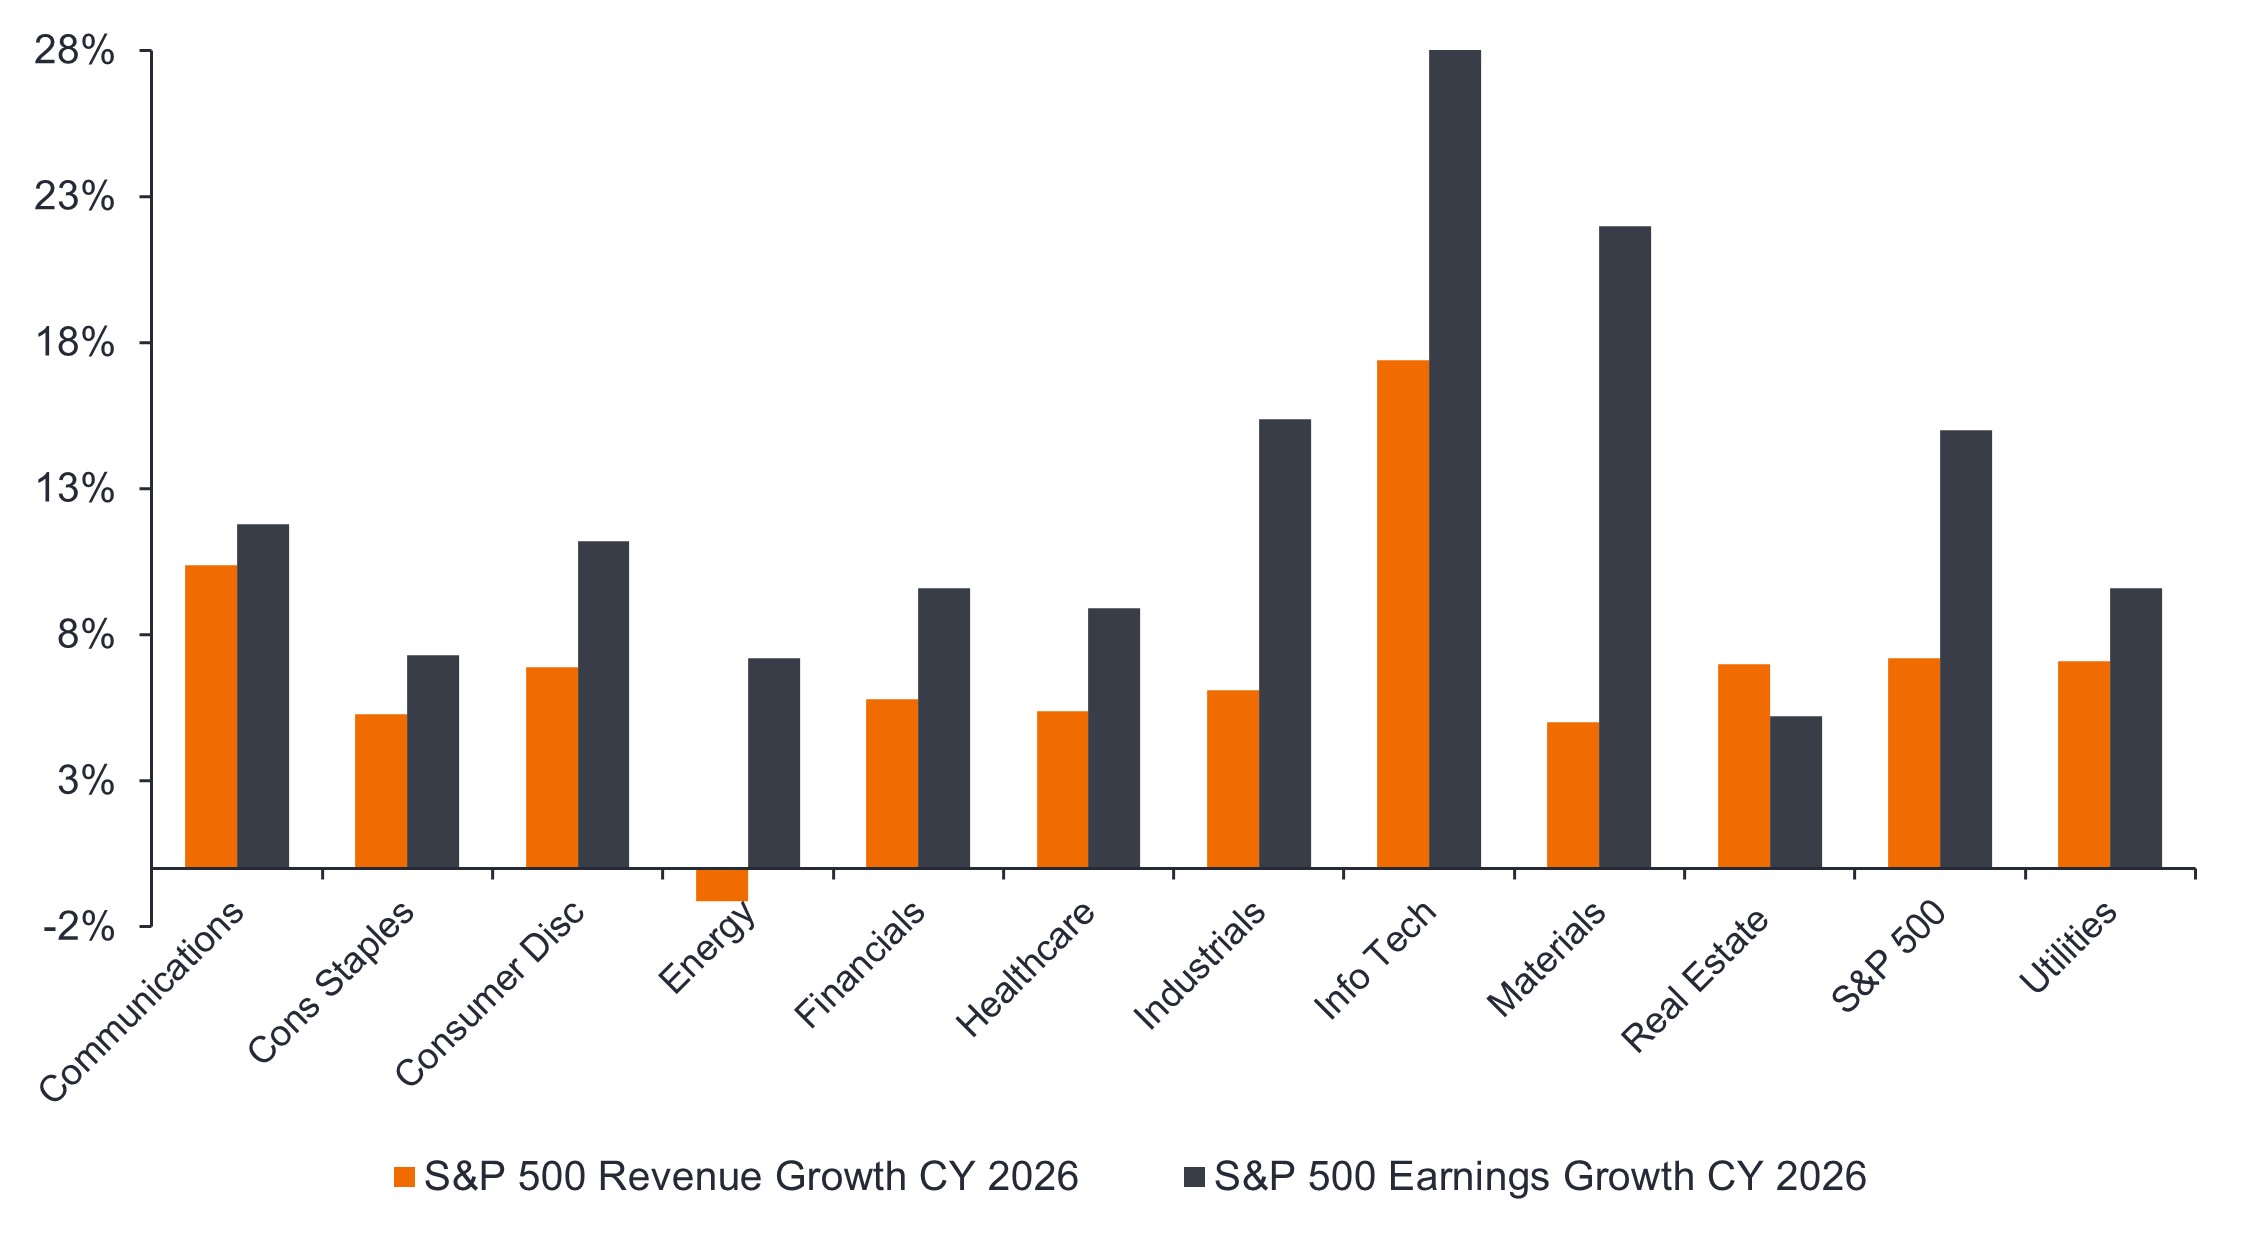

7 Apr 2026 - Infrastructure in focus: The HALO effect
|
Infrastructure in focus: The HALO effect Magellan Investment Partners March 2026 (5-minute read) |
|
HALO (heavy assets, low obsolescence) stocks have come into focus in markets in the New Year. In recent weeks, investors have pushed into defensive and asset-heavy sectors, as concerns about the impact of AI on some business models have led a rotation into infrastructure, along with energy and materials.
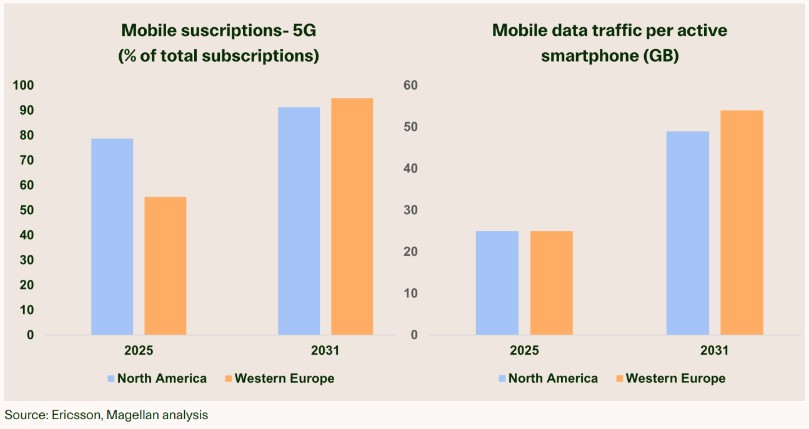
Such companies are attractive to investors when uncertainty ratchets higher. Businesses with real assets have less scope for disruption and, typically, dependable demand drivers. Infrastructure is a particularly clear example, such as with integrated power companies continuing to serve customers through their generation, transmission and distribution assets or water companies providing drinking water to households and other end users. Importantly, we see the HALO effect for infrastructure businesses as having staying power beyond any sector rotation in the near term. At their core, these are not cyclical businesses. Communications infrastructure is one such sector we like that exemplifies this outlook. These companies own tower infrastructure and lease space on their towers to mobile network operators. Growing data demand requires more equipment; and while adding more equipment on a tower incurs only a minimal incremental cost, it can provide a meaningful uplift to returns for that tower. Importantly, tower revenues are also mostly long-term, contracted and predictable in nature. These companies have a solid, sustainable outlook for revenue growth, reflecting the insatiable demand for mobile data everywhere (estimated at 12-13% CAGR in Western Europe and the US through 20311 ). While we anticipate further consolidation from telcos (particularly in Europe), strong contracts, the potential for government-mandated investment, and improving return economics for the remaining telco players (which should allow them to invest in their networks) mean the tower companies should be able to continue to generate solid cash flow and returns to investors. Examples of companies we invest in include US tower companies American Tower and Crown Castle and European communications infrastructure company Cellnex. There are risks to our outlook, including a major step-change in technology. However, we see communications infrastructure as a true HALO sector. Mobile data seems certainly low obsolescence in the world of social media, apps, maps and mobile entertainment we live in today. 1 Ericsson |
|
Funds operated by this manager: Vinva Global Alpha Fund - Active ETF (ASX: V1AC) , Vinva Australian Equity Fund , Vinva Global Equity Fund , Vinva Australian Alpha Extension Fund , Vinva Global Alpha Extension Fund , Magellan Infrastructure Fund , Magellan Global Opportunities Fund No.2 , Magellan Infrastructure Fund (Unhedged) , Magellan Core Infrastructure Fund , Magellan Global Opportunities Fund Active ETF (ASX:OPPT) Important Information: This material has been delivered to you by Magellan Asset Management Limited ABN 31 120 593 946 AFS Licence No. 304 301 trading as Magellan Investment Partners ('Magellan Investment Partners') and has been prepared for general information purposes only and must not be construed as investment advice or as an investment recommendation. This material does not take into account your investment objectives, financial situation or particular needs. This material does not constitute an offer or inducement to engage in an investment activity nor does it form part of any offer documentation, offer or invitation to purchase, sell or subscribe for interests in any type of investment product or service. You should obtain and consider the relevant Product Disclosure Statement ('PDS') and Target Market Determination ('TMD') and consider obtaining professional investment advice tailored to your specific circumstances before making a decision about whether to acquire, or continue to hold, the relevant financial product. A copy of the relevant PDS and TMD relating to a Magellan Investment Partners financial product may be obtained by calling +61 2 9235 4888 or by visiting www.magellaninvestmentpartners.com Past performance is not necessarily indicative of future results and no person guarantees the future performance of any financial product or service, the amount or timing of any return from it, that asset allocations will be met, that it will be able to implement its investment strategy or that its investment objectives will be achieved. This material may contain 'forward-looking statements'. Actual events or results or the actual performance of a Magellan Investment Partners financial product or service may differ materially from those reflected or contemplated in such forward-looking statements. This material may include data, research and other information from third party sources. No guarantee is made that such information is accurate, complete or timely and no warranty is given regarding results obtained from its use. This information is subject to change at any time and no person has any responsibility to update any of the information provided in this material. Statements contained in this material that are not historical facts are based on current expectations, estimates, projections, opinions and beliefs of Magellan Investment Partners or the third party responsible for making those statements (as relevant). Such statements involve known and unknown risks, uncertainties and other factors, and undue reliance should not be placed thereon. No representation or warranty is made with respect to the accuracy or completeness of any of the information contained in this material. Magellan Investment Partners will not be responsible or liable for any losses arising from your use or reliance upon any part of the information contained in this material. Any third-party trademarks contained herein are the property of their respective owners and Magellan Investment Partners claims no ownership in, nor any affiliation with, such trademarks. Any third-party trademarks contained herein are the property of their respective owners, are used for information purposes and only to identify the company names or brands of their respective owners, and no affiliation, sponsorship or endorsement should be inferred from such use. This material and the information contained within it may not be reproduced, or disclosed, in whole or in part, without the prior written consent of Magellan Investment Partners. (080825-#W17) |

2 Apr 2026 - Unravelling the forces driving corporate credit's resilience
|
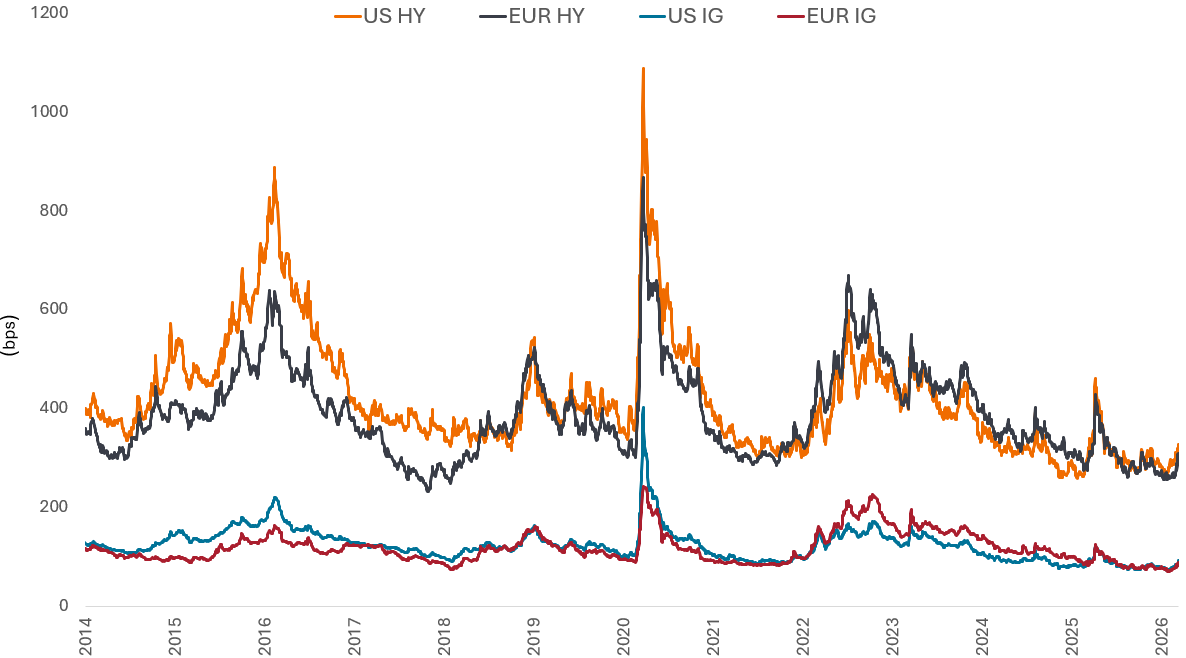
Unravelling the forces driving corporate credit's resilience Janus Henderson Investors March 2026 (8-minute read) Corporate credit has absorbed recent shocks with limited disruption. Head of High Yield Tom Ross and Corporate Credit Portfolio Manager James Briggs examine how fundamentals, market behaviour and dynamics as well as macro context are shaping credit resilience. Credit markets sanguine amid geopolitical riskThe conflict in the Middle East has drawn parallels with the outbreak of the Russia-Ukraine War, with concerns that an oil-induced supply and inflation shock could harm the global economy. So far, credit markets have reacted in a sanguine manner, with changes in credit spreads not dissimilar to the rates impact from rising government bond yields. As the chart below shows, the recent tick-up in credit spreads is muted when compared to last year's Liberation Day sell-off, let alone the 2015 energy sell-off after oil prices collapsed or the Covid spike. For now, the market assumption is that the conflict remains regional, although high oil and gas prices - caused by Iran's choke hold on ships transiting the Strait of Hormuz - could have a material impact on inflation and consumption were they to be sustained beyond the short term. For the time being, geopolitical shocks have not yet translated into a material deterioration in key economic data. So far, we see this as a volatility event rather than an economic event impacting inflation and consumption. Figure 1: Credit spread on high yield and investment grade corporate bonds
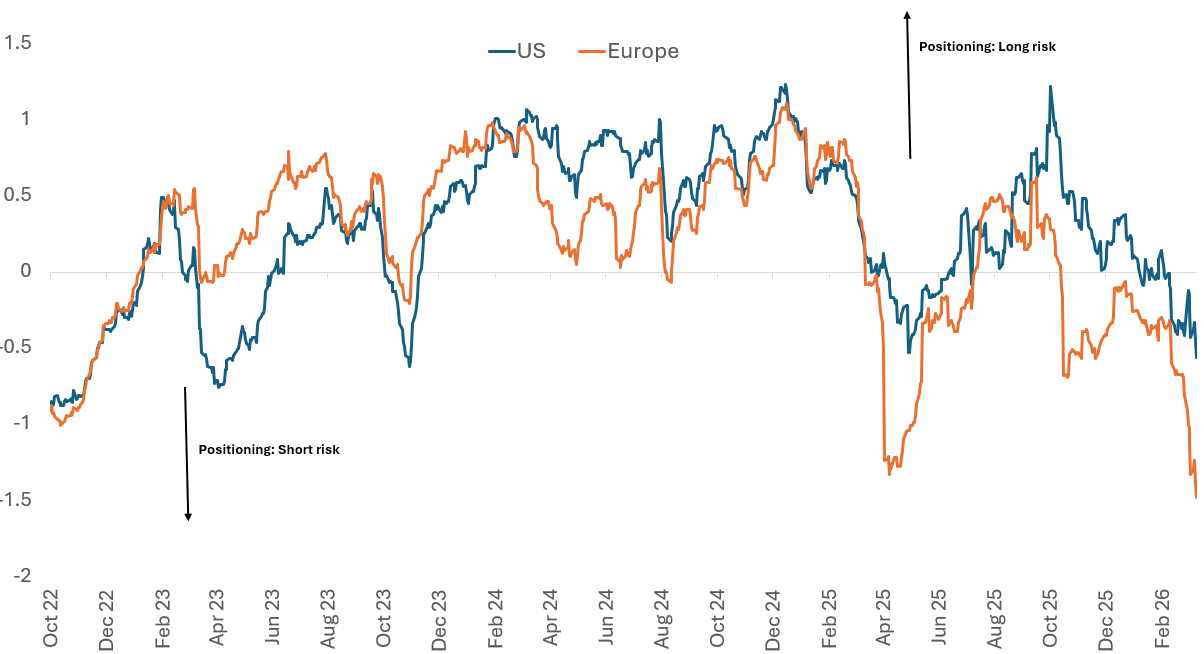
Source: Bloomberg, US HY = US High Yield:ICE BofA US High Yield Index; EUR HY = Euro High Yield: ICE BofA Euro High Yield Index, US IG = US investment grade: ICE BofA US Corporate Index, EUR IG = Euro Investment Grade: ICE BofA Euro Corporate Index, Govt OAS (option adjusted spreads over governments), 01 January 2014 to 13 March 2026. Bps= basis points. Spreads may vary and are not guaranteed. Past performance does not predict future returns. The forces behind corporate credit's resilienceWe believe there are several reasons why the corporate bond markets have responded in such an orderly way. First, investor positioning is light given credit spreads are at the tighter end of historical ranges (Figure 2). Anecdotally, most investors were neutrally positioned heading into this conflict and waiting for more attractive valuations to add risk. Recall that there had been nervousness around artificial intelligence (AI) disruption and private credit fears earlier in the year. Figure 2: Positioning in credit is light, as market trades short
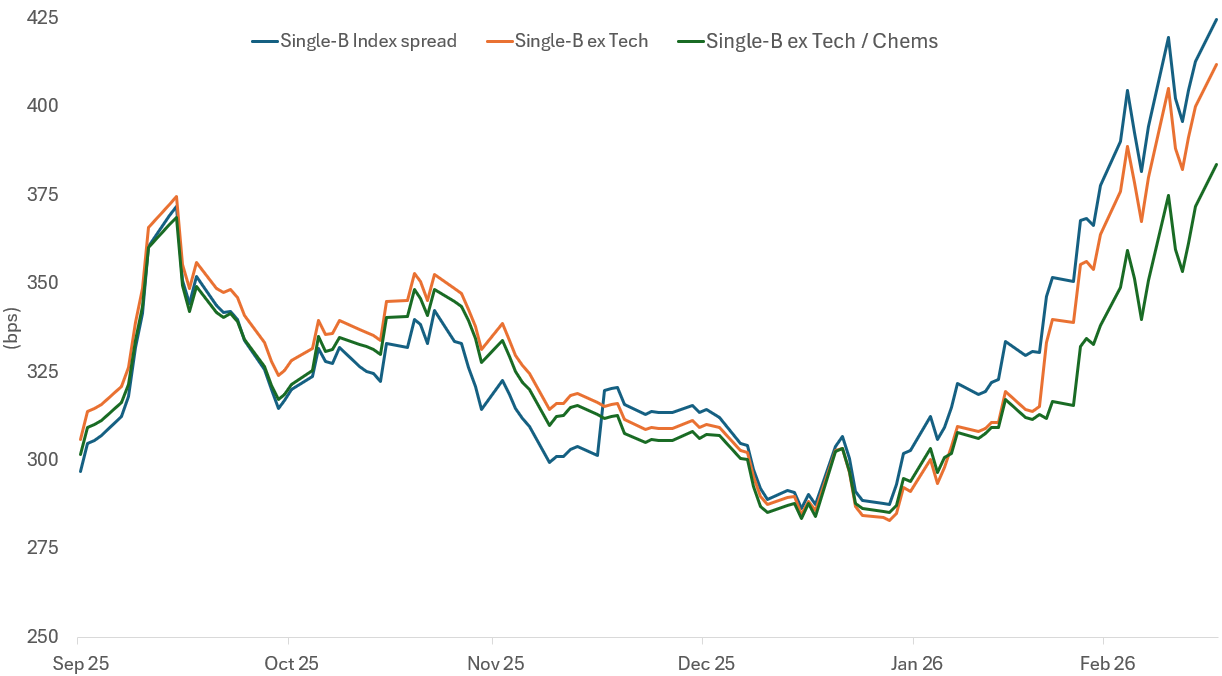
Source: ICI, Bloomberg, DTCC, BNP Paribas. The BNPP Positioning Indicator (BNPPIUS, BNPPIEU) reflects data on dealer inventories, funds' cash balances, Commodity Trading Advisors (CTA) positioning, Credit Default Swap (CDS) market positioning and option hedging, as at 12 March 2026. The BNPP Credit Positioning Indicator shows how long (positive number) or short (negative number) investors are positioned in credit markets, indicating whether exposure to credit risk is extended, neutral or defensive. Second, there has already been a reasonable amount of corporate bond issuance so far this year. US investment grade issuance was US$474 billion in the first 10 weeks of the year, up 6% compared to the same period in 2025, and US high yield and loans (leveraged finance) issuance was US$64 billion, up 34% compared with the same period in 2025. Over the same period European investment grade issuance is €170 billion, down a marginal 3%, but European high yield is €23 billion, up 40% year- on-year.1 A key concern has been the scale of tech-related issuance, particularly for the investment grade market. However, the hyperscalers have made good progress with their capital raising, with Oracle claiming they do not expect to issue any additional bonds for the remainder of the calendar year 2026.2 Taken together, companies have been successful in borrowing earlier in the year which should take some pressure off needing to come to the market in the very near term. The strong technical (market dynamics) picture that has been in place should remain intact. Third, turning to demand, higher yields are already attracting yield sensitive buyers, such as insurance companies stepping in as we have heard anecdotally. Yields on US high yield are back above 7% and are at 5.7% in European high yield. US investment grade is above 5% and European investment grade at 3.5%.3 As explained earlier, a portion of the yield change has been due to the rise in government yields reflecting higher inflation expectations. This has led to a moment of positive correlation between rates and credit spreads, which tends to be temporary. Credit fundamentals resilientAnother backstop to credit spreads is that corporate fundamentals generally remain supportive. Earnings expectations have not rolled over and continue to underpin credit quality. Near�'term earnings face a relatively low hurdle, as Q1 results last year were depressed by tariff speculation, limiting downside risk as we move through the upcoming earnings season. Consensus expectations point to a healthy 20% earnings-per-share growth by Q4 versus Q1, consistent with the typical second�'half earnings catch�'up seen in prior years. Even if those forecasts ultimately prove optimistic, interest rate coverage - earnings covering interest expenses - are broadly stable across investment grade and leveraged finance (high yield and loans). With macro growth still resilient - particularly in the US - credit quality is expected to remain robust enough to absorb market volatility. This provides a supportive macro backdrop for sufficient cashflows to service generally stable and manageable leverage levels. With all�'in yields at attractive levels, fundamentals and earnings serve as the anchor to allow investors to lean into wider spreads where attractive risk-adjusted potential can be captured. This is rather than idiosyncratic risk or geopolitical volatility spooking investors as signalling the start of a more adverse credit cycle. Idiosyncratic stress is rising - but is not systemicTo take a step back then, there is no evidence of a broad earnings downgrade cycle emerging across investment grade or high yield credit. Recent market volatility is increasingly being driven by idiosyncratic rather than broad�'based credit risk, with stress emerging unevenly across sectors and issuers. One area this surfaced in is software, where dispersion widened sharply and price action was severe in specific names as AI-related concerns dominated around revenue displacement. While software is a small component of high-yield indices, the volatility emerged more in the loans market, which has become increasingly bifurcated and private credit. For loans, selective mispriced opportunities have emerged, while CLOs, the main buyer of loans, continue to launch, with many warehouses looking for loans, supporting demand in the near term. This is important as leveraged finance does well in environments where readily available refinancing is present. Private credit, on the other hand, is facing rising redemption pressure. We are seeing headlines around the gating of funds and increased scrutiny of asset values, alongside banks reassessing collateral valuations and pulling back from certain lending relationships. Nevertheless, this adjustment appears to be gradual and uneven, unfolding over time rather than triggering an immediate spillover into public markets. In this context, stress in private markets need not be destabilising for public credit. As capital becomes more cautious it tends to be redeployed conservatively, such as into short-dated bonds or liquid investment grade credit. This may present a modest but constructive technical (demand) for public markets, particularly at a time when yields have become more attractive and markets are sensitive to reward the winners. Rising dispersion from a K-shaped economy
Figure 3: Single Bs are tighter excluding technology and chemicals
Source: Barclays, as 16 March 2026. Spreads may vary and are not guaranteed. Past performance does not predict future returns. For credit investors, this creates an opportunity that is incremental rather than wholesale. Valuations have moved off their tightest levels, but remain far from historic stress points, suggesting scope to add risk selectively. With spreads still tight in aggregate and macro uncertainty elevated, timing and discrimination matter. After all, historical analysis suggests that oil price shocks typically take months to mean-revert once conflicts stabilise. The opportunity therefore lies not in chasing beta, but in leaning into dispersion and adding risk where repricing has been meaningful and fundamentals remain intact, while remaining cautious where valuations have yet to adjust. In that sense, the current environment rewards patience and selectivity, allowing credit investors to engage constructively and with confidence that the forces underpinning resilience remain firmly in place, and in some cases appear to have strengthened. |
|
Funds operated by this manager: Janus Henderson Australian Fixed Interest Fund , Janus Henderson Conservative Fixed Interest Fund , Janus Henderson Diversified Credit Fund , Janus Henderson Global Natural Resources Fund , Janus Henderson Tactical Income Fund , Janus Henderson Australian Fixed Interest Fund - Institutional , Janus Henderson Conservative Fixed Interest Fund - Institutional , Janus Henderson Cash Fund - Institutional , Janus Henderson Global Multi-Strategy Fund , Janus Henderson Global Sustainable Equity Fund , Janus Henderson Sustainable Credit Fund All opinions and estimates in this information are subject to change without notice and are the views of the author at the time of publication. Janus Henderson is not under any obligation to update this information to the extent that it is or becomes out of date or incorrect. The information herein shall not in any way constitute advice or an invitation to invest. It is solely for information purposes and subject to change without notice. This information does not purport to be a comprehensive statement or description of any markets or securities referred to within. Any references to individual securities do not constitute a securities recommendation. Past performance is not indicative of future performance. The value of an investment and the income from it can fall as well as rise and you may not get back the amount originally invested. Whilst Janus Henderson believe that the information is correct at the date of publication, no warranty or representation is given to this effect and no responsibility can be accepted by Janus Henderson to any end users for any action taken on the basis of this information. |

1 Apr 2026 - New Funds on Fundmonitors.com
|
New Funds on FundMonitors.com |
|
Below are some of the funds we've recently added to our database. Follow the links to view each fund's profile, where you'll have access to their offer documents, monthly reports, historical returns, performance analytics, rankings, research, platform availability, and news & insights. |
 |
||||||||||||||||||||||
| Fidelity Japan Equities Fund | ||||||||||||||||||||||
|
||||||||||||||||||||||
| View Profile | ||||||||||||||||||||||
|
|
||||||||||||||||||||||
| Aquasia Residual Stock Fund | ||||||||||||||||||||||
|
||||||||||||||||||||||
 |
||||||||||||||||||||||
| Senjin Capital Fund I | ||||||||||||||||||||||
|
||||||||||||||||||||||
| View Profile | ||||||||||||||||||||||
|
Want to see more funds? |
||||||||||||||||||||||
|
Subscribe for full access to these funds and over 900 others |

31 Mar 2026 - Software risk or renaissance?
|
Software risk or renaissance? Magellan Investment Partners February 2026 (5-minute read) |
|
Artificial intelligence (AI) is driving a structural shift across the technology landscape. This transition has sparked recent fear regarding the long-term viability of traditional software vendors and their established business models. Much of this fear stems from the perceived disruptive threat of AI challengers and the falling cost of software development. In our view, AI brings both risk and opportunity to software. It is a mistake to view the sector as a monolith. Software is as diverse as the applications and industry verticals it serves. Consequently, the impact of AI will vary significantly across the spectrum of vendors. When the market penalises the sector as if it were a homogeneous entity, it creates some opportunity to identify mispriced assets. We believe a number of enterprise software incumbents remain among the most attractive investment opportunities today. What exactly are the concerns? We break these down to four distinct areas.
All of these concerns are both valid and, to some degree, observably taking place. The risk-weighted impact, however, depends on the software category and the software vendor being considered.
AI is a transformative development, and we expect further emergence of compelling new applications that could change how people work. Because the software sector is so diverse, what this means for any given vendor depends on their specific circumstances. For some software names, AI will be disruptive and a risk to their business models. For the highest-quality software vendors like SAP, Microsoft and Intuit, AI is likely to bring a 'renaissance' of opportunity. Adrian Lu, Senior Investment Analyst |
|
Funds operated by this manager: Vinva Global Alpha Fund - Active ETF (ASX: V1AC) , Vinva Australian Equity Fund , Vinva Global Equity Fund , Vinva Australian Alpha Extension Fund , Vinva Global Alpha Extension Fund , Magellan Infrastructure Fund , Magellan Global Opportunities Fund No.2 , Magellan Infrastructure Fund (Unhedged) , Magellan Core Infrastructure Fund , Magellan Global Opportunities Fund Active ETF (ASX:OPPT) Important Information: This material has been delivered to you by Magellan Asset Management Limited ABN 31 120 593 946 AFS Licence No. 304 301 trading as Magellan Investment Partners ('Magellan Investment Partners') and has been prepared for general information purposes only and must not be construed as investment advice or as an investment recommendation. This material does not take into account your investment objectives, financial situation or particular needs. This material does not constitute an offer or inducement to engage in an investment activity nor does it form part of any offer documentation, offer or invitation to purchase, sell or subscribe for interests in any type of investment product or service. You should obtain and consider the relevant Product Disclosure Statement ('PDS') and Target Market Determination ('TMD') and consider obtaining professional investment advice tailored to your specific circumstances before making a decision about whether to acquire, or continue to hold, the relevant financial product. A copy of the relevant PDS and TMD relating to a Magellan Investment Partners financial product may be obtained by calling +61 2 9235 4888 or by visiting www.magellaninvestmentpartners.com Past performance is not necessarily indicative of future results and no person guarantees the future performance of any financial product or service, the amount or timing of any return from it, that asset allocations will be met, that it will be able to implement its investment strategy or that its investment objectives will be achieved. This material may contain 'forward-looking statements'. Actual events or results or the actual performance of a Magellan Investment Partners financial product or service may differ materially from those reflected or contemplated in such forward-looking statements. This material may include data, research and other information from third party sources. No guarantee is made that such information is accurate, complete or timely and no warranty is given regarding results obtained from its use. This information is subject to change at any time and no person has any responsibility to update any of the information provided in this material. Statements contained in this material that are not historical facts are based on current expectations, estimates, projections, opinions and beliefs of Magellan Investment Partners or the third party responsible for making those statements (as relevant). Such statements involve known and unknown risks, uncertainties and other factors, and undue reliance should not be placed thereon. No representation or warranty is made with respect to the accuracy or completeness of any of the information contained in this material. Magellan Investment Partners will not be responsible or liable for any losses arising from your use or reliance upon any part of the information contained in this material. Any third-party trademarks contained herein are the property of their respective owners and Magellan Investment Partners claims no ownership in, nor any affiliation with, such trademarks. Any third-party trademarks contained herein are the property of their respective owners, are used for information purposes and only to identify the company names or brands of their respective owners, and no affiliation, sponsorship or endorsement should be inferred from such use. This material and the information contained within it may not be reproduced, or disclosed, in whole or in part, without the prior written consent of Magellan Investment Partners. (080825-#W17) |

30 Mar 2026 - Waymo has 70 Humans Running 3000 Vehicles

26 Mar 2026 - Becoming wary of software
|
Becoming wary of software Challenger Investment Management March 2026 (9-minute read) Many of you will have seen news over the past few weeks regarding the US Private Credit sector's exposure to software and flow on concerns regarding the impact of AI on the software businesses. Investor concerns have centred around those managers who are most exposed with most press articles focussed on Blue Owl Capital as amongst the largest players in the private credit market they have the highest exposure.
Turning to the domestic private credit market we think the following is important:
The constant challenge for investors which is especially true in this environment is that the assessment of the risk of a fund is not just about the assets, it's not just about the manager and not just about their governance practices. A major determinant of outcomes will be how other investors respond. This is a much tougher proposition for investors to assess - size and scale matters here, access to institutional capital, transparency and approach to governance. A private credit firm with one open ended fund, poor valuation discipline, external leverage and lack of scale is far more exposed than the alternative. Challenger IM Credit Income Fund , Challenger IM Multi-Sector Private Lending Fund For Adviser & Investors Only Disclaimer: This material has been prepared by Challenger Investment Partners Limited (Challenger Investment Management or Challenger), ABN 29 092 382 842, AFSL 329 828. This document does not relate to any financial or investment product or service and does not constitute or form part of any offer to sell, or any solicitation of any offer to subscribe or interests and the information provided is intended to be general in nature only. This should not form the basis of, or be relied upon for the purpose of, any investment decision. This document is not available to retail investors as defined under local laws. This document has been prepared without taking into account any person's objectives, financial situation or needs. Any person receiving the information in this document should consider the appropriateness of the information, in light of their own objectives, financial situation or needs before acting. This document is provided to you on the basis that it should not be relied upon for any purpose other than information and discussion. The document has not been independently verified. No reliance may be placed for any purpose on the document or its accuracy, fairness, correctness, or completeness. Neither Challenger Investment Management nor any of its related bodies corporates, associates and employees shall have any liability whatsoever (in negligence or otherwise) for any loss howsoever arising from any use of the document or otherwise in connection with the presentation. |

25 Mar 2026 - Emerging Markets: How AI concerns are impacting India
|
Emerging Markets: How AI concerns are impacting India Pendal March 2026 (5 minutes read time) |
|
Fears that rapid advances in artificial intelligence could slow global IT spending have weakened investor confidence in Indian software stocks. Pendal's Global Emerging Markets Opportunities team investigates the implications for India's growth and current account balance. THE explosion in capability of AI models in recent months has led some equity market participants to become more cautious about the outlook for various service sector industries, leading to selloffs in sectors from software to financial planning. As investors who approach the asset-class primarily through top-down, country-level developments, the GEMO team has been thinking about what this might mean for India. India is one of a group of emerging markets that tend to run current account deficits. "These are countries that have significant latent domestic demand but where, for various historical, geographical or institutional reasons, domestic production falls short. These markets tend to have higher beta to global liquidity and risk appetite," says James Syme, senior fund manager, JOHCM. "Most pertinently for India, the growth cycles of these countries tend to be constrained by inflation and external deficits, with both vulnerabilities reflecting demand running too far ahead of supply." Since the end of 2010, India's current account deficit has averaged 1.7 per cent of GDP, although the maximum deficit was 5.1 per cent of GDP. The structure of the current account balance has developed through time, and changed with India's economic cycle, but some components remain structurally important. In 2025, India ran a deficit in non-oil goods of US$189 billion (4.9 per cent of GDP). Net oil imports were US$122 billion (3.2 per cent of GDP). The resultant trade deficit of US$311 billion (8 per cent of GDP) was substantially offset by a net positive services balance of US$210 billion (5.4 per cent of GDP). Notably, the surplus in IT services was US$227 billion (5.9 per cent of GDP). India also ran a positive income balance of US$85 billion (2.2 per cent of GDP), for an overall current account deficit of US$17 billion (0.4 per cent of GDP). Syme says this relationship between IT service exports and oil imports is key for India's economy, and the two have grown together. In fiscal year 2019, net IT service exports were US$85 billion, and oil imports were US$93.9 billion. "The varying cycles in global IT service spending and the oil price are key for the health of the Indian economy," explains Syme. At a time of higher oil prices, what does the downturn in sentiment towards software and IT service stocks mean for India? In the first two months of 2026, the MSCI India IT Index has fallen over 20 per cent in USD terms. "This is concerning, because the aggregate revenue of India's listed IT companies has a high correlation with the economy's IT service exports," says Syme. If the negative outcome that stocks are pricing in comes to pass, particularly with higher oil prices, India's growth may be constrained by the current account balance. "However, it is important to note that the 12-month forward consensus estimates for both the revenues and profits of the constituents of MSCI India IT Index have increased by 3.4 per cent year to date," notes Syme. "This steady growth in the fundamental outlook for these companies suggests both opportunity in the sector, where we remain overweight, and ongoing support for the Indian economic growth story, although we remain underweight the country on valuation grounds. "We do not feel that share price moves alone constitute a macro-level signal for India at this time." |
|
Funds operated by this manager: Pendal MicroCap Opportunities Fund , Pendal Global Select Fund - Class R , Pendal Sustainable Australian Fixed Interest Fund - Class R , Pendal Focus Australian Share Fund , Pendal Horizon Sustainable Australian Share Fund , Regnan Credit Impact Trust Fund , Pendal Sustainable Australian Share Fund , Pendal Sustainable Balanced Fund - Class R , Pendal Multi-Asset Target Return Fund |
|
This information has been prepared by Pendal Fund Services Limited (PFSL) ABN 13 161 249 332, AFSL No 431426 and is current as at December 8, 2021. PFSL is the responsible entity and issuer of units in the Pendal Multi-Asset Target Return Fund (Fund) ARSN: 623 987 968. A product disclosure statement (PDS) is available for the Fund and can be obtained by calling 1300 346 821 or visiting www.pendalgroup.com. The Target Market Determination (TMD) for the Fund is available at www.pendalgroup.com/ddo. You should obtain and consider the PDS and the TMD before deciding whether to acquire, continue to hold or dispose of units in the Fund. An investment in the Fund or any of the funds referred to in this web page is subject to investment risk, including possible delays in repayment of withdrawal proceeds and loss of income and principal invested. This information is for general purposes only, should not be considered as a comprehensive statement on any matter and should not be relied upon as such. It has been prepared without taking into account any recipient's personal objectives, financial situation or needs. Because of this, recipients should, before acting on this information, consider its appropriateness having regard to their individual objectives, financial situation and needs. This information is not to be regarded as a securities recommendation. The information may contain material provided by third parties, is given in good faith and has been derived from sources believed to be accurate as at its issue date. While such material is published with necessary permission, and while all reasonable care has been taken to ensure that the information is complete and correct, to the maximum extent permitted by law neither PFSL nor any company in the Pendal group accepts any responsibility or liability for the accuracy or completeness of this information. Performance figures are calculated in accordance with the Financial Services Council (FSC) standards. Performance data (post-fee) assumes reinvestment of distributions and is calculated using exit prices, net of management costs. Performance data (pre-fee) is calculated by adding back management costs to the post-fee performance. Past performance is not a reliable indicator of future performance. Any projections are predictive only and should not be relied upon when making an investment decision or recommendation. Whilst we have used every effort to ensure that the assumptions on which the projections are based are reasonable, the projections may be based on incorrect assumptions or may not take into account known or unknown risks and uncertainties. The actual results may differ materially from these projections. For more information, please call Customer Relations on 1300 346 821 8am to 6pm (Sydney time) or visit our website www.pendalgroup.com |

24 Mar 2026 - Australian Secure Capital Fund - Property Update
|
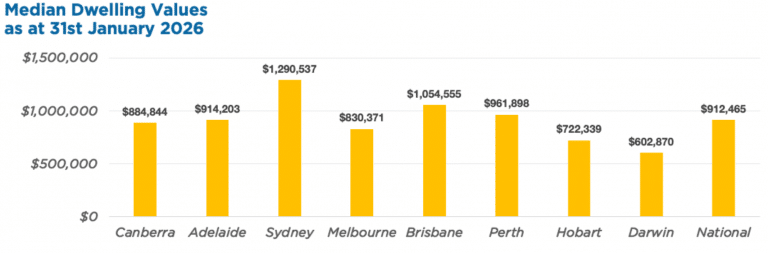
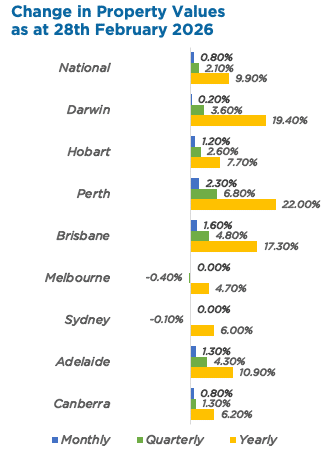
Australian Secure Capital Fund - Property Update Australian Secure Capital Fund March 2026 (1-minute read) February was another strong month for Australian property values, posting a national rise of 0.8% for the second consecutive month. Perth (+2.3%) again led the way with a second straight monthly rise of greater than 2%, adding more than $22,500 to the median dwelling value over the month. Similarly, Brisbane (+1.6%) and Adelaide (+1.3%) again saw monthly increases of greater than 1%. Conversely, values in Melbourne and Sydney were flat over February, with both cities notching slight rolling quarterly decreases of -0.4% and -0.1%, respectively. As a result, regional areas continue to outperform the capital cities, rising by 1.1% month-on-month, compared to 0.6% for the capitals. Nationally, rents increased 1.7% over the three months to February 2026, denoting the highest rolling quarterly increase since April 2025.
Source: Cotality HVI, 02 March 2026 February Edition Funds operated by this manager: ASCF Select Income Fund , ASCF High Yield Fund , ASCF Premium Capital Fund , ASCF Private Fund
|