
NEWS

17 Jun 2024 - Manager Insights | East Coast Capital Management
|
Chris Gosselin, CEO of FundMonitors.com, speaks with Richard Brennan, Strategy Ambassador at East Coast Capital Management. The ECCM Systematic Trend Fund has a track record of 4 years and 4 months. The fund has outperformed the Barclay Hedge Global Macro benchmark since inception in January 2020, providing investors with an annualised return of 17.34% compared with the benchmark's return of 7.75% over the same period.
|

13 Jun 2024 - Data Dependency and Fiscal Stimulus Complicate Inflation Fight
|
Data Dependency and Fiscal Stimulus Complicate Inflation Fight JCB Jamieson Coote Bonds May 2024 Financial markets have dealt with a large volume of economic data and communication from central bankers in recent weeks. Despite some overly sensationalised media coverage and short-term predictions, we believe that the central banks' messaging has remained consistent across jurisdictions. The US Federal Reserve (US Fed), the global leader in setting market trends, and the Reserves Bank of Australia (RBA) domestically, have both cautioned patience with monetary policy, as already restrictive settings continue to work through the system, lowering growth and demand whilst bringing inflation back towards target. This process is frustrating in the day to day, in that inflation data doesn't move in straight lines - seasonal factors, annual price increases, one-off adjustments, flash sales, and other variables create a bumpy, unpredictable, and somewhat volatile path. Even well-resourced teams of economists at major investment banks consistently get their estimations markedly wrong, reflecting the inherent volatility in this process. Take the latest CPI quarterly release in Australia, which was widely predicted to be 0.8%. When the actual figure came in at 0.96% (rounded up to 1.0%), the unexpected result triggered a significant market reaction, leading to the removal of any expectations of a rate cut from the RBA. What makes this even more galling for forecasters is that with a monthly inflation series, they already have about two thirds of the dataset before the quarterly figures are released. This makes forecasting errors even more surprising and exacerbates the market's reaction when a when a relatively small portion of new data has an outsized impact. This may be more detail than you require as you read this over your morning coffee. Of course, forecasting errors can also work in reverse, as we have seen some large undershoots versus expectation over time. Yet the sequencing of these dataset surprises drives market sentiment, and sadly, central bankers are now wedded to react to a 'data dependent' approach, risking falling behind the curve. The key takeaway here is that while inflation in Australia peaked at 7.8% in the fourth quarter of 2022, it has since steadily fallen to 7.0%, 6.0%, 5.4%, 4.1% and now 3.6% over the preceding quarters. This downward trend, though slightly slower than the RBA forecasts, has been the direction of travel for 18 months. The fight against inflation is not yet over, but it is well advanced, whilst the battle rages on under restrictive interest rate settings. The US economy, which has long been the 'exception' in a souring global macroeconomic story, has suddenly slowed significantly. Whilst the incoming numbers remain solid, they are markedly weaker than we had received previously, with a shock miss on components like GDP, the employment report (Non-Farm Payrolls), initial unemployment claims and a host of second-tier manufacturing and activity data. This has taken the US "economic surprise" index to a negative reading. Markets are now focused on how the interplay of slower growth will affect prices (and inflation) in the coming quarters, trying to calibrate the timing of central banks that have become unashamedly 'data dependent'. The significant failure of models used to calibrate policy through the COVID-19 period has made central bankers highly reactive, no longer willing to back their judgements on years of policy learnings and economic theory to move policy ahead of the cycle. Ordinarily, as growth slowed, central bank policy levers would already be in motion to address the slowdown and expected cooling inflation outcomes associated with weaker demand, acknowledging that policy works with long lag times. Now, as data dependency is 'policy de jour', the danger is that economies may slow more than necessary before central banks act to curb a downturn. This delay could lead to more severe corrective measures, as central banks struggle to address a substantial loss of economic momentum. We have heard various terms to describe economic trajectories, such as 'hard,' 'soft' and 'no' landing. If, like an aircraft, the economy hits stall speed, the pilots' attempts at recovery will be a lot more severe than if they'd simply eased up a little ahead of time. Central bankers are often criticized for waiting until ''something breaks'' before taking decisive action. This was evident during the Global Financial Crisis (GFC) over a decade ago when rates were held at similar levels to today until a catastrophic episode was unavoidable, prompting rates to be slashed by more than 5% to jump start economies and reverse the damage caused by overly restrictive rates from the pre-2008 period. With this concept in mind, our baseline position at the start of the year was that central bankers would aim for a non-stimulatory rate cutting cycle in the back half of 2024. This was expected to be led by Europe or the US, commencing around the middle of the year. Such a strategy could help smooth the economic cycle, offer some relief to consumers and borrowers, and ideally avoid the negative consequences of keeping rates too high for too long. That is still seemingly on track for Europe, with the European Central Bank (ECB) likely leading the way, followed by Canada, the UK and New Zealand. However, the expected timing for the US to lead the rate-cutting cycle has shifted further out. An interesting development is Sweden's Riksbank, which just leapfrogged the pack by cutting rates from 4.00% to 3.75%, whilst observing similar economic outcomes to our own domestic data, weak growth, deeply negative retail sales and cooling (though still above mandate) inflation. Perhaps some central bankers are still moving ahead of the curve. In the US, the trend has slightly reversed, with inflation moving from a low of 3.1% up to 3.5% over the last five months. Despite this uptick, the US Fed retained its easing bias and reduced the scope of its Quantitative Tightening program during its May meeting, helping solidify expectations around bond yields. A short covering rally followed thereafter, which all asset markets have enjoyed, lifting bonds and equities alike. From prior communications, the US Fed indicated its intent to cut rates, retaining an easing bias. However, the slight increase in inflation has complicated the process, delaying market expectations for rate cuts to later in the year. While monetary policy is fighting the good fight against inflation with restrictive policy settings, US fiscal policy remains highly stimulatory, with public spending running at around ~6% of GDP. Much of the economic growth in the US has been fueled by this large public sector spend, which has been exceptional against other jurisdictions and looks to continue in an election year. As a result, this continued fiscal stimulus could create some friction in achieving normalisation of inflation. The RBA has found that recent surprises in our own inflation were predominantly due to education and insurance, which we think has heavy seasonal annual reset, and is unlikely to be repeated in following quarters. Calling the near-term inflation pathways remains difficult. Plenty of things can work sequentially against further progress in the near term, like a stimulatory federal budget, larger fair work outcomes on minimum wages, geopolitical flare ups driving energy prices higher or global shipping disruptions to name a few. On the other hand, there are reasons for optimism. Oil prices are well off their highs despite recent geopolitical tensions involving Israel and Iran. Slowing economic activity has tempered discretionary spending, as evidenced by deeply negative retail sales. We've also seen declines or stabilisations in rent and used car prices. In the 10 years prior to COVID-19, Australia's average quarterly inflation rate was 0.52%. If we assume that the next few quarters are much higher at 0.8%, inflation could fall to 3.2% by the end of the third quarter, against the RBA estimate of 3.8% by year end. These contrasting forces create a complex landscape for policymakers, and while there is room for inflation to fall below the RBA's forecasts, data dependency will continue to drive monetary policy decisions. The uncertainty surrounding these various factors suggests that flexibility and careful analysis will remain critical as the RBA navigates the path ahead. Author: Charlie Jamieson, Chief Investment Officer Funds operated by this manager: CC Jamieson Coote Bonds Active Bond Fund (Class A), CC Jamieson Coote Bonds Dynamic Alpha Fund, CC Jamieson Coote Bonds Global Bond Fund (Class A - Hedged) |

12 Jun 2024 - Assessing the "rizz" of the private credit market
|
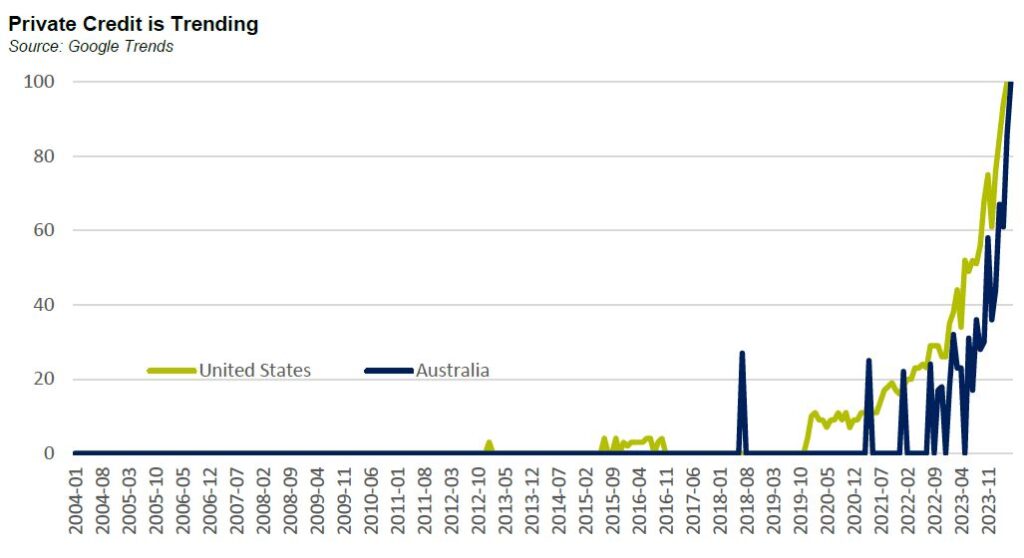
Assessing the "rizz" of the private credit market Challenger Investment Management May 2024 The Oxford Word of the Year 2023 was "rizz". An abbreviation of charisma it is used to refer to an individual who has a lot of style and is attractive to others, albeit not just in their appearance. As Dennis Denuto said in the classic Australian film, The Castle, "it's the vibe." Suffice to say that Dennis didn't have much "rizz" and neither do I, a point which was made clear to me by my kids when I tried to use "rizz" in a sentence. If you aren't a Gen Z-er but are a keen observer of financial markets, it would not be a surprise if your word of the year was "private credit". A quick Google Trends search shows the dramatic increase in interest in private credit that started in 2020 and ramped up considerably in 2022 and 2023. Notably Australia has lagged the United States with interest only peaking in late 2023.
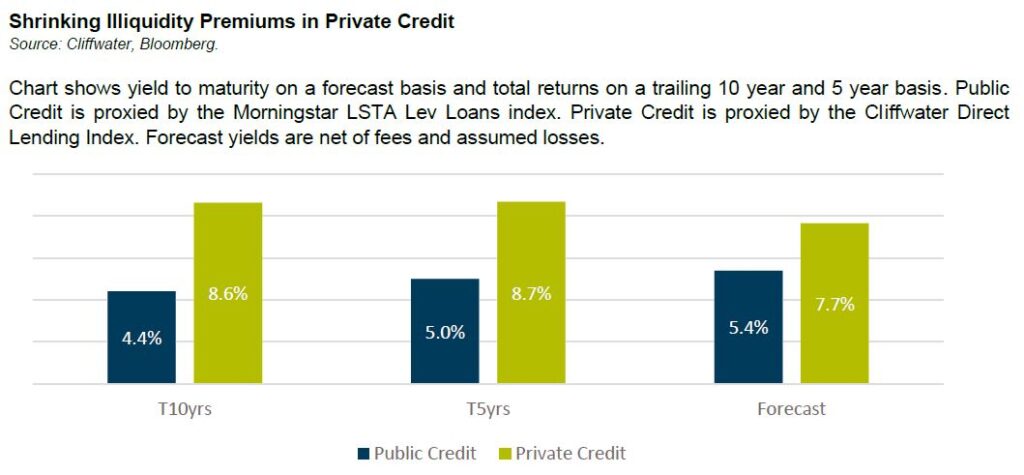
The level of interest in private credit inevitably raises the question of whether it has peaked. In the United States there have been a number of recent data points which suggest the private credit opportunity may not be what it once was. Firstly, funds raised by private credit funds slowed in the first quarter of 2024. According to Preqin, private debt managers raised US$30.6 billion in Q1 taking total funds under management to US$1.7 trillion. This is the lowest Q1 figure since 2018. Interest rates and inflation were the top two concerns for investors. The fourth quarter of 2023 was also slow with only US$42 billion raised, the slowest end to the year since 2018. The terms of the funds are typically 6-8 years and dry powder (capital raised but not yet invested) was estimated at US$400 billion in September 2023 implying there is still plenty of capital available even if fund raising continues to slow. Secondly, returns in private credit are moderating. With so much capital flowing into the sector it was inevitable that returns would slow. Cliffwater now expects a long term illiquidity premium (measured as the difference between the expected return on the CDLI index unleveraged after fees and losses to the return on the Morningstar LSTA Lev Loan index after losses) of 2.25% per annum. This compares to an excess return of 4.2% p.a. in the ten years prior.
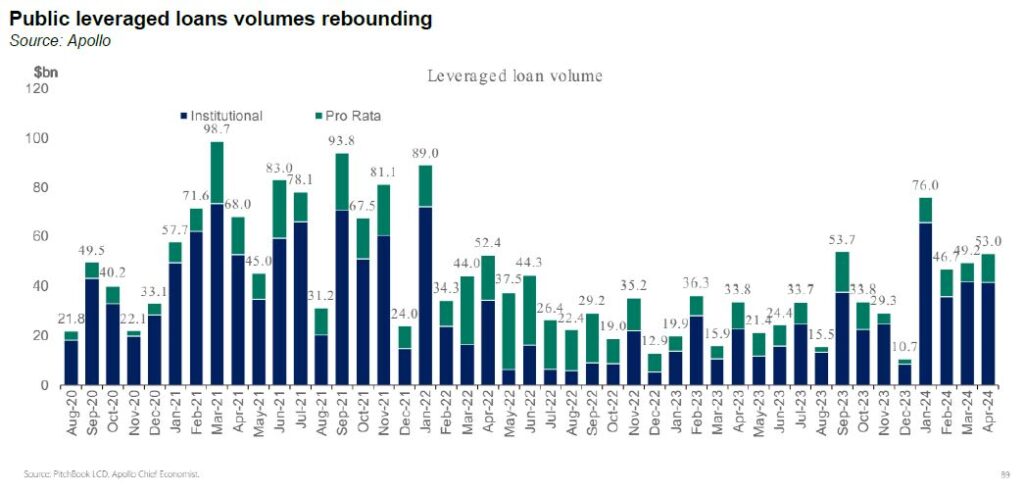
Thirdly, the growth of the private lending market might have outpaced the supply of private lending opportunities. In other words, we may have reached a point whereby private lenders are competing with public markets and banks for new deals. In 2023 private credit lenders provided a US$5.3 billion loan package to Finastra Group, refinancing existing syndicated debt raising the question of what the private lenders were providing that public markets couldn't. The sharp contraction in credit spreads seems to have reversed this trend in 2024. As shown below public leveraged loan issuance levels have picked up from 2022/23 levels. According to Pitchbook, in 2023 around US$20 billion in publicly syndicated loans was taken out by private direct loans. In 2024 through April, over US$13 billion of private direct loans have been refinanced by publicly syndicated loans.
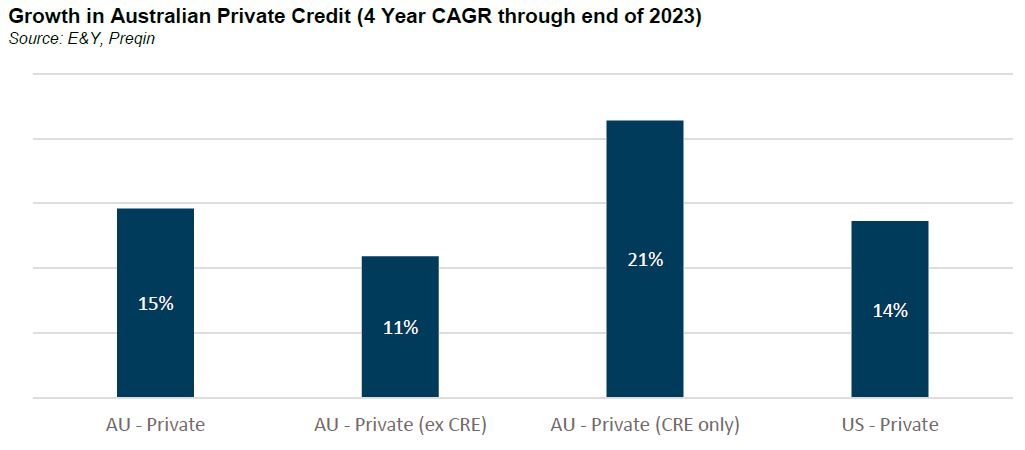
And in another important data point, Bloomberg reported in May that a large US private lender, HPS Investment Partners actually capped inflows into one of it funds to manage the imbalance between demand for private credit and the supply of opportunities. Of course, there are two interpretations of the supply argument. One is that public markets are lacking discipline and pricing risk too low. The other is that private lenders have become too large and are now competing directly with public markets rather than filling the gaps around them. Both are probably true to some extent. Our conclusion is that we have probably hit the peak in private credit in the United States. That's not to say that it is a poor investment now but perhaps not the slam dunk it was 5-10 years ago. An illiquidity premium of greater than 2% per annum is good, but maybe doesn't have the rizz it had a few years back. But how about Australia? Are we past the peak in Australian private credit? In assessing this question, the first thing to note is that until recently Australian private credit definitely didn't have the same amount of rizz as US private markets. This is consistent with the Google Trends data and the level of understanding from investors and advisors who had barely scratched the surface of these markets before COVID. Data on funds raised in Australian private credit markets is hard to come by but anecdotally there has been exponential growth the number of private credit managers claiming to be active in Australia. According to E&Y's annual survey the growth in Australian private credit has outpaced the growth US private credit markets but only if you include CRE debt as we show below.
So, growth in Australian private credit is really about growth in commercial real estate lending. Non-CRE lending has grown at a more moderate place which aligns with our lived experience. Australian markets are also less transparent than the United States when it comes to returns. Our anecdotal view is that illiquidity premiums were never as large in Australia as they were in the United States and haven't compressed nearly as much and we continue to guide investors to expect an excess return of around 2% per annum. Supply-wise the Australian market has never competed with public high yield markets for the simple reason that Australia has never had much of a public high yield bond market. In Australia, the main competition for private lenders is banks for whom non-financial corporate loan exposure growth slowed to around 6% in the 12 months to March 2024. Looking at major bank Pillar 3 disclosures it seems as though loan growth for sub-investment grade corporate credit exposure was around 8% over the past 12 months. This implies that banks were actively but not aggressively competing in corporate direct lending markets in Australia, consistent with our experience. So, while there may not be as much rizz in the US private lending opportunity, we think there is probably still some left in Australia. Indeed, if there is a credit cycle down under, the opportunity for alternative lenders to fill the gaps left by the banks could be significant, especially in non-CRE lending which has experienced less growth. Watch this space! Funds operated by this manager: Challenger IM Credit Income Fund, Challenger IM Multi-Sector Private Lending Fund For Adviser & Investors Only |
11 Jun 2024 - Manager Insights | Digital Asset Funds Management
|
Chris Gosselin, CEO of FundMonitors.com, interviews Dan Nicolaides on how Digital Asset Funds Management uses crypto market volatility for stable returns and risk management.
<
|

7 Jun 2024 - Three big questions facing ESG investors (and how to answer them)
|
Three big questions facing ESG investors (and how to answer them) Pendal May 2024 |
|
ESG can be pretty confusing for investors. The acronym (which stands for Environmental, Social and Governance issues) refers to a jargon-filled investment space which requires an understanding of regulations, methodologies and taxonomies. And the more ESG evolves, the more complicated it becomes for investors trying to judge the effect of these criteria on their investments. Why is ESG so confusing? How can you see through the noise? Much of the confusion about ESG stems from three questions facing investors. Here we'll try to explain them. 1. Are we looking at the same thing?Third-party ESG data providers often have different views and methodologies for rating different companies. That means ESG data requires more interpretation than, for example, balance sheets or credit ratings. Credit rating agencies may offer different ratings -- but they largely analyse the same numbers from financial statements. An ESG report can include absolutely everything that has an impact on the macro, meso and micro environmental, social and governance risks a company may face. There is also the overwhelming challenge of conflation. A fossil fuel extraction company may be managing its risks reasonably well -- but if investors don't want to invest in fossil fuels then it seems rather irrelevant. 2. Are you saying what I think you're saying?Everywhere we see advertisements aimed at convincing people that if they invest with a particular manager they'll be able to save the world. To combat this kind of hyperbole, regulators and gatekeepers have stepped in to reduce potentially misleading and deceptive conduct. This includes education for clients, longer caveats and attempts at standardising terms such as "sustainable investing". For investors, this means more surveys, greater reporting, a focus on data and ensuring proper systems are in place. Regulators are pushing for standard language and consistent data to help people understand what's being said. That's a positive step -- but more education, more disclosure and more reporting are not enough. People don't read every food label before eating. Now ESG is starting to be viewed less as a marketing problem and more as a compliance challenge. At Regnan, we continue to strongly believe that including ESG criteria in the investing process provides more information to make better investment decisions. 3. Does ESG actually affect investment decisions?Are ESG consideration linked to reality? Does it do what clients actually want? Do ESG funds outperform? You should be able to find ESG integration statements on most big asset manager websites which outline how they include ESG considerations in their decision making. Realistically, sometimes ESG considerations might have only a limited influence on an investment decision. But this differs across asset classes. For example, omitting energy stocks that gained significantly would've made outperformance difficult for some equity strategies over the past two years. But it would have had little impact on fixed income. How much ESG is included in investment decision-making is ultimately up to clients. Do you want to invest to make a more sustainable economy and potentially avoid some risks? Or is performance the only thing that matters? At the end of the day, fund managers, super funds and financial planners are all trying to serve the needs of their clients. What approach is best? It's about working out what ESG does for different clients. Some might hate anything that suggests companies need to consider the environment. Some might not want to make the world worse. Others may want to make the world a better place. These are values judgements. Here's a very simply way I explain ESG investing:
It's natural for clients to be apprehensive about ESG because it's a new topic full of technical words. But while there are definitely some parts that need more work, there are quite a few of us working on improvements. Author: Murray Ackman and Regnan |
|
Funds operated by this manager: Pendal Focus Australian Share Fund, Pendal Global Select Fund - Class R, Pendal Horizon Sustainable Australian Share Fund, Pendal MicroCap Opportunities Fund, Pendal Sustainable Australian Fixed Interest Fund - Class R, Regnan Global Equity Impact Solutions Fund - Class R, Regnan Credit Impact Trust Fund |
|
This information has been prepared by Pendal Fund Services Limited (PFSL) ABN 13 161 249 332, AFSL No 431426 and is current as at December 8, 2021. PFSL is the responsible entity and issuer of units in the Pendal Multi-Asset Target Return Fund (Fund) ARSN: 623 987 968. A product disclosure statement (PDS) is available for the Fund and can be obtained by calling 1300 346 821 or visiting www.pendalgroup.com. The Target Market Determination (TMD) for the Fund is available at www.pendalgroup.com/ddo. You should obtain and consider the PDS and the TMD before deciding whether to acquire, continue to hold or dispose of units in the Fund. An investment in the Fund or any of the funds referred to in this web page is subject to investment risk, including possible delays in repayment of withdrawal proceeds and loss of income and principal invested. This information is for general purposes only, should not be considered as a comprehensive statement on any matter and should not be relied upon as such. It has been prepared without taking into account any recipient's personal objectives, financial situation or needs. Because of this, recipients should, before acting on this information, consider its appropriateness having regard to their individual objectives, financial situation and needs. This information is not to be regarded as a securities recommendation. The information may contain material provided by third parties, is given in good faith and has been derived from sources believed to be accurate as at its issue date. While such material is published with necessary permission, and while all reasonable care has been taken to ensure that the information is complete and correct, to the maximum extent permitted by law neither PFSL nor any company in the Pendal group accepts any responsibility or liability for the accuracy or completeness of this information. Performance figures are calculated in accordance with the Financial Services Council (FSC) standards. Performance data (post-fee) assumes reinvestment of distributions and is calculated using exit prices, net of management costs. Performance data (pre-fee) is calculated by adding back management costs to the post-fee performance. Past performance is not a reliable indicator of future performance. Any projections are predictive only and should not be relied upon when making an investment decision or recommendation. Whilst we have used every effort to ensure that the assumptions on which the projections are based are reasonable, the projections may be based on incorrect assumptions or may not take into account known or unknown risks and uncertainties. The actual results may differ materially from these projections. For more information, please call Customer Relations on 1300 346 821 8am to 6pm (Sydney time) or visit our website www.pendalgroup.com |

6 Jun 2024 - When the Jimmy Choos don't fit
|
When the Jimmy Choos don't fit Redwheel April 2024 |
|
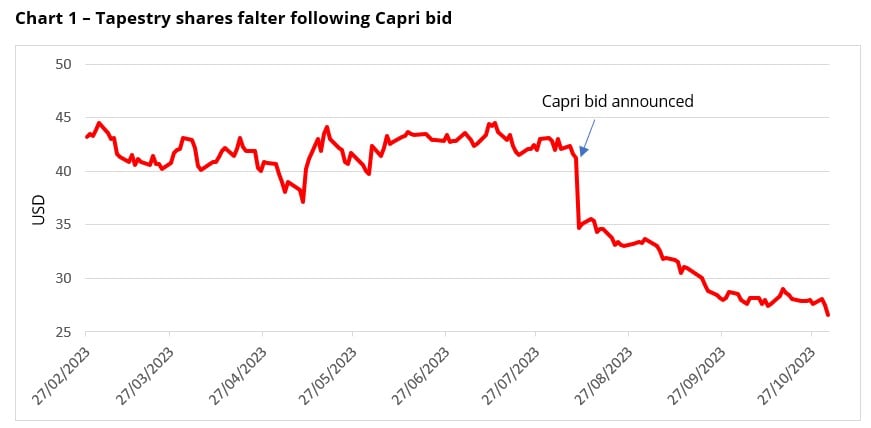
Mr Market's reaction to news can oscillate wildly, which is why it is important to remember to follow a process and not let emotions drive decision making. A case in point is Tapestry, the parent company of the Coach and Kate Spade fashion brands. When we invested in Tapestry our investment thesis centred around the majority of the business (Coach) continuing to trade well, whilst the smaller part (Kate Spade - around 20%) needed turning around. This put the idea firmly in our 'Profit Transformation' bucket, with a valuation that did not expect this turnaround to happen any time soon, and a decent balance sheet that made the investment attractive from a risk/reward perspective in our view, when the range of potential outcomes were considered. Then, on 10 August 2023, Tapestry announced its intention to buy Capri Holdings, parent company of Michael Kors, Versace, and Jimmy Choo. The mooted deal involves Tapestry paying $57 per share in cash (read: 'debt for Tapestry shareholders '). This led to a collapse in the share price of c.16% on the day, followed by a further fall of c.23% resulting in a total decline of c.35% in reaction to the announcement (See Bloomberg chart below).[1]
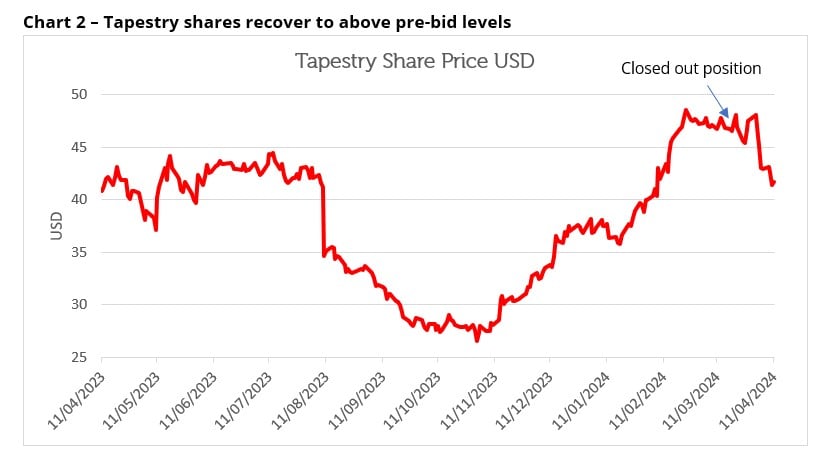
Source: Bloomberg as at 1st November 2023. The information shown above is for illustrative purposes. Past performance is not a guide to future results. Over this time emotions kick in, none of them joyous! The investment thesis was to be turned on its head, yet it was important to apply the process and not let emotions govern our response. In other words, apply our process to Capri, to understand the probability and range of outcomes for the new combined group. The result of this was a fan of outcomes that showed a meaningful shift in the risk reward of the Investment thesis. The company changes from originally 20% of the business needing turning around to comfortably over 50%, with the need to improve all three of Capri's brands - Michael Kors, Versace and Jimmy Choo. Although the turnaround of these brands is a well-trodden path of reducing the dependence upon wholesale channels and instead selling direct to consumers; the scale of change is from our point of view greater than normal, with for example c.30% of Michael Kors sales currently still wholesale (having been c.50% 10 years ago). For reference, best-in-class aspirational brands have c.10% of sales via wholesale.[2] Our lessons learnt from previous investments teach that the presence of debt usually removes the luxury of time for a company. This deal could raise Tapestry's debt to c.5x EBITDA, meaning that not only are they taking on a large turnaround, representing the majority of the business; they will also have to be successful quickly because of the need to reduce the debt. This further increases the risk.[3] The second lesson learnt is that increased debt can hurt a company's ability to sustain a dividend through difficult periods if anything goes wrong. In this scenario, it becomes increasingly likely a company is forced to cut the dividend to appease debt holders. This further increases the risk again. Finally, another lesson learnt is that the longer it takes to complete the deal, the greater the probability that the assets acquired are worse off than first thought. The deal for Capri is on track to take almost a year to close. Further increase in risk again. Thus, we believe the valuation of the potential combined group has shifted to less favourable. However, until the deal completes, a window opened up whereby Coach (and Kate Spade) as stand-alone businesses were trading far cheaper than before the share price fall. This introduced the risk of a counter bid - if anyone desired Coach as a brand this was the time to act. And then Mr Market changed his response completely, to march the shares up around 82% from the 1 November low to the 28 February 2024 high - higher than before the bid announcement! (See Bloomberg chart below).[4]
Source: Bloomberg, at 11 April 2024 . The information shown above is for illustrative purposes. Past performance is not a guide to future results. What has actually changed to justify this recovery? There is little evidence to suggest the deal is not still to happen. Certainly, Tapestry has continued to report good numbers, but Capri certainly hasn't. So, does this create a great opportunity, the worst Capri trades, the greater the turnaround potential? Emotions change, largely influenced by the behaviour of the share price! Long gone is the misery of November. The discipline of our process again helps to protect us against the wider emotion of the market. We believe the recovery in the Tapestry share price has only made the risk and reward ratio further skewed against investors and removed the counter bid risk. So even though Mr Market's emotions have changed as quickly as tastes in fashion, and now believes the Jimmy Choos will fit just perfect, our disciplines not emotions have led us to ditch the Choos and exit Tapestry. Author: Nick Clay |
|
Funds operated by this manager: Redwheel China Equity Fund, Redwheel Global Emerging Markets Fund |
|
Sources: [1] Bloomberg as at 1st November 2023 [2] Capri company report and accounts, 31st December 2023 [3]Redwheel as at 25.03.24 [4] Bloomberg as at 25.03.24 Key Information |

5 Jun 2024 - Is PFAS the next asbestos
|
Is PFAS the next asbestos Tyndall Asset Management May 2024 Man-made hazardous byproducts have long been an issue for our health and the environment. Many people understand the deadly impact of products such as asbestos, a once common material in many building products. In addition to the devastating health impacts of asbestos, the financial impacts have been nothing short of astronomical. It is estimated by the World Health Organisation that the annual financial cost of the health effects from asbestos is around US$2.4-3.9bn, excluding the additional costs of pain, suffering and welfare losses. The emerging risks of 'forever' chemicals and a little Australian company trying to make a differenceDrawing parallels to the asbestos industry, our research on per- and poly-fluoroalkyl substances (PFAS) indicates that the risk with PFAS can potentially be just as great as the now well-understood risk with asbestos. PFAS are a group of over 4,000 man-made chemicals that have been used in a variety of industries and consumer products due to their unique properties. Given their stain and water-resistant properties, PFAS is most commonly found in clothing, cookware and fire-fighting foam. Despite the obvious appeal of non-stick and water and grease-resistant properties, the production and use of PFAS have led to widespread environmental contamination and raised significant concerns about their potential risks to human health. PFAS has been described as "forever chemicals" because they do not degrade naturally in the environment. Studies on laboratory animals have shown the adverse effects of chronic PFAS exposure on the liver, gastrointestinal tract, and thyroid hormones. While studies of the impact of PFAS on humans have been more limited, the link between PFAS and a variety of health problems (e.g. liver, immune system damage and some cancers) has been strong enough for the USA's Environmental Protection Agency to propose strict limits on two types of common PFAS, namely Perfluorooctanoic acid and Perfluorooctane sulfonate. In addition, the European Union's Restriction of Hazardous Substances Directive restricts the use of certain PFAS, and similar regulations are either being considered or implemented worldwide. Given the heightened scrutiny around the adverse impacts of PFAS on human health, 3M, a Fortune 500 chemicals manufacturer based in the US, has recently announced a US$10.3bn settlement with the US Public Water Suppliers. The settlement is to help fund the monitoring and treatment or filtering of drinking water for a large portion of the US population that is currently exposed to high PFAS levels within their potable water. This settlement follows the US$1.18bn settlement in June 2023 between DuPont de Nemours Inc, Chemours Co, and Corteva Inc and a group of 300 drinking water providers in the US over the treatment of PFAS in drinking water. With growing scientific evidence highlighting the dangers of PFAS exposure, the implicit admission of PFAS manufacturers to the harm posed by PFAS and the need for both treatments and finding a solution is becoming increasingly critical. The Environmental Group and its role in addressing PFASThe Environmental Group (ASX: EGL) is an Australian environmental engineering company that provides products and engineering services to industries to improve environmental outcomes. This includes providing solutions such as dust extraction systems, odour capturing solutions, and noise abatement solutions. The business has been in operation for almost 100 years, servicing a diverse group of customers, from resource companies to manufacturers, waste management companies and healthcare operators. Key products include exhaust silencers, industrial steam boilers, medical waste autoclaves, and dry and wet scrubbers. Over the past five years, through the establishment of its Water division, EGL has looked to expand its capabilities into water management solutions and, in particular, the treatment of PFAS in water and soil. As part of this process, for the past three years, EGL has been working with Victoria University to develop technology focused on the removal of PFAS from contaminated waste streams. As a result of this collaboration, EGL has developed a gas foam fractionation process to treat the presence of PFAS in water, soils and biosolids. In its simplest explanation, gas foam fractionation involves bubbling gases through the contaminated material, which in turn lifts the PFAS particles to the top of the surface, with the PFAS material removed by gently vacuuming the particles. Successful trials have been conducted, demonstrating that the treatment reduced PFAS to undetectable levels. Trial study results published by EGL indicate that the process was able to extract 99.9% of PFAS from a sample of highly contaminated leachate processed (first pass), and 99.94% of PFAS from a sample of highly contaminated wash water (first pass). As the PFAS is separated and compacted to just 1% of the initial volume, the storage of PFAS becomes less of an issue, reducing facility, operational and risk costs. In addition, the processing unit does not require human interaction, with the unit being operated from a control station. This reduces the OH&S risk by minimising employee interaction with contaminated materials. EGL's gas foam fractionation process received patent approval in May 2023, with a 20-year patent timeframe. The company has an operational plant in Melbourne, with all documentation having been submitted to the Environmental Protection Agency to obtain the required licence to start operations. EGL expects approval to be granted in the next 3-6 months, which could be a catalyst for the company to expedite the roll out of this offering. EGL estimates that the total addressable market for this product is in the billions of dollars globally, which appears to be a reasonable estimate given the extent of PFAS contamination, and the settlements so far from PFAS manufacturers. The Tyndall Small Companies Fund is an investor in EGL, recognising that the company possesses many of the attributes that we look for in an investment. EGL is a business that has been listed for over 30 years with proven technology. One key issue was that the company was formally run by engineers, with little financial acumen to extract value from the technology. Enter current CEO Jason Dixon in Feb-2021, a highly regarded executive with extensive waste management experience, having run and developed Tox Free for a decade before it was acquired by Cleanaway. We can readily see what capable management can do to a business's financials. In 30 years of listed life, EGL barely made a profit. In a little over three years, Jason and his team have been able to take the business from a $34m revenue, $1.4m EBITDA enterprise to an FY24 estimated $99m revenue and $10m EBITDA business. Another attribute we like is the industry structure EGL operates in, with structural tailwinds for environmental waste management. Trading on 9-times EV/EBITDA, the business is trading on a reasonable valuation and screens as very cheap assuming it continues to execute as it has done in the past three years, delivering +20% p.a. revenue and earnings growth in its core business. While the PFAS problem has the potential to be detrimental to the scale of disasters such as asbestos, in The Environmental Group, we believe we have found a company that can potentially deliver a solution that helps address a significant portion of the problem. That said, our investment thesis in The Environmental Group is not predicated on the success of the Water Management/PFAS solution. The PFAS opportunity to us is free optionality and one with a very large potential upside. In our view, backing current management to execute their plans is an extremely attractive risk reward proposition, while also delivering a solution to a global problem that has had devastating health and environmental impacts. Author: James Nguyen, Portfolio Manager Funds operated by this manager: Tyndall Australian Share Concentrated Fund, Tyndall Australian Share Income Fund, Tyndall Australian Share Wholesale Fund |

4 Jun 2024 - Innovations shaping the global healthcare universe
|
Innovations shaping the global healthcare universe Magellan Asset Management May 2024 |
|
The healthcare sector is in a state of constant evolution, and with the COVID-19 pandemic behind us and an upcoming US election, what impacts could we see in the sector? Investment Analyst, Wilson Nghe sheds light on the dynamics that could play out from the US elections, how the healthcare system has transformed since the pandemic and highlights the opportunities and challenges that investors need to watch out for. |
|
Funds operated by this manager: Magellan Global Fund (Hedged), Magellan Global Fund (Open Class Units) ASX:MGOC, Magellan High Conviction Fund, Magellan Infrastructure Fund, Magellan Infrastructure Fund (Unhedged), MFG Core Infrastructure Fund, Magellan Core ESG Fund Important Information: This material has been delivered to you by Magellan Asset Management Limited ABN 31 120 593 946 AFS Licence No. 304 301 ('Magellan') and has been prepared for general information purposes only and must not be construed as investment advice or as an investment recommendation. This material does not take into account your investment objectives, financial situation or particular needs. This material does not constitute an offer or inducement to engage in an investment activity nor does it form part of any offer documentation, offer or invitation to purchase, sell or subscribe for interests in any type of investment product or service. You should obtain and consider the relevant Product Disclosure Statement ('PDS') and Target Market Determination ('TMD') and consider obtaining professional investment advice tailored to your specific circumstances before making a decision about whether to acquire, or continue to hold, the relevant financial product. A copy of the relevant PDS and TMD relating to a Magellan financial product may be obtained by calling +61 2 9235 4888 or by visiting www.magellangroup.com.au. Past performance is not necessarily indicative of future results and no person guarantees the future performance of any financial product or service, the amount or timing of any return from it, that asset allocations will be met, that it will be able to implement its investment strategy or that its investment objectives will be achieved. This material may contain 'forward-looking statements'. Actual events or results or the actual performance of a Magellan financial product or service may differ materially from those reflected or contemplated in such forward-looking statements. This material may include data, research and other information from third party sources. Magellan makes no guarantee that such information is accurate, complete or timely and does not provide any warranties regarding results obtained from its use. This information is subject to change at any time and no person has any responsibility to update any of the information provided in this material. Statements contained in this material that are not historical facts are based on current expectations, estimates, projections, opinions and beliefs of Magellan. Such statements involve known and unknown risks, uncertainties and other factors, and undue reliance should not be placed thereon. No representation or warranty is made with respect to the accuracy or completeness of any of the information contained in this material. Magellan will not be responsible or liable for any losses arising from your use or reliance upon any part of the information contained in this material. Any third party trademarks contained herein are the property of their respective owners and Magellan claims no ownership in, nor any affiliation with, such trademarks. Any third party trademarks that appear in this material are used for information purposes and only to identify the company names or brands of their respective owners. No affiliation, sponsorship or endorsement should be inferred from the use of these trademarks. This material and the information contained within it may not be reproduced, or disclosed, in whole or in part, without the prior written consent of Magellan. |

4 Jun 2024 - Australian Secure Capital Fund - Market Update
|
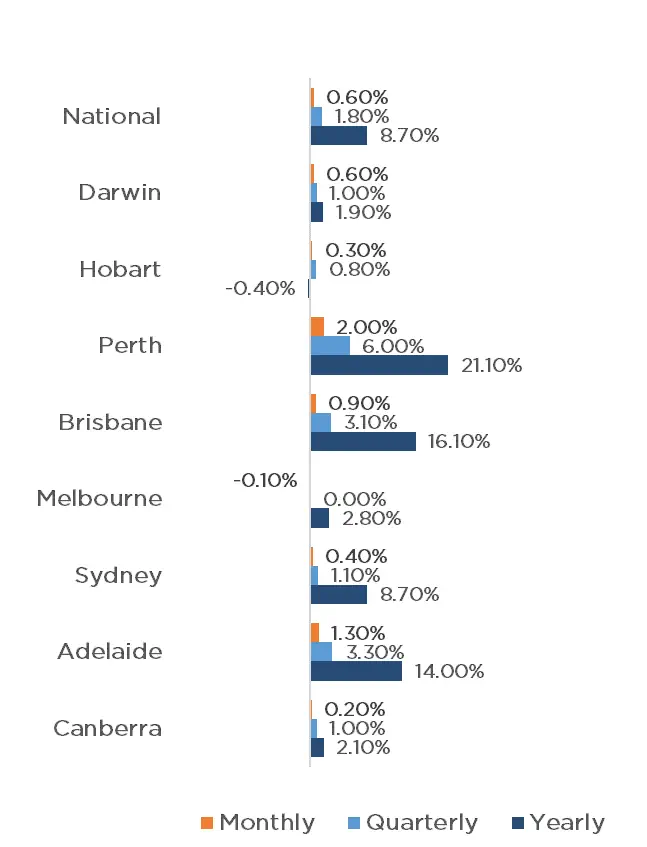
Australian Secure Capital Fund - Market Update Australian Secure Capital Fund May 2024 National property values continue to perform strongly, with CoreLogic's National Home Value Index recording another 0.6% increase in April, the same which was achieved in February and March, resulting in 15 months of continuous monthly growth. Yet again, Perth performed the strongest, increasing by a whopping 2.0% for the month, with Adelaide and Brisbane again achieving the second and third largest growth with 1.3% and 0.9% respectively. Darwin, Sydney, Hobart and Canberra also experienced growth with 0.6%, 0.4%, 0.3% and 0.2% respectively, whilst Melbourne recorded a slight reduction of 0.1%. This raised the quarterly national growth rate to 1.8%, with combined capitals increasing by 1.7% and the combined regions by 2.1%. The RBA meeting on the 7th of May indicated that we may experience higher interest rates for longer than anticipated, and has not ruled out a further increase in rates, however inflation is beginning to fall, albeit at a slightly slower pace than forecasted. However, with the fundamental undersupply of property, we anticipate the property market to remain strong throughout 2024. Clearance Rates & Auctions week of 29th of April 2024
Property Values as at 1st of May 2024
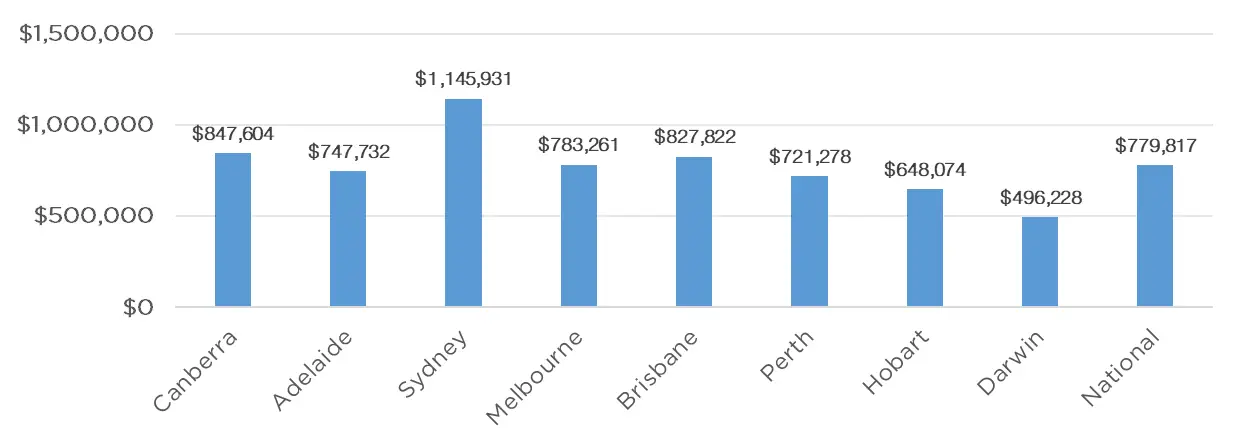
Median Dwelling Values as at 1st of May 2024
Quick InsightsThe Foreign Housing FightIn his budget reply speech, Mr Dutton said he would put a two-year ban on foreign investors and temporary residents purchasing homes in Australia if the Opposition won the next federal election. Ms Tu of "luxury property concierge" firm Black Diamondz, said that, contrary to the perception that foreign buyers were taking housing away from Australians, they injected money into the economy which has helped fund infrastructure and commercial development. We expect this debate to continue until the next election. Source: Australian Financial Review Australia's Race to LoseThere is no doubt that red tape at all levels of government continues to exacerbate the housing shortfall in Australia, with other comparable countries doing a far better job. Victoria and NSW are experiencing the longest average development approval wait times at 144 and 114 days respectively, according to new research by the federal Treasury. Source: Australian Financial Review Author: Filippo Sciacca, Director - Investor Relations, Asset Management and Compliance Funds operated by this manager: ASCF High Yield Fund, ASCF Premium Capital Fund, ASCF Select Income Fund |
3 Jun 2024 - Manager Insights | Skerryvore Asset Management
|
Chris Gosselin, CEO of FundMonitors.com, speaks with Glen Finegan, Lead Portfolio Manager at Skerryvore Asset Management. In this wide ranging interview Glen explains the fund's Emerging Market strategy, and what drives a company's selection in the portfolio.
<
|