
NEWS

What investors need to know about the technology reshaping the global economy. (15-minute read)
24 Apr 2026 - Artificial Intelligence: The Rise of Agentic AI
|
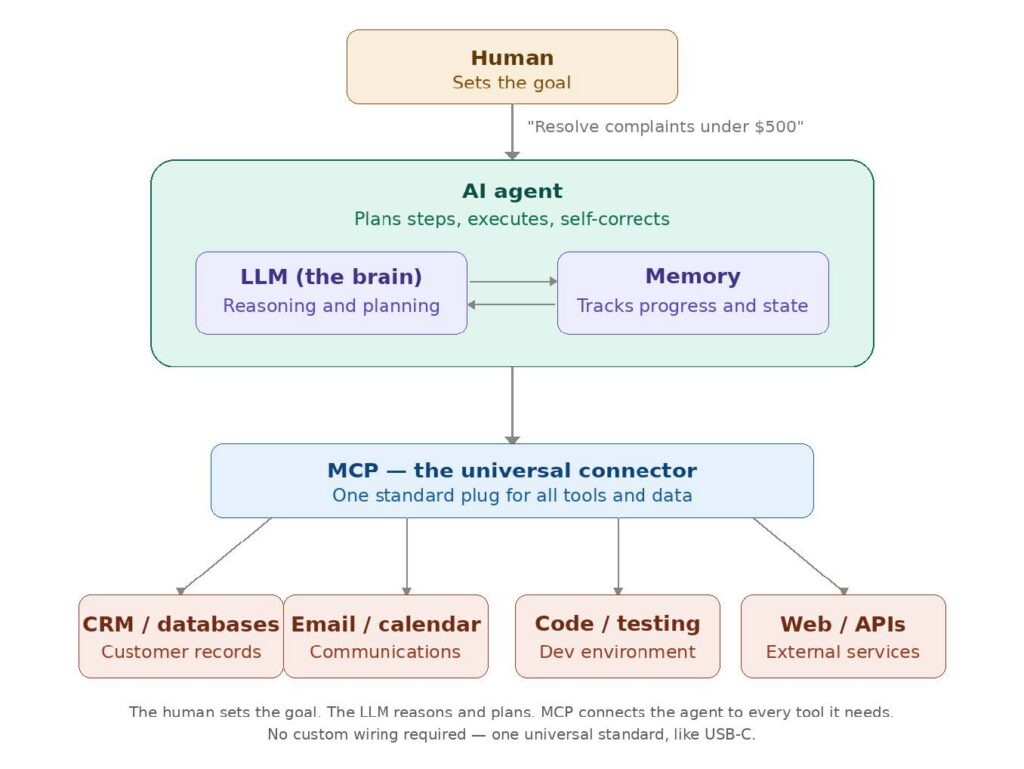
Artificial Intelligence: The Rise of Agentic AI Ox Capital (Fidante Partners) March 2026 (15-minute read) 1. What is Agentic AI?For the past two years, most people have experienced artificial intelligence as a chatbot. You type a question, it answers. Then it sits there, cursor blinking, waiting for your next instruction. This model--sometimes called co-pilot AI--is useful, but fundamentally passive. It is a clever assistant that never takes initiative. How It Works Under the HoodThree innovations have converged to make this possible.
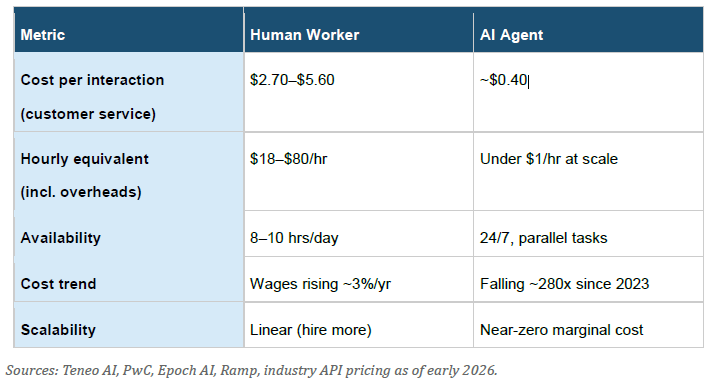
Where Things Stand TodayThe industry crossed a "chasm" in late 2025. The landmark event was the launch of the latest update of Claude Code from Anthropic. Claude Code was then capable of compressing a year's development work into hours or days, according to one of its senior software engineers. In early 2026, NVIDIA reported 64 per cent of organisations actively deploying AI in operations, with a vast majority seeing productivity gains. PwC found 79 per cent of 300 company executives they surveyed in 2025 were already leveraging agentic AI, with two-thirds reporting measurable productivity improvements. 2. What Agents Can Do: Real Examples, Real ResultsTools like Claude Code, OpenAI Codex, and Cursor now build entire software features autonomously. A developer provides a specification (prompt), such as to "Build a secure login system with encrypted tokens and full test coverage", and the agent will then design the architecture, write codes across multiple files, generate tests, fix what breaks, and submit the finished product. A task that would take two days previously can now be delivered in minutes. The Cost Equation
The unit cost of running AI, measured in tokens, has plummeted. In 2022, a million tokens cost around US$20. By late 2025, tokens from lightweight models hit US$0.15, a 99% decline. Three forces are driving down the cost of tokens:
A basic coding assistant like GitHub Copilot costs just US$10 per month which is trivial relative to a developer's salary, yet capable of making developers far more productive. Noticeably, full agentic coding tools cost as little as US$20 per month. Every quarter, agents get smarter and cheaper. For high-wage, services-heavy economies, the incentive to deploy agents is acute. 3. Why Agentic--Not Co-Pilot--Is the Killer AppA co-pilot is like a knowledgeable colleague helping us. We ask, they answer, then stop and wait. We still manage the workflow, decide what's next, copy information between systems. The human is the engine; the co-pilot is a mere productivity boost. 4. Broader Implicationsi. Why Coding Is Just the BeginningThe fact that coding is verifiable makes it the first area in which agentic AI has made an impact. An agent writes a program, runs tests, and gets an instant pass-or-fail verdict, the perfect training loop for RLVR. ii. Software Industry: Moats Under SiegeFor two decades, SaaS companies bill their customers based on number of seats per month. The economic moats were strong as they are around user habits, interface design and data lock-in. Part of the economic moats is a result of switching costs of user habit and interface familiarity. iii. Workforce Reorganisation: Unpredictable Ripple EffectsIf agents absorb entire job functions, corporate structure changes fundamentally. The future may be one of skilled humans orchestrating specialised AI agent teams! ConclusionAgentic AI is not another incremental software upgrade. It is a structural shift in how economic output is produced, from that of humans using tools to humans directing autonomous systems that execute work on their behalf. Funds operated by this manager:
Important Information: This material has been prepared by Ox Capital Management Pty Ltd (Ox Cap) (ABN 60 648 887 914) Ox Cap is the holder of an Australian financial services license AFSL 533828 and is regulated under the laws of Australia. This document does not relate to any financial or investment product or service and does not constitute or form part of any offer to sell, or any solicitation of any offer to subscribe or interests and the information provided is intended to be general in nature only. This should not form the basis of, or be relied upon for the purpose of, any investment decision. This document is not available to retail investors as defined under local laws. This document has been prepared without taking into account any person's objectives, financial situation or needs. Any person receiving the information in this document should consider the appropriaten |

23 Apr 2026 - AI: The New Frontier for the 'Just' Transition

22 Apr 2026 - Netflix: Navigating deals, AI and growth

US and Israel launched air strikes at Iran) dominated
headlines, causing heightened volatility and pressure upon
global equity markets. (2-minute read)
21 Apr 2026 - Glenmore Asset Management - Market Commentary
|
Market Commentary - March Glenmore Asset Management April 2026 (2-minute read) The war in Iran (which commenced in late February when the US and Israel launched air strikes at Iran) dominated headlines, causing heightened volatility and pressure upon global equity markets. The ASX All Ordinaries Accumulation Index suffered its sharpest decline in nearly 4 years, falling - 7.3%. The ASX Small Ordinaries Accumulation Index was hit harder, declining -11.0%. From a sector perspective, Energy was easily the top performer (+19.2%), whilst Defensive sectors such as Utilities (+4.9%), Consumer Staples (+2.8%) Telecom (+2.5%) also fared relatively well. The hardest hit sectors included Gold (-23.4%) and Technology (-12.9%) as investor risk aversion increased. US markets held up relatively well compared to their international counterparts, with the S&P 500 and NASDAQ falling -5.1% and -4.8% during the month, respectively. The outperformance vs the ASX and other major indices such as the Euro Stoxx 50 (-9.3%) and FTSE 100 (-6.7%) may reflect the US' greater energy resilience and the perceived status of the US dollar as a safe-haven asset. Whilst the volatility in recent months is clearly difficult emotionally, we would emphasise the importance of taking a long-term view. We continue to focus on the underlying business performance of the companies in our portfolio, as opposed to stock price movements. The recent declines in a wide range of stocks has created some excellent investment opportunities which we expect to drive returns over the next few years. In bond markets, the US 10-year bond yield recorded a sharp increase, rising +38 basis points (bp) to 4.32%, as similar to the US dollar, it was sought by investors as a safe-haven asset amidst the ongoing conflict in Iran. Its Australian counterpart also rose sharply, recording a +32 basis point increase to 4.97%. The Australian dollar fell -3.1% to US$0.69, implying a decline of 2.1 cents. Funds operated by this manager: |

20 Apr 2026 - Quarterly State of Trend report - Q1 2026
|
Quarterly State of Trend report - Q1 2026 East Coast Capital Management April 2026 3-minute read In this update, we present the quarterly State of Trend report for Q1, 2026. Our report covers the performance of trend following systems compared with traditional investments such as the S&P/ASX 200 Total Return index, and the Australia "60/40" portfolio. Trend following provides exposure to a diverse pool of underlying instruments, and implements trading strategies systematically and without emotional biases. Trend following outperforms Australian traditional assets In Q1 2026, traditional risk assets delivered negative returns, with the ASX200 and a 60/40 portfolio both finishing the quarter in the red amid escalating geopolitical risk and a sharp energy shock. Trend-following systems delivered strong positive returns, benefitting from equities and metals in the first two months of the quarter, and from the energy surge in March. Key market movements in Q1 2026
Featured chart - Crude Oil
See the full report at our website. Funds operated by this manager: |

16 Apr 2026 - Powering transition: critical minerals are central to the next era
|
Powering transition: critical minerals are central to the next era abrdn March 2026 (4-minute read) Global energy consumption is accelerating. It's being driven by power-hungry artificial intelligence (AI) development, the rise of robotics and automation, and the electrification of transport and industry. At the same time, the energy transition is intensifying investment in renewable power, alongside the need for significant grid building and modernisation. These trends are highly dependent on a relatively small group of minerals -- including copper, aluminium and rare earth elements -- which are essential for electric vehicles, batteries, semiconductors and renewable infrastructure. Demand for these critical materials is rising, while supply remains constrained... Demand for these critical materials is rising, while supply remains constrained because of long project lead times and limited new capacity. This imbalance may provide sustained pricing support and attractive long-term investment opportunities. Our Future Minerals strategy invests in global companies that are positioned at the forefront of this transition -- both within the extraction industry and across the wider minerals value chain. What differentiates our Future Minerals approach?A key differentiator of our strategy is our quality-led, ESG (environmental, social and governance)-integrated approach. From an initial universe of around 1,500 companies, inclusion requires at least 20% revenue exposure to the future minerals theme, alongside robust quality and ESG credentials. Companies must pass ESG screens, with a preference for strong governance, environmental practices and risk management. This helps to mitigate tail risks in a complex and often volatile sector. The portfolio invests across four core areas:
This structure provides diversified exposure across the full minerals ecosystem, rather than reliance on pure-play miners alone. OpportunitiesIn a concentrated global-equity market, the portfolio offers diversification through low US exposure and minimal exposure to technology -- two areas that dominate global indices. Structural demand drivers are also becoming more visible. Electrification, renewable energy deployment, grid upgrades and rapid AI adoption are increasing global energy intensity. Copper is central to this demand. Pathways to greater energy securityThe ongoing conflict in the Middle East underscores the strategic importance of critical minerals, reinforcing the case for electrification and renewable energy as key pathways to greater energy security and reduced reliance on oil and third-party energy sources. Data centre energy demand to soarData centres currently account for around 3% of US energy consumption, a figure projected to increase to around 12% by 2030 (McKinsey, 2024). Meeting this demand reinforces the need for both clean energy infrastructure and the minerals required to build it. Ex-China beneficiaries to emerge?Many critical materials, including rare earths, remain highly concentrated in China. Efforts by the US and EU to diversify supply chains are accelerating, which creates opportunities in regions that are trying to de-risk their mineral value chains. MP Materials, the top contributor in 2025, illustrates this trend, and we expect further ex-China beneficiaries to emerge during 2026. While commodity markets can be volatile and short-term cyclicality is to be expected, we believe the long-term fundamentals of the asset class remain structurally attractive and that the strategy is well-positioned to capture opportunities in 2026 and beyond. Key sectors in the portfolioCopperCopper is the poster child of critical minerals. It's a key theme within the portfolio, with around 30% exposure. It's fundamental to electrification and has no practical substitute as an electricity conductor. Following a 44% rise in the London Metal Exchange's spot price in 2025, demand resilience will be tested in 2026. However, copper's relatively low cost within end-use applications suggests higher prices can be absorbed without affecting demand. Supply remains constrained because of disruption at major producers and long project lead times, while merger and acquisition activity highlights the strategic value of high-quality assets. We expect these supply challenges to keep the market tight well into 2026. UraniumUranium is benefiting from a global renaissance in nuclear energy. In 2025, Western governments reaffirmed nuclear power as a core pillar of energy security and decarbonisation. China continues its nuclear expansion at full speed. Inventories have been drawn down over the past decade, mining activity has lagged demand, and supply remains highly concentrated. With uranium accounting for less than 10% of nuclear operating costs, demand elasticity is extremely low. Against this backdrop, we see 2026 as a potential inflection point for the uranium market. The strategy has around 8% exposure to uranium. This includes a holding in Kazatomprom, the world's largest and lowest-cost producer, which also benefits from comparatively strong environmental credentials given its in-situ recovery extraction methods. Outlook for 2026Despite heightened geopolitical uncertainty, commodity markets performed strongly in 2025. We think this momentum will extend into 2026. A broad rotation away from software and growth�'heavy assets towards hard assets and materials supports our position. The portfolio currently has around 75% exposure to mining companies -- an area where investors remain structurally underweight, with basic materials accounting for just 3.8% of the MSCI All Countries World Index (Morningstar, 31 January 2026). |
|
Funds operated by this manager: abrdn Sustainable Asian Opportunities Fund , abrdn Emerging Markets Equity Fund , abrdn Sustainable International Equities Fund , abrdn Global Corporate Bond Fund (Class A) |

15 Apr 2026 - Back to normality: How to adapt as volatility re-emerges

14 Apr 2026 - I Went to China's Robotics Hub - What I Saw Changed My View on the U.S. vs China Race
13 Apr 2026 - Infrastructure in focus: Turning on the capex tap
|
Infrastructure in focus: Turning on the capex tap Magellan Investment Partners March 2026 (3-minute read) |
|
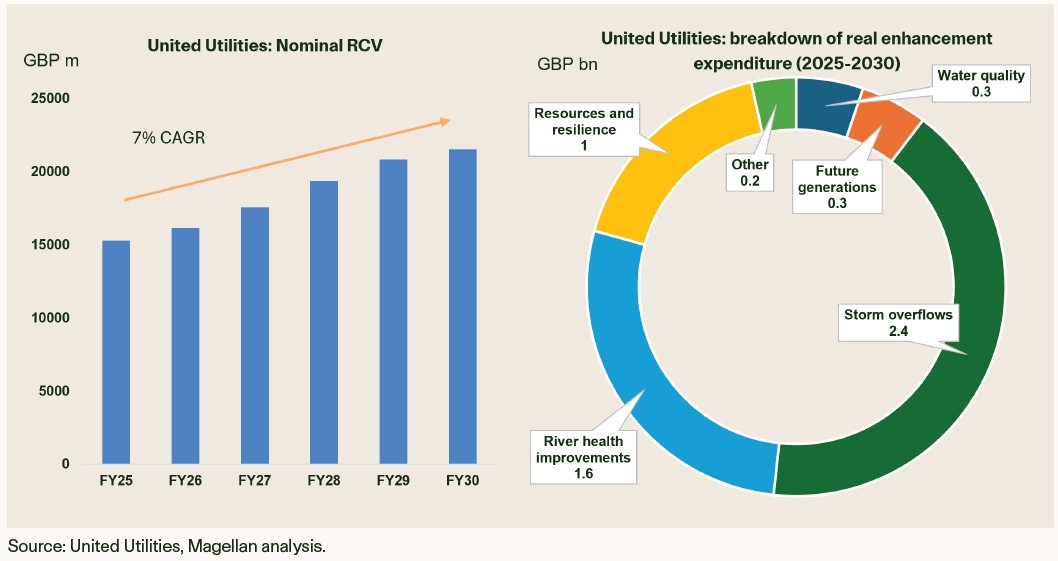
Many investors are well-versed in the growth story for data centres, with the rapid building of these assets a focal point in markets and the media. What is perhaps not appreciated is the large-scale capital investment outlook beyond hyperscalers, AI and data centres.
This capex story is durable for regulated utilities, even in a market downturn. Regardless of the economic climate, there are no substitutes for clean water and wastewater infrastructure. For the UK listed water utilities, while share prices are sensitive to rates, this does not reflect any change in the underlying quality of these businesses. |
|
Funds operated by this manager: Vinva Global Alpha Fund - Active ETF (ASX: V1AC) , Vinva Australian Equity Fund , Vinva Global Equity Fund , Vinva Australian Alpha Extension Fund , Vinva Global Alpha Extension Fund , Magellan Infrastructure Fund , Magellan Global Opportunities Fund No.2 , Magellan Infrastructure Fund (Unhedged) , Magellan Core Infrastructure Fund , Magellan Global Opportunities Fund Active ETF (ASX:OPPT) Important Information: This material has been delivered to you by Magellan Asset Management Limited ABN 31 120 593 946 AFS Licence No. 304 301 trading as Magellan Investment Partners ('Magellan Investment Partners') and has been prepared for general information purposes only and must not be construed as investment advice or as an investment recommendation. This material does not take into account your investment objectives, financial situation or particular needs. This material does not constitute an offer or inducement to engage in an investment activity nor does it form part of any offer documentation, offer or invitation to purchase, sell or subscribe for interests in any type of investment product or service. You should obtain and consider the relevant Product Disclosure Statement ('PDS') and Target Market Determination ('TMD') and consider obtaining professional investment advice tailored to your specific circumstances before making a decision about whether to acquire, or continue to hold, the relevant financial product. A copy of the relevant PDS and TMD relating to a Magellan Investment Partners financial product may be obtained by calling +61 2 9235 4888 or by visiting www.magellaninvestmentpartners.com Past performance is not necessarily indicative of future results and no person guarantees the future performance of any financial product or service, the amount or timing of any return from it, that asset allocations will be met, that it will be able to implement its investment strategy or that its investment objectives will be achieved. This material may contain 'forward-looking statements'. Actual events or results or the actual performance of a Magellan Investment Partners financial product or service may differ materially from those reflected or contemplated in such forward-looking statements. This material may include data, research and other information from third party sources. No guarantee is made that such information is accurate, complete or timely and no warranty is given regarding results obtained from its use. This information is subject to change at any time and no person has any responsibility to update any of the information provided in this material. Statements contained in this material that are not historical facts are based on current expectations, estimates, projections, opinions and beliefs of Magellan Investment Partners or the third party responsible for making those statements (as relevant). Such statements involve known and unknown risks, uncertainties and other factors, and undue reliance should not be placed thereon. No representation or warranty is made with respect to the accuracy or completeness of any of the information contained in this material. Magellan Investment Partners will not be responsible or liable for any losses arising from your use or reliance upon any part of the information contained in this material. Any third-party trademarks contained herein are the property of their respective owners and Magellan Investment Partners claims no ownership in, nor any affiliation with, such trademarks. Any third-party trademarks contained herein are the property of their respective owners, are used for information purposes and only to identify the company names or brands of their respective owners, and no affiliation, sponsorship or endorsement should be inferred from such use. This material and the information contained within it may not be reproduced, or disclosed, in whole or in part, without the prior written consent of Magellan Investment Partners. (080825-#W17) |

10 Apr 2026 - What Goldman Sachs teaches about risk
|
What Goldman Sachs teaches about risk Marcus Today March 2026 5-minute read Lloyd Blankfein's memoir offers a rare inside look at markets, risk and decision-making from the top of Goldman Sachs during periods of extreme uncertainty. If you ever need proof a billion-dollar net worth won't solve all your problems, take it from the man who made that kind of cash from nothing. More on that in a minute. Meet Lloyd Blankfein, ex-CEO of Goldman Sachs (NYSE: GS). I just finished his memoir, StreetWise. Full credit to the man. He became one of the top dogs on Wall Street despite coming from a humble background and, somewhat oddly, not even being that interested in finance or business originally. It just wasn't a big part of his world as a young fella. Lloyd studied law, got bored with that kind of gig, then got a job in a commodity trading firm. Goldman later acquired the firm, and he was in the door, so to speak, to the storied investment bank. Lloyd made partner as he worked his way up... and ended up seriously rich. Here's an early takeaway on markets... "Managing traders, I observed that what distinguished the best ones wasn't that they were necessarily right more than the others. They simply adjusted more quickly. They made more money when they were right and lost less money when they were wrong." Loss aversion can kill you, in other words. What makes great traders differentHere's another that seems pertinent to the markets today, especially as AI dictates more trading: "The quants tell you what should happen based on statistics. The traders know what can happen in markets, based on hard experience." One wonders what quant funds make of the current block in the Strait of Hormuz. There are no statistics for that directly. Lessons from the GFCProbably the most interesting part of the book is when he takes us through the 2007-2009 period. Even as head of Goldman Sachs, Lloyd didn't know how bad it would get. He writes: "We had no overall view on which way the market would go.... There was little comprehension even among the most sophisticated thinkers in finance about the way defaults on subprime loans could affect AAA-rated mortgage securities, and credit markets generally." It's hard not to think that the future is just as hazy for the men and women at swish names like Goldman Sachs as it is for the rest of us, despite the fancy suits and big pay cheques. Even inside the company there wasn't agreement. What saved Goldman relative to the other Wall Street firms is they acted more conservatively due to Lloyd's aversion to "tail risks". Smart move, in hindsight. Here's how Lloyd sums up why competitor Bear Stearns collapsed:
Think about that for a moment. Does this sound like responsible financial management from a Wall Street "investment" bank? Hardly. That's what they did. It was more like a gambling shop. Pressure, perspective and Warren BuffettOne anecdote that sticks out is the relaxed way Warren Buffett rolls. Lloyd writes: "With Warren, you get one shot. If he doesn't like your proposal, or you don't like his, it's over. He proposed putting $5 billion into the firm... I started talking to him about how we could execute his investment and was about to go over some open questions." "That's all fine," he said. "I trust you. I'm taking my grandson to Dairy Queen." You kind of feel sorry for Lloyd as the crisis drags on, and its aftermath. He and Goldman Sachs are constantly bashed in the press. He's forced to fire staff. Protestors camp outside his apartment. He's dragged in front of government officials regularly. Endless flying and meetings. There's a chance Goldman goes under from the general storm. They might have to merge with another company. The share price tanks. All very high stress. Then he gets cancer. That puts it all in perspective. Eventually, he's jack of all the hassle. He retires to read books, travel and trade the market with his own cash. The real takeaway for investorsAnother handy conclusion for us is this one... "I always thought the future was unknowable. Most of the biggest changes in my lifetime, including the end of the Cold War, the rise of China, the arrival of the internet, and rapid transformations wrought by AI, were not just unforeseen but large unforeseeable until they were upon us. Predict the future? We can barely predict the present." His main message is that the biggest danger is the thing you don't know about or expect. The only thing you can ever do is plan for any scenario so nothing can wipe you out completely. That's one of our principles here at Marcus Today: "Risk is unavoidable - make decisions using a balance of probabilities." I'm sure Lloyd would agree. |
|
Funds operated by this manager: |