


NEWS

25 Aug 2026 - 10k Words | August 2026

24 Aug 2026 - Performance Report: Altor AltFi Income Fund
[Current Manager Report if available]

21 Aug 2026 - Hedge Clippings | 21 August 2026
|
|
|
Hedge Clippings | 21 August 2026 Unemployment back to April's post-COVID high, real wages going backwards on both sides of the Pacific, and a US Treasury bond buyback that was unwound within a day of being announced, while the war it was reacting to kept getting worse, not better. Unemployment hits 4.5% again, the highest of the post-COVID era Thursday's Labour Force release showed seasonally adjusted unemployment rising to 4.5% in July, up from 4.4% in both May and June, and back to May's number, the highest reading of the post-COVID era in trend terms. Employment fell by 15,800 mainly driven by a fall of 32,200 part-time jobs, and total hours worked fell by 1 million, although still 21 million hours higher than a year ago. Participation eased to 66.9% from 67.0%. This is the labour market evidence, alongside the July CPI data due next Wednesday, that will be on the agenda when the RBA next meets on 29 September. Despite the softer July employment number, the RBA reportedly still views the labour market as a little tight even though it has been steadily rising since the post COVID low of 3.4% in July 2022. Economists now rate a September rate hike as extremely unlikely rather than impossible, while the chances of a rate cut - not even contemplated by the board at the RBA's last meeting - would also seem unlikely unless July's CPI surprises on the downside, or consumer sentiment falls further thanks to the budget's tax changes. Anecdotal evidence suggests that the unemployment rate will continue to rise, particularly given the decline in the property market and the resultant sharp fall in mortgage processing by the big banks, and which are already flowing through to those employed in related fields such as conveyancing. While some are pointing to three consecutive rate rises from the RBA as the cause, only "Melons" Albanese and Jim Chalmers are denying that the budget changes are partly responsible. A fourth straight month of underemployment above 6%, with full-time growth offset by a bigger fall in part-time hours, isn't a labour market falling off a cliff. The housing market losing momentum will also add to the areas the RBA will be watching closely. US$40 trillion in debt, 30 year yields at 19 year high, and a bond buyback that didn't survive the day Total US public debt outstanding topped US$40 trillion for the first time on 19 August, the same day the 30-year Treasury yield hit its highest level since 2007 amid the renewed Middle East escalation and a deteriorating fiscal outlook. The US Treasury responded with a surprise announcement doubling its long-dated bond buyback size from US$2 billion to at least US$4 billion per operation, effective 9 September through 4 November, its second intervention this month. Yields fell sharply on the announcement, the 30 year down 9 basis points to 5.196%, but the relief didn't last: by Thursday the 30 yield had risen over 7 basis points to as much as 5.27%, erasing the prior day's move entirely. Treasury Secretary Scott Bessent called it a "big tool kit," and Trump, asked if Americans should worry about the bond market, said simply, "No, I don't think so." A buyback fully unwound within 24 hours is a useful data point on its own: it tells you the market's real concern isn't liquidity, it's the underlying fiscal trajectory, which no buyback programme actually fixes. Term premium, not plumbing, is doing the work here. Day 173: the war that was meant to last weeks now has the UAE watching for ballistic missiles, while Trump threatens US ally Oman. The US-Israel war on Iran, now in its sixth month, escalated rather than resolved this week. The UAE reported detecting two ballistic missiles launched toward the country from Iran, Israel struck an airbase in Syria's Idlib province, drawing condemnation from both the US and Turkey, and Trump posted an image of the Strait of Hormuz labelled "New US territory" after Iran restated its core demands for reopening it. Trump separately said no talks were underway, a day after suggesting a back channel had opened with Iran's Revolutionary Guard Corps. Oil climbed to its highest level since July as hopes of a near-term resolution faded again, the fourth such reversal since February. Every prior "close to a deal" moment in this conflict has been followed by escalation within days. Markets pricing imminent resolution are trading the headline, not the pattern. The pattern, five months running, is escalation, with Trump seemingly running out of options - and time - prior to the mid-term elections. News | Insights Manager Insights | Sharpbridge Funds Management Great technology, poor return | Insync Fund Managers Market Commentary | Glenmore Asset Management July 2026 Performance News Bennelong Long Short Equity Fund |
|
|
If you'd like to receive Hedge Clippings direct to your inbox each Friday |

21 Aug 2026 - Performance Report: Insync Global Capital Aware Fund
[Current Manager Report if available]

21 Aug 2026 - Chart to Watch: Looking beyond U.S. market leadership
|
Chart to Watch: Looking beyond U.S. market leadership Janus Henderson Investors August 2026 (2-minute read) Portfolio Managers Christopher O'Malley and Julian McManus discuss the factors supporting markets outside the U.S. and where they continue to find attractive opportunities. 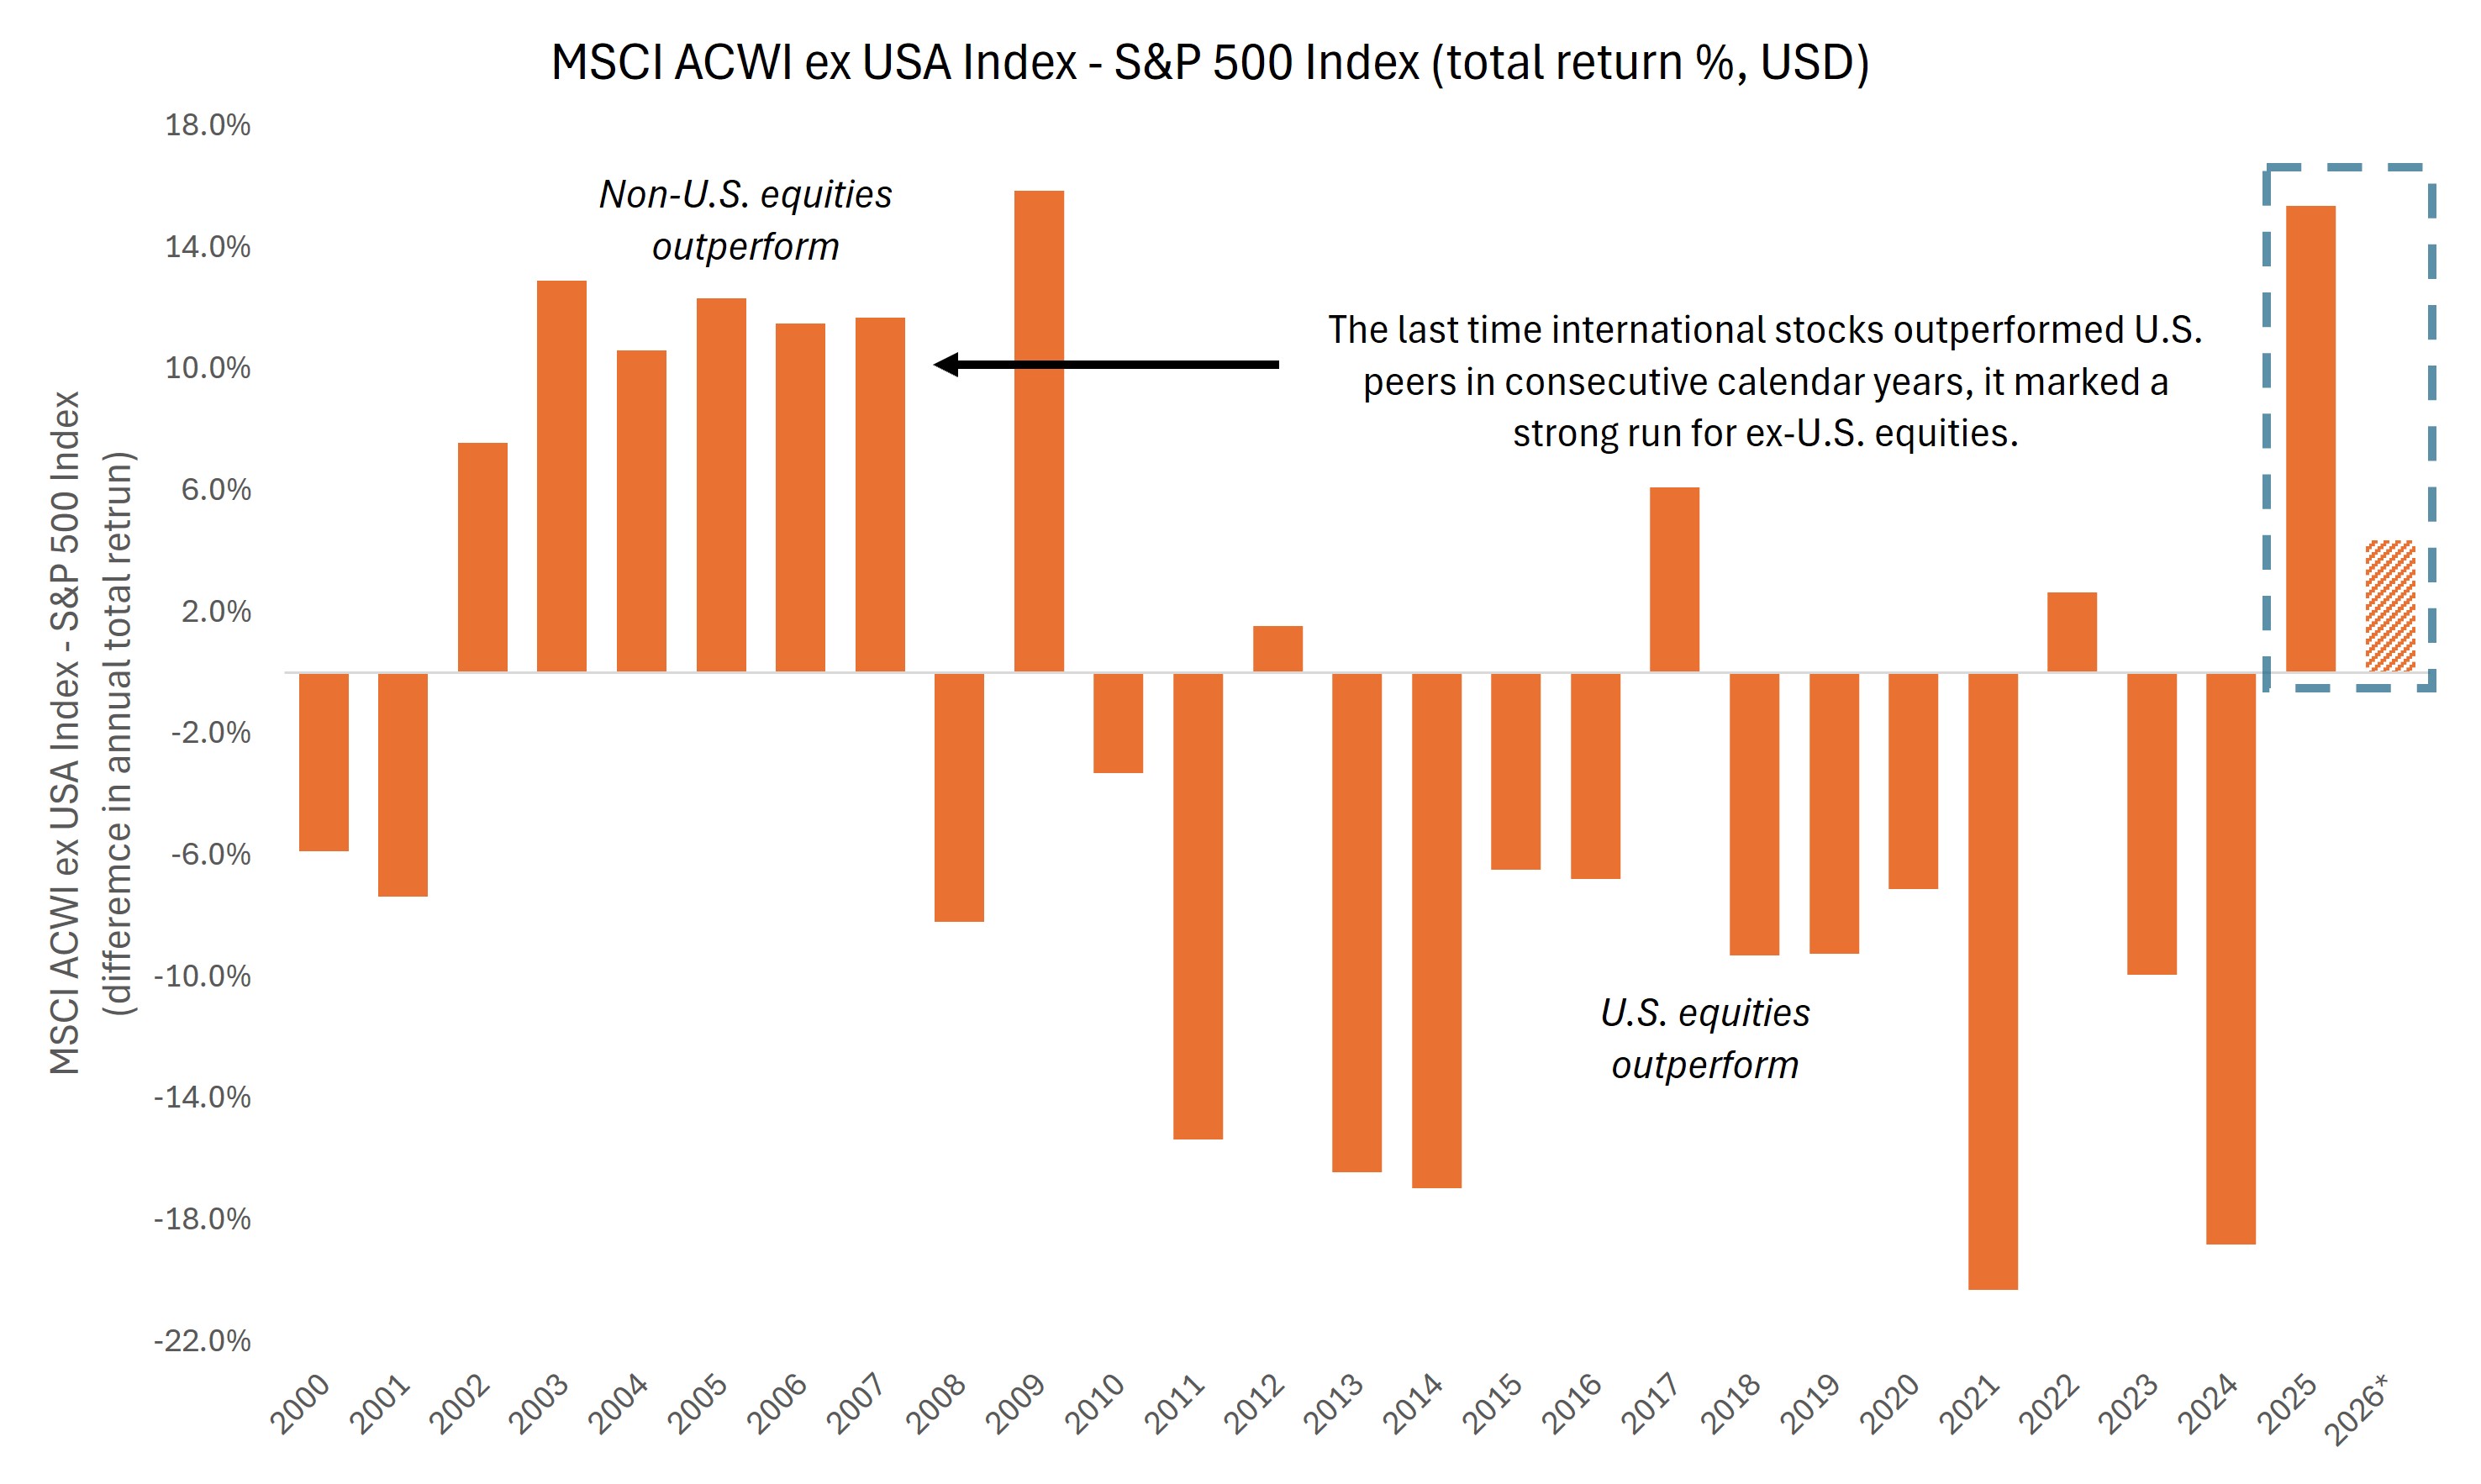
Source: Bloomberg. Chart shows the annual difference in total return (%) between non-U.S. equities, as represented by the MSCI ACWI ex USA Index, and U.S. equities, as represented by the S&P 500® Index. Positive values indicate years in which international equities outperformed U.S. equities. *Data for 2026 is year-to-date as of 31 July 2026. Past performance does not predict future results.
*Data for 2026 is year-to-date as of 31 July 2026. Past performance does not predict future results. IMPORTANT INFORMATION Actively managed investment portfolios are subject to the risk that the investment strategies and research process employed may fail to produce the intended results. Accordingly, a portfolio may underperform its benchmark index or other investment products with similar investment objectives. Aerospace and defense industries can be significantly affected by changes in the economy, fuel prices, labor relations, and government regulation and spending. Artificial intelligence ("AI") focused companies, including those that develop or utilize AI technologies, may face rapid product obsolescence, intense competition, and increased regulatory scrutiny. These companies often rely heavily on intellectual property, invest significantly in research and development, and depend on maintaining and growing consumer demand. Their securities may be more volatile than those of companies offering more established technologies and may be affected by risks tied to the use of AI in business operations, including legal liability or reputational harm. Diversification neither assures a profit nor eliminates the risk of experiencing investment losses. Equity securities are subject to risks including market risk. Returns will fluctuate in response to issuer, political and economic developments. Financials industries can be significantly affected by extensive government regulation, subject to relatively rapid change due to increasingly blurred distinctions between service segments, and significantly affected by availability and cost of capital funds, changes in interest rates, the rate of corporate and consumer debt defaults, and price competition. Foreign securities are subject to additional risks including currency fluctuations, political and economic uncertainty, increased volatility, lower liquidity and differing financial and information reporting standards, all of which are magnified in emerging markets. Technology industries can be significantly affected by obsolescence of existing technology, short product cycles, falling prices and profits, competition from new market entrants, and general economic conditions. A concentrated investment in a single industry could be more volatile than the performance of less concentrated investments and the market as a whole. |
|
Funds operated by this manager: Janus Henderson Australian Fixed Interest Fund , Janus Henderson Conservative Fixed Interest Fund , Janus Henderson Diversified Credit Fund , Janus Henderson Global Natural Resources Fund , Janus Henderson Tactical Income Fund , Janus Henderson Australian Fixed Interest Fund - Institutional , Janus Henderson Conservative Fixed Interest Fund - Institutional , Janus Henderson Cash Fund - Institutional , Janus Henderson Global Multi-Strategy Fund , Janus Henderson Global Sustainable Equity Fund , Janus Henderson Sustainable Credit Fund All opinions and estimates in this information are subject to change without notice and are the views of the author at the time of publication. Janus Henderson is not under any obligation to update this information to the extent that it is or becomes out of date or incorrect. The information herein shall not in any way constitute advice or an invitation to invest. It is solely for information purposes and subject to change without notice. This information does not purport to be a comprehensive statement or description of any markets or securities referred to within. Any references to individual securities do not constitute a securities recommendation. Past performance is not indicative of future performance. The value of an investment and the income from it can fall as well as rise and you may not get back the amount originally invested. Whilst Janus Henderson believe that the information is correct at the date of publication, no warranty or representation is given to this effect and no responsibility can be accepted by Janus Henderson to any end users for any action taken on the basis of this information. |

20 Aug 2026 - Performance Report: 4D Global Infrastructure Fund (Unhedged)
[Current Manager Report if available]

20 Aug 2026 - Judgement matters when ESG ratings clash
|
Judgement matters when ESG ratings clash abrdn July 2026 (3-minute read) Environmental, social and governance (ESG) ratings now sit inside many investment processes. They can influence portfolio construction, risk management, stewardship priorities, product design and client reporting. Yet the same company can be rated a sustainability leader by one provider and a laggard by another. This isn't a simple data problem. It reflects different judgements about what to measure, how to measure it and how much weight to give each issue. Importantly for active managers, rating discrepancies can create opportunities. The scale and sources of disagreementAcademic research12345 shows that the correlations between major ESG rating providers are often only moderate. Some studies6 suggest that around half of listed companies receive conflicting ESG classifications in the same year, despite better disclosure and more regulatory scrutiny.
Research identifies three main drivers of divergence:
Measurement differences explain most of the disagreement. ESG ratings aren't interchangeable measures of one truth, but analytical views shaped by the provider's lens. Regulators recognise this issue. The EU ESG Ratings Regulation, applying from July 2026, introduces authorisation, transparency and governance requirements for providers. What are ESG ratings measuring?ESG scores often blur two different concepts: financial materiality and impact materiality. Financial materiality asks how environmental and social factors affect a company's profits, cash flows, asset values, borrowing costs and downside risk. Impact materiality asks how a company's operations affect the environment and society, and whether or not markets price those effects today. It's not always clear which of these two objectives an ESG score is answering. When financial risks and impact risks are conflated, reliance on a headline ESG score becomes problematic for investment decisions. What are the consequences for investment outcomes?Disagreement over ESG ratings has practical consequences for investors.
Methodology changes can move ratingsRecent ESG methodology revisions illustrate how provider-specific choices can move ratings without any change in company behaviour. MSCI's March 2026 update changed ratings for around one-third of the companies covered, with slightly more upgrades than downgrades. For strategies using discrete rating thresholds, even modest methodology changes can trigger portfolio changes unrelated to fundamentals. Our active approachAt Aberdeen Investments, we believe third-party ESG data is a valuable input, but outsourcing judgement to a single provider is inconsistent with our fiduciary responsibility. Our framework combines governance assessments, operational ESG risks analysis and product-level information. This helps portfolio managers assess ESG issues through a financial materiality lens. Internal specialists challenge inconsistencies and add context from research and engagement, keeping accountability with the investment team rather than the data provider. Active ownership strengthens the process by testing company claims, challenging assumptions, and focusing engagement on financially relevant risks. These insights feed back into analysis, which aligns stewardship and investment outcomes over time. Our approach is built on resource depth, analytical ownership and active judgement. We don't rely on a single data source or an external composite rating to screen portfolios. Our ESG process isn't mechanistic score-following. Final thoughts...ESG rating disagreement is structural, persistent and economically meaningful. Much of this disagreement reflects not just data challenges, but deeper ambiguity about whether ESG assessments are targeting financial materiality or impact materiality. Rather than solely relying on third-party scores, we combine financially material ESG integration with an impact-focused view to form our own judgement. In a world of divergent ESG opinions, investment conviction comes from clear objectives, robust frameworks and active judgement about what truly drives long-term value and risk. |
|
Funds operated by this manager: abrdn Sustainable Asian Opportunities Fund , abrdn Emerging Markets Equity Fund , abrdn Sustainable International Equities Fund , abrdn Global Corporate Bond Fund (Class A)
|

19 Aug 2026 - Performance Report: Cyan C3G Fund
[Current Manager Report if available]
19 Aug 2026 - Great technology, poor returns

18 Aug 2026 - Performance Report: ECCM Systematic Trend Fund
[Current Manager Report if available]
