NEWS

25 Mar 2021 - Performance Report: Bennelong Twenty20 Australian Equities Fund
| Report Date | |
| Manager | |
| Fund Name | |
| Strategy | |
| Latest Return Date | |
| Latest Return | |
| Latest 6 Months | |
| Latest 12 Months | |
| Latest 24 Months (pa) | |
| Annualised Since Inception | |
| Inception Date | |
| FUM (millions) | |
| Fund Overview | The Fund is managed as one portfolio but comprises and combines two separately managed exposures: 1. An investment in the top 20 stocks of the markets, which the Fund achieves by taking an indexed position in the S&P/ASX 20 Index; and 2. An investment in the stocks beyond the S&P/ASX 20 Index. This exposure is managed on an active basis using a fundamental core approach. The Fund may also invest in securities expected to be listed on the ASX, securities listed or expected to be listed on other exchanges where such securities relate to ASX-listed securities.Derivative instruments may be used to replicate underlying positions and hedge market and company specific risks. The companies within the portfolio are primarily selected from, but not limited to, the S&P/ASX 300 Accumulation Index. The Fund typically holds between 40-55 stocks and thus is considered to be highly concentrated. This means that investors should expect to see high short-term volatility. The Fund seeks to achieve growth over the long-term, therefore the minimum suggested investment timeframe is 5 years. |
| Manager Comments | The Fund's Sharpe and Sortino ratios (since inception), 0.66 and 0.84 respectively, by contrast with the Index's Sharpe of 0.45 and Sortino of 0.52, highlight its capacity to achieve superior risk-adjusted returns while avoiding the market's downside volatility over the long-term. The Fund's ability to significantly outperform in rising markets is demonstrated by its up-capture ratio (since inception) of 124.84%. As at the end of February, the portfolio's weightings had been increased in the Communications, Industrials, Materials and Financials sectors, and decreased in the IT, Consumer Staples, Health Care and REIT's sectors. Weightings in the Discretionary and Energy sectors remained unchanged. By comparison with the ASX300 Index, the Fund is significantly overweight the Discretionary sector (Fund weight: 33.1%, benchmark weight: 8%). |
| More Information |

25 Mar 2021 - Performance Report: The Airlie Australian Share Fund
| Report Date | |
| Manager | |
| Fund Name | |
| Strategy | |
| Latest Return Date | |
| Latest Return | |
| Latest 6 Months | |
| Latest 12 Months | |
| Latest 24 Months (pa) | |
| Annualised Since Inception | |
| Inception Date | |
| FUM (millions) | |
| Fund Overview | The Fund is long-only with a bottom-up focus. It has a concentrated portfolio of 15-35 stocks (target 25). Maximum cash holding of 10% with an aim to be fully invested. Airlie employs a prudent investment approach that identifies companies based on their financial strength, attractive durable business characteristics and the quality of their management teams. Airlie invests in these companies when their view of their fair value exceeds the prevailing market price. It is jointly managed by Matt Williams and Emma Fisher. Matt has over 25 years' investment experience and formerly held the role of Head of Equities and Portfolio Manager at Perpetual Investments. Emma has over 8 years' investment experience and has previously worked as an investment analyst within the Australian equities team at Fidelity International and, prior to that, at Nomura Securities. |
| Manager Comments | The Fund's 12-month up-capture and down-capture ratios, 110% and 93% respectively, indicate that, on average, it has outperformed during the market's positive and negative months. The Fund has maintained an up-capture ratio of above 100% over all time periods, highlighting its capacity to outperform in positive markets. At month-end, the portfolio's top positions included Aurizon Holdings, BHP Group, CBA, CSL, Healius, NAB, PWR Holdings, Tabcorp Holdings, Wesfarmers and Woolworths Ltd. By sector, the portfolio was most heavily weighted towards the Financials and Consumer Discretionary sectors. |
| More Information |

25 Mar 2021 - Performance Report: Insync Global Capital Aware Fund
| Report Date | |
| Manager | |
| Fund Name | |
| Strategy | |
| Latest Return Date | |
| Latest Return | |
| Latest 6 Months | |
| Latest 12 Months | |
| Latest 24 Months (pa) | |
| Annualised Since Inception | |
| Inception Date | |
| FUM (millions) | |
| Fund Overview | Insync employs four simple screens to narrow the universe of over 40,000 listed companies globally to a focus group of high quality companies that it believes have the potential to consistently grow their profits and dividends. These screens are size of the company, balance sheet performance, valuation and dividend quality. Companies that pass this due diligence process are then valued using dividend discount models, free cash flow yield and proprietary implied growth and expected return models. The end result is a high conviction portfolio of typically 15-30 stocks. The principal investments will be in shares of companies listed on international stock exchanges (including the US, Europe and Asia). The Fund may also hold cash, derivatives (for example futures, options and swaps), currency contracts, American Depository Receipts and Global Depository Receipts. The Fund may also invest in various types of international pooled investment vehicles. At times, Insync may consider holding higher levels of cash if valuations are full and it is difficult to find attractive investment opportunities. When Insync believes markets to be overvalued, it may hold part of its resources in cash, or use derivatives as a way of reducing its equity exposure. Insync may use options, futures and other derivatives to reduce risk or gain exposure to underlying physical investments. The Fund may purchase put options on market indices or specific stocks to hedge against losses caused by declines in the prices of stocks in its portfolio. |
| Manager Comments | The Fund's capacity to protect investors' capital in falling and volatile markets is highlighted by the following statistics (since inception): Sortino ratio of 1.68 vs the Index's 1.36, maximum drawdown of -10.98% vs the Index's -13.59%, and down-capture ratio of 61.74%. The Fund's top 10 active holdings at month-end were Walt Disney, PayPal, Nintendo, Visa, S&P Global, Domino's Pizza, Dollar General, Qualcomm, Microsoft and Facebook. By sector, the portfolio was most heavily weighted towards the IT sector relative to the MSCI while also relatively underweight the Industrials sector. Megatrends to which the Fund had the greatest exposure were eCommerce and Digitisation. |
| More Information |

24 Mar 2021 - Performance Report: Premium Asia Fund
| Report Date | |
| Manager | |
| Fund Name | |
| Strategy | |
| Latest Return Date | |
| Latest Return | |
| Latest 6 Months | |
| Latest 12 Months | |
| Latest 24 Months (pa) | |
| Annualised Since Inception | |
| Inception Date | |
| FUM (millions) | |
| Fund Overview | The Fund is managed by Value Partners using a disciplined value-oriented approach supported by intensive, on-the-ground bottom-up fundamental research resulting in a portfolio of individual holdings, which are, in the view of Value Partners, undervalued and of high quality, on either an absolute or relative basis, and which have the potential for capital appreciation. The Fund will primarily have exposure to the equity securities of entities listed on securities exchanges across the Asia (ex-Japan) region, however, the Fund may also gain exposure to entities listed on securities outside the Asia (ex-Japan) region which have significant assets, investments, production activities, trading or other business interests in the Asia (ex-Japan) region as well as unlisted instruments with equity-like characteristics, such as participatory notes and convertible bonds. The Fund may also invest in cash and money market instruments, depositary receipts, listed unit trusts, shares in mutual fund corporations and other collective investment schemes (including real estate investment trusts), derivatives including both exchange-traded and OTC, convertible securities, participatory notes, bonds, and foreign exchange contracts. |
| Manager Comments | Under high demand for electronic components, the Fund's South Korean and Taiwanese hardware manufacturers holdings continued to rally in February. Premium noted the global recovery lends upside to demand, benefitting the materials sector. This includes the Fund's chemical manufacturer holding in South Korea. As the pandemic impacts lessened and recovery kicked in, the Manager has been building more positions in Korean equities since the beginning of the year. They remain constructive on the global recovery outlook and continue to favour the market as the earnings upcycle continues. Premium's view is that overall growth in North Asia has higher visibility underpinned by the resilient macro backdrop. Thus, they maintain their overweight position in the sub-region over ASEAN. Looking forward, Premium's conviction on Asian equities remains unchanged. They expect fundamentals to stay robust amid the on-going recovery in the region. The change in the inflation environment is being assessed in their bottom-up stock picking process. They remain focused on quality companies that showcase high visibility and sustained earnings growth. |
| More Information |
24 Mar 2021 - Performance Report: Bennelong Concentrated Australian Equities Fund
| Report Date | |
| Manager | |
| Fund Name | |
| Strategy | |
| Latest Return Date | |
| Latest Return | |
| Latest 6 Months | |
| Latest 12 Months | |
| Latest 24 Months (pa) | |
| Annualised Since Inception | |
| Inception Date | |
| FUM (millions) | |
| Fund Overview | The overriding objective of the Concentrated Australian Equities Fund is to seek investment opportunities which are under-appreciated and have the potential to deliver positive earnings, while satisfying our stringent quality criteria. Bennelong's investment process combines bottom-up fundamental analysis together with proprietary investment tools which are used to build and maintain high quality portfolios that are risk aware. The portfolio typically consists of 20-35 high-conviction stocks from the S&P/ASX 300 Index. The Fund may invest in securities listed on other exchanges where such securities relate to ASX-listed securities. Derivative instruments are mainly used to replicate underlying positions and hedge market and company specific risks. |
| Manager Comments | The Fund's superior capacity to avoid the market's downside volatility over the long-term is supported by its Sortino ratio (since inception) of 1.37 vs the Index's 0.74%. As at the end of February, the portfolio's weightings had been increased in the Discretionary, Health Care, Industrials, Consumer Staples and Materials sectors, and decreased in the IT, Communication, REIT's and Financials sectors. Relative to the ASX300 Index, the portfolio was significantly overweight the Discretionary sector (Fund weight: 42.4%, benchmark weight: 8.0%) and underweight the Financials sector (Fund weight: 6.9%, benchmark weight: 27.6%). |
| More Information |

24 Mar 2021 - Performance Report: Glenmore Australian Equities Fund
| Report Date | |
| Manager | |
| Fund Name | |
| Strategy | |
| Latest Return Date | |
| Latest Return | |
| Latest 6 Months | |
| Latest 12 Months | |
| Latest 24 Months (pa) | |
| Annualised Since Inception | |
| Inception Date | |
| FUM (millions) | |
| Fund Overview | The main driver of identifying potential investments will be bottom up company analysis, however macro-economic conditions will be considered as part of the investment thesis for each stock. |
| Manager Comments | The Fund returned -1.61% in February. Positive contributors included Pinnacle Investment Management and Uniti Group, while NRW Holdings and Coronado Global Resources detracted from performance. Glenmore believe that, regarding COVID-19, the data both in Australia and globally continue to show improvement. Their view is that the outlook over the next 12-18 months is for incremental improvement in cases, which they expect should present investment opportunities in stocks and sectors that underperformed in 2020. |
| More Information |

24 Mar 2021 - Performance Report: NWQ Fiduciary Fund
| Report Date | |
| Manager | |
| Fund Name | |
| Strategy | |
| Latest Return Date | |
| Latest Return | |
| Latest 6 Months | |
| Latest 12 Months | |
| Latest 24 Months (pa) | |
| Annualised Since Inception | |
| Inception Date | |
| FUM (millions) | |
| Fund Overview | The Fund aims to produce returns after management fees and expenses of RBA Cash Rate + 4.0-5.0% p.a. over rolling five-year periods. Furthermore, the Fund aims to achieve these returns with volatility that is a fraction of the Australian equity market, in order to smooth returns for investors. |
| Manager Comments | The Fund's capacity to protect investors' capital in falling and volatile markets is highlighted by the following statistics (since inception): Sortino ratio of 1.08 vs the Index's 0.56, maximum drawdown of -8.77% vs the Index's -26.75%, and down-capture ratio of 13.25%. The Fund underperformed in February with the rotation from defensive/growth companies into cyclical/value companies impacting both sides of the portfolio. Several companies facing structural challenges in the medium-term (short portfolio) outperformed in February at the expense of higher quality names (long portfolio). NWQ emphasise the Fund is an alternative to a typical balanced portfolio of stocks and bonds. The typical balanced portfolio has relied on falling bond yields to boost returns (prices rise as yields fall) and to provide a buffer against equity market risks. However, NWQ believe with bond yields on the rise this favourable dynamic for balanced fund investors may not be so reliable in future. With bonds having low or negative expected returns over the medium-term, NWQ expect investors will need to seek alternative return sources in order to realise attractive real returns. |
| More Information |

24 Mar 2021 - Are Cyclicals the New Defensives?
|
Are Cyclicals the New Defensives? Douglas Isles, Investment Specialist, Platinum Asset Management 09 March 2021 In the February 2021 Monthly Update for the Platinum International Fund we noted that: "When we look at long term (i.e. 35 years) valuation analysis, relative to asset values, cyclical stocks still look cheaper than their averages, while defensives were only more expensive at the peak of the technology bubble." This brief note expands on the detail in that valuation comment. Over time, one simple valuation metric often used to identify stocks, sectors and countries that are out of favour or experiencing a temporary setback, is the Price-to-Book ratio (P/B). Mathematically, a P/B is equal to Price-to-Earnings (P/E) multiplied by Earnings-to-Book (or ROE). A low P/B can capture either a low valuation (on an earnings basis) and/or low returns on equity (coincident with cycle lows, or transient challenges) versus history. Our quant analyst team has their own classification that we use for cyclical and defensive sectors, which is more granular than the Global Industry Classification Standard (GICS). We split 19 sectors into cyclicals or defensives and track them over time. Today, according to our analysis, around 55% of the global market's capitalisation can be categorised as cyclicals and 45% as defensives. We classify cyclicals to be: retail; autos; banks; property; commercial services; industrial services; industrials; process industries; energy; materials; and hardware. The balance of the market we call defensives, and include: precious metals; consumer staples; healthcare; insurance; infrastructure; content; software; and communications. The Price/Book chart is key. Source: FactSet Research Systems, Platinum Investment Management Limited. If we compare the cyclicals in aggregate on a P/B basis, while they have experienced a sharp rebound from the lows of the COVID-19 sell-off, they are not expensive relative to historical levels, especially when considering today's near-record-low bond yields, which are often used to justify the case for paying more for equities. While defensives, on the contrary, are higher than most of the last 35 years, excluding the technology bubble. On a relative basis, the gap between the two groupings is close to its widest level of the last 35 years. In simple terms, this suggests that investing in cyclicals still makes sense, particularly given our observations in the February 2021 Monthly Update that: "A change in the 'real world' is a move away from monetary policy to fiscal policy, after decades of restraint by governments. This favours real companies over virtual ones, at the margin. With data on the recovery stronger than anyone would have expected in April/May 2020, the market is warming to sectors that were out of favour." From a performance outcome perspective, over the long bull market from 2009-2020, the best periods for Platinum's global equity strategy relative to market returns were in 2009, 2013 and 2017, which were coincident with the expansion of cyclical P/B multiples. This is a similar phenomenon to recent months. However, prior to the global financial crisis and especially from 2005-2008, cyclical areas, while performing well (particularly financials and resources), were less attractive and hence this relationship with our performance was not the same. In other words, Platinum's global equity strategy has not simply been a play on cyclicals over time, but we have tended to invest well in cyclicals when they are cheap. On the classification used by the quant team in assigning the 19 sectors and matching them to the portfolio on 26 February 2021, more than 75% of the long book was categorised as cyclical, with less than 25% in the defensive grouping, consistent with the discussion above and our views expressed over time about where there is value in the market. Thinking about cyclicals (or economically sensitives) as the opportunity rather than the common short-hand of 'value' (versus 'growth') is more instructive and captures a better sense of market dynamics. Bringing this back to themes in the portfolio and as the February 2021 Monthly Update notes: "The majority of the portfolio continues to be classified as belonging to the following thematics: Growth industrials, semiconductors, travel-related, Chinese consumer, healthcare, internet-related (though much reduced) and metals." DISCLAIMER: This article has been prepared by Platinum Investment Management Limited ABN 25 063 565 006, AFSL 221935, trading as Platinum Asset Management ("Platinum"). This information is general in nature and does not take into account your specific needs or circumstances. You should consider your own financial position, objectives and requirements and seek professional financial advice before making any financial decisions. You should also read the latest relevant product disclosure statement before making any decision to acquire units in any of our funds, copies are available at www.platinum.com.au. Past performance is not a reliable indicator of future results. Some numbers have been rounded. The commentary reflects Platinum's views and beliefs at the time of preparation, which are subject to change without notice. No representations or warranties are made by Platinum as to their accuracy or reliability. Commentary may also contain forward-looking statements. These forward-looking statements have been made based upon Platinum's expectations and beliefs. No assurance is given that future developments will be in accordance with Platinum's expectations. Actual outcomes could differ materially from those expected by Platinum. To the extent permitted by law, no liability is accepted by Platinum for any loss or damage as a result of any reliance on this information. Funds operated by this manager: Platinum Asia Fund (C Class), Platinum Asia Fund (P Class), Platinum European Fund (C Class), Platinum European Fund (P Class), Platinum Global Fund, Platinum International Brands Fund (C Class), Platinum International Brands Fund (P Class), Platinum International Fund (C Class), Platinum International Fund (P Class), Platinum International Health Care Fund (C Class), Platinum International Health Care Fund (P Class), Platinum International Technology Fund (C Class), Platinum International Technology Fund (P Class), Platinum Japan Fund (C Class), Platinum Japan Fund (P Class), Platinum Unhedged Fund (C Class), Platinum Unhedged Fund (P Class) |
23 Mar 2021 - Performance Report: Bennelong Australian Equities Fund
| Report Date | |
| Manager | |
| Fund Name | |
| Strategy | |
| Latest Return Date | |
| Latest Return | |
| Latest 6 Months | |
| Latest 12 Months | |
| Latest 24 Months (pa) | |
| Annualised Since Inception | |
| Inception Date | |
| FUM (millions) | |
| Fund Overview | The Bennelong Australian Equities Fund seeks quality investment opportunities which are under-appreciated and have the potential to deliver positive earnings. The investment process combines bottom-up fundamental analysis with proprietary investment tools that are used to build and maintain high quality portfolios that are risk aware. The investment team manages an extensive company/industry contact program which helps identify and verify various investment opportunities. The companies within the portfolio are primarily selected from, but not limited to, the S&P/ASX 300 Index. The Fund may invest in securities listed on other exchanges where such securities relate to the ASX-listed securities. The Fund typically holds between 25-60 stocks with a maximum net targeted position of an individual stock of 6%. |
| Manager Comments | As at the end of February, the portfolio's weightings had been increased in the Discretionary, Health Care, Communications, Industrials and Materials sectors, and decreased in the REIT's, IT and Financials sectors. Relative to the ASX300 Index, the portfolio was significantly overweight the Discretionary sector (Fund weight: 44.7%, benchmark weight: 7.6%) and underweight the Financials sector (Fund weight: 6.8%, benchmark weight: 28.6%). |
| More Information |
23 Mar 2021 - China's 14th Five Year Plan
|
China's 14th Five Year Plan Arminius Capital 25 February 2021
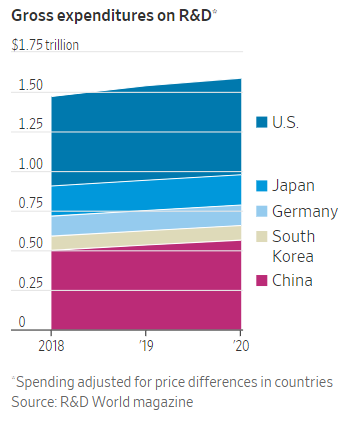
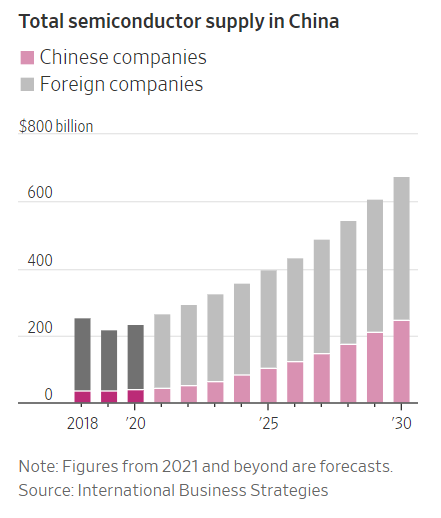
Western voters are used to their governments announcing numerous initiatives and targets - especially around election time - then forgetting these as fast as they can, and hoping that the electorate will do the same. By contrast, the Chinese Communist Party has been diligently preparing Five-Year Plans ever since they took power in 1949, and they are now up to Plan Number 14, which will apply from 2021 to 2025 inclusive. These Plans are very serious documents. They cover all arms of government and all parts of the country. Their purpose is to get China's army of unruly and self-interested bureaucrats heading in the same direction on the things that matter. To this end, each Plan is prepared with local and provincial input as well as the central authorities' opinions. At the end of each five-year period, the top leaders formally assess their government's performance against the Plan and, while they mostly boast about their achievements, they do also fess up to a few missed targets. Over the last four months the draft 14th Five-Year Plan has been making its way around the highest levels of government before getting the final seal of approval from the National People's Congress (China's tame Parliament) in March. As with all Chinese official documents, the Plan contains vast amounts of Communist platitudes and superfluous verbiage. But it also contains some very clear statements about where the Party leadership wants to the Chinese economy to go. The 14th Five-Year Plan departs quite dramatically from its predecessors in three key priorities which it sets. Right at the top comes "achieving self-reliance in science and technology" (�'技自立自强) so as to become "a science and technology superpower". Among other things, this means strengthening basic research, emphasizing original innovation, formulating strategic science plans, constructing national science centres and regional innovation hubs, and encouraging entrepreneurs in technology innovation. The Plan sets out a list of cutting-edge industries where it wants China to lead, including AI, semiconductors, aerospace, brain science, and bio-engineered breeding (genetically modified organisms).
Obviously, China's leaders have learned from the various US sanctions and embargos which the Trump Administration placed on the export of its high-tech to China. The Biden Administration has not removed these - instead, it has re-affirmed its intention of limiting technology transfer to China. (For some reason, neither side mentioned the Tiktok video platform.) The Chinese government now believes that the US has a stranglehold over China's future, so the 14th Five-Year Plan is intended to push China's high-technology sector to catch up with then overtake the US.
The second big change in priorities is the new focus on "dual circulation". This priority needs to be placed in historical context. From 1990 on, government policy actively encouraged production for export markets, mainly because exports generated foreign exchange which could be used to pay for essential imports, but also because Chinese consumers were then very poor - per capita GDP was USD 318 in 1990, compared to USD 10,262 in 2019. China's exports rose steadily in the 1990s, then rocketed up after the country joined the World Trade Organization in 2001, where it magically still enjoys the trade benefits of "developing nation status" despite being the second largest economy in the world. When calculated by purchasing power parity, China IS the largest economy in the world. But the great export boom slowed down as Chinese wages rose and the government allowed the renminbi to appreciate. From 2015 to 2019, exports were on average matched by imports, with the result that net exports contributed nothing to GDP growth. (It goes without saying that 2020 was a very unusual year, when China's trade surplus returned with a bang because of coronavirus-related demand and the suspension of tourism. Both of these factors are temporary.) The special term for this new emphasis is "dual circulation" (双循环), which Xi Jinping introduced at a Politburo meeting on 14 May 2020. It is now a common element in the policy lexicon. It means that the government wants to encourage production for domestic markets as well as for export markets. In order to do so, the government intends not only to expand domestic demand, but also to build a unified national market, upgrade supply chains, establish a modern logistics system, and strengthen property rights (including intellectual property). The focus on domestic demand is long overdue. Private consumption accounted for only 39% of China's GDP in 2019, compared to 66% for the US, so there is plenty of room to encourage consumption. The third big change in priorities is related to meeting the goal of peak carbon emissions by 2030, on the way to carbon neutrality by 2060. This goal will require the restructuring of China's power generation system, because at present more than 60% of electricity is generated by coal-fired power stations. It will also require the restructuring of energy-intensive industries such as steel, aluminium, cement, and plastics. All three big changes in priorities have clear implications for the long-term investment outlook. The new focus on high-tech and domestic consumption implies that less government and private money will go to infrastructure and mega-projects, hence China will have less need for steel, cement, and other building materials, therefore less demand for Australian iron ore and metallurgical coal. Housing growth will remain strong for the time being, but China's likely population decline will create headwinds for the housing sector. The goal of peak carbon emissions by 2030 speaks for itself - China will import less thermal coal. The implications for the world economy and Australian exports are equally clear. China will be using less construction materials and energy minerals, so any global resources boom will not be running on coal and iron ore, but on the essential inputs for renewable power generation plants and electric vehicles - e.g. copper, nickel, lithium, and rare earths.
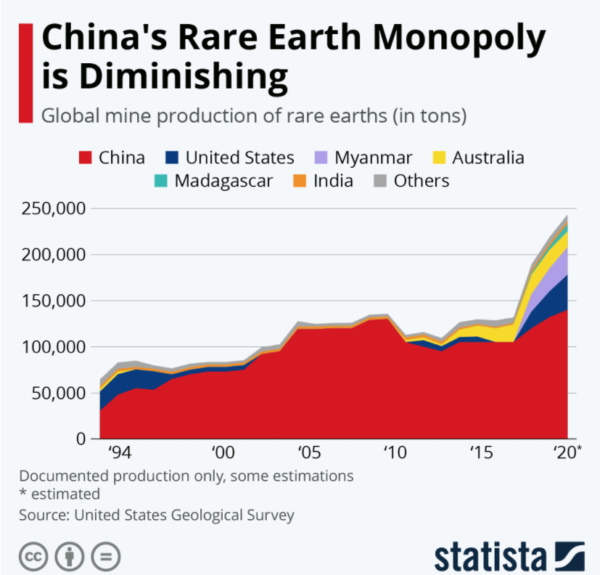
With the U.S. importing 80% of its rare earth elements from China (14 of the 35 most critical types such as those used in the F-35 are not able to be produced in the U.S.) Australia may have found itself a new resources export market... in the United States. Funds operated by this manager: |