
NEWS

15 Sep 2021 - The Long and The Short: What reporting season can tell us about life in Australia
|
The Long and The Short: What reporting season can tell us about life in Australia Kardinia Capital 2 September 2021 |
|
Just as the Australian Census promises to provide a comprehensive snapshot of the country and how we are changing, so too the recently-complete Australian profit reporting season can tell us what life has been like for Australians over the past 12 months.
Growth of online sales
Australian online home furnishing retailer Temple and Webster (TPW) is another such example, where FY21 revenue is up 85% on prior calendar period. We also got a glimpse of current trading, with July month to date revenue growth accelerated to +39%. We expect TPW to report a tremendous uplift in gross profit, enabling significant reinvestment in FY22. Savings rate still elevated Internet data usage swelling Solid demand for cars We have seen very strong profit results and growing forward order books from dealers like Eagers Automotive (APE) and Autosports (ASG) - both companies' share prices have appreciated over the previous 12 months, at 145% and 118% respectively. APE's "order bank growth is expected to continue as new vehicle demand remains strong and vehicle supply remains constrained"[3]. Source: Morgans, ABS
Weak travel results "It's not for lack of trying. Australians are ready to travel. Qantas Chief Customer Officer, Stephanie Tully, commented: "So we [have] obviously been researching our customers throughout the pandemic on their desire to travel and doing that monthly and in the last couple of months, particularly for international, we've seen the highest demand levels we've ever seen. When you compare that to pre-pandemic levels of people that are likely to travel in the next 12 months, we're seeing triple the amount of people looking to travel internationally in the next 12 months." Aircraft are being pulled out of storage, including the A380s, and reconfigurations are currently underway with the intention to return to the skies when the magical 70% and then 80% vaccination rates are achieved. Bolstering management's confidence was the strength of the domestic business in the June quarter of FY21 - by the end of June, management basically saw the domestic business booking curves back to pre-COVID levels. Concerning inventory levels Everyone seems to want to 'invest' in inventory as a strategic play. A stretched global manufacturing and supply chain is creating challenges - including longer lead times, higher freight costs and shipping delays - leading to companies growing inventory levels. Supercheap Retail (SUL) management said: "If it's [inventory is] not in the shed or on the shelf today, for Christmas this year I think the chance of it being [in stock] come that peak time is incredibly remote."[7] However, we do not want inventory growth outstripping sales growth, and this is something we'll watching closely in future periods. Retailers (BRG, SUL, KGN) continue to show higher levels of inventory and it's concerning us. Only JBH and BBN have managed to keep inventory days down so far. Whether customers will be the major beneficiaries of heightened promotion activity (for inventory vulnerable to obsolescence such as technology) remains unknown; only time will tell. What does all this mean for the future?
Department of Health We predict the 70% threshold for vaccinations will be reached by the end of October, which will be around the same time as AGM season. Our view is CEOs will start to get more optimistic around this event. This is likely going to continue the rotation towards coronavirus-impacted sectors. The Kardinia portfolio is positioned for re-opening, with stocks that benefit from this comprising ~30% of the long book and lockdown stocks only ~10%. We believe some themes, such as the shift to online, are enduring, and we continue to hold exposure to the technology sector. Of course, new COVID variants and government nervousness around a likely rising death rate (as witnessed overseas) present risks to our view, but the Kardinia fund's ability to shift its net exposure to markets in a range of -25% to +75% allows us to quickly respond to any change in outlook. |
|
Funds operated by this manager: Bennelong Kardinia Absolute Return Fund |
|
[1] Booktopia FY21 Results Presentation [2] Uniti Group FY21 Results Presentation [3] Eagers Automotive FY21 Results Presentation [4] Bluescope FY21 Results Presentation [5] Rex FY21 Results Presentation [6] Qantas FY21 Earnings Call [7] 'Zero chances of it arriving on time', Sydney Morning Herald, 22 August 2021 |


15 Sep 2021 - New Funds on Fundmonitors.com
|
New Funds on Fundmonitors.com |
|
Below are some of the funds we've recently added to our database. Follow the links to view each fund's profile, where you'll have access to their offer documents, monthly reports, historical returns, performance analytics, rankings, research, platform availability, and news & insights. |
|
|
||||||||||||||||||||
|
||||||||||||||||||||
|
|
||||||||||||||||||||
|
||||||||||||||||||||
| View Profile | ||||||||||||||||||||
|
|
||||||||||||||||||||
|
||||||||||||||||||||
| View Profile | ||||||||||||||||||||
|
|
||||||||||||||||||||
|
||||||||||||||||||||
| View Profile | ||||||||||||||||||||
|
|
||||||||||||||||||||
|
||||||||||||||||||||
| View Profile | ||||||||||||||||||||
|
|
||||||||||||||||||||
|
||||||||||||||||||||
| View Profile | ||||||||||||||||||||
|
|
||||||||||||||||||||
|
||||||||||||||||||||
| View Profile | ||||||||||||||||||||
|
||||||||||||||||||||
| View Profile | ||||||||||||||||||||


|
Want to see more funds? |
|
Subscribe for full access to these funds and over 600 others |

14 Sep 2021 - Performance Report: 4D Global Infrastructure Fund
| Report Date | |
| Manager | |
| Fund Name | |
| Strategy | |
| Latest Return Date | |
| Latest Return | |
| Latest 6 Months | |
| Latest 12 Months | |
| Latest 24 Months (pa) | |
| Annualised Since Inception | |
| Inception Date | |
| FUM (millions) | |
| Fund Overview | The fund is managed as a single portfolio including regulated utilities in gas, electricity and water, transport infrastructure such as airports, ports, road and rail, as well as communication assets such as the towers and satellite sectors. The portfolio is intended to have exposure to both developed and emerging market opportunities, with country risk assessed internally before any investment is considered. The maximum absolute position of an individual stock is 7% of the fund. |
| Manager Comments | The fund's returns over the past 12 months have been achieved with a volatility of 11.87% vs the index's 14.03%. The annualised volatility of the fund's returns since inception in March 2016 is 12.26% vs the index's 15.89%. Over all other periods, the fund's returns have been consistently less volatile than the index. The fund's down-capture ratio for returns since inception is 55.14%. Over all other periods, the fund's down-capture ratio has ranged from a high of 61.76% over the most recent 24 months to a low of 46.28% over the latest 12 months. A down-capture ratio less than 100% indicates that, on average, the fund has outperformed in the market's negative months over the specified period. |
| More Information |

14 Sep 2021 - Performance Report: Surrey Australian Equities Fund
| Report Date | |
| Manager | |
| Fund Name | |
| Strategy | |
| Latest Return Date | |
| Latest Return | |
| Latest 6 Months | |
| Latest 12 Months | |
| Latest 24 Months (pa) | |
| Annualised Since Inception | |
| Inception Date | |
| FUM (millions) | |
| Fund Overview | The Investment Manager follows a defined investment process which is underpinned by detailed bottom up fundamental analysis, overlayed with sectoral and macroeconomic research. This is combined with an extensive company visitation program where we endeavour to meet with company management and with other stakeholders such as suppliers, customers and industry bodies to improve our information set. Surrey Asset Management defines its investment process as Qualitative, Quantitative and Value Latencies (QQV). In essence, the Investment Manager thoroughly researches an investment's qualitative and quantitative characteristics in an attempt to find value latencies not yet reflected in the share price and then clearly defines a roadmap to realisation of those latencies. Developing this roadmap is a key step in the investment process. By articulating a clear pathway as to how and when an investment can realise what the Investment Manager sees as latent value, defines the investment proposition and lessens the impact of cognitive dissonance. This is undertaken with a philosophical underpinning of fact-based investing, transparency, authenticity and accountability. |
| Manager Comments | The fund's Sortino ratio (which excludes volatility in positive months) has ranged from a high of 6.86 for performance over the most recent 12 months to a low of 0.88 over the latest 36 months, and is 0.89 for performance since inception. By contrast, the ASX 200 Total Return Index's Sortino for performance since June 2018 is 0.75. Since inception in June 2018 in the months where the market was positive, the fund has provided positive returns 83% of the time, contributing to an up-capture ratio for returns since inception of 123.38%. Over all other periods, the fund's up-capture ratio has ranged from a high of 142.61% over the most recent 24 months to a low of 92.95% over the latest 12 months. An up-capture ratio greater than 100% indicates that, on average, the fund has outperformed in the market's positive months. |
| More Information |

14 Sep 2021 - The Rise of the Contactless Economy - A Global Megatrend
|
Covid-19 has created an unprecedented global change in how we pay for things. There's been a profound and permanent change in behaviour in Australia and many parts of the world. Payment apps are easy to use, they offer improved security and the work from home offers balance introduced since Covid means more time to browse from home via laptops and phones, says John Lobb Insync's Portfolio Manager, John Lobb tells us more on The Rise of the Contactless Economy Megatrend. Funds operated by this manager: Insync Global Capital Aware Fund, Insync Global Quality Equity Fund |
14 Sep 2021 - 10k Words - September Edition
|
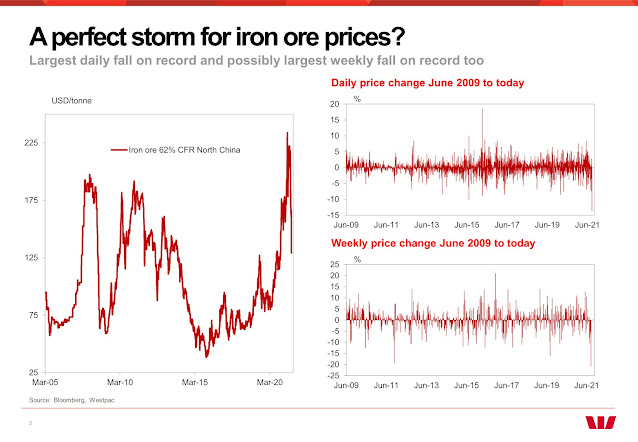
10k Words - September 2021 Equitable Investors 8 September 2021 Apparently, Confucius didn't say "One Picture is Worth Ten Thousand Words" after all. It was an advertisement in a 1920s trade journal for the use of images in advertisements on the sides of streetcars. Even without the credibility of Confucius behind it, we think this saying has merit. Each month we share a few charts or images we consider noteworthy. We kick off with Equitable Investors' updated study on the distribution of five year returns for ASX-listed industrials. The FT highlights the recent surge in global M&A activity. Leading electronics retailer JB Hi-Fi (JBH) suffered a decline in like-for-like sales amid COVID-19 lockdowns in eastern Australia, ending a long sequence of continual growth, as charted by Evans & Partners. And Wilsons shows how ASX stocks were divided into the winners and losers as the latest round of lockdowns in Sydney and Melbourne were initiated. Westpac highlights how volatile iron ore spot prices have become - at the same time the cost of shipping that ore has surged, as illustrated by a Bloomberg chart of the shipping benchmark the Baltic Exchange Dry Index. Finally, Hussman Funds reckons the ratio of non-financial market capitalization to corporate gross value-added (MarketCap/GVA) is "the single most reliable valuation measure we've introduced over time, based on its correlation with actual subsequent market returns across history".
Distribution of five year total returns for ASX industrials
Source: Equitable Investors, Sentieo Worldwide M&A
Source: FT.com, Refinitiv Like-for-like sales growth for JB Hi-Fi (JBH) & subsidiary The Good Guys turns negative
Source: Evans & Partners ASX COVID-19 winners v. losers Source: Wilsons Largest daily fall on record for iron ore spot market - and largest weekly fall too
Source: Westpac Baltic Exchange Dry Index
Source: Bloomberg US market cap / gross value add for non-financials v subsequent 12-year S&P 500 returns Source: Hussman Funds US market cap / gross value add for non-financials Source: Hussman Funds Disclaimer Nothing in this blog constitutes investment advice - or advice in any other field. Neither the information, commentary or any opinion contained in this blog constitutes a solicitation or offer by Equitable Investors Pty Ltd (Equitable Investors) or its affiliates to buy or sell any securities or other financial instruments. Nor shall any such security be offered or sold to any person in any jurisdiction in which such offer, solicitation, purchase, or sale would be unlawful under the securities laws of such jurisdiction. The content of this blog should not be relied upon in making investment decisions.Any decisions based on information contained on this blog are the sole responsibility of the visitor. In exchange for using this blog, the visitor agree to indemnify Equitable Investors and hold Equitable Investors, its officers, directors, employees, affiliates, agents, licensors and suppliers harmless against any and all claims, losses, liability, costs and expenses (including but not limited to legal fees) arising from your use of this blog, from your violation of these Terms or from any decisions that the visitor makes based on such information. This blog is for information purposes only and is not intended to be relied upon as a forecast, research or investment advice. The information on this blog does not constitute a recommendation, offer or solicitation to buy or sell any securities or to adopt any investment strategy. Although this material is based upon information that Equitable Investors considers reliable and endeavours to keep current, Equitable Investors does not assure that this material is accurate, current or complete, and it should not be relied upon as such. Any opinions expressed on this blog may change as subsequent conditions vary. Equitable Investors does not warrant, either expressly or implied, the accuracy or completeness of the information, text, graphics, links or other items contained on this blog and does not warrant that the functions contained in this blog will be uninterrupted or error-free, that defects will be corrected, or that the blog will be free of viruses or other harmful components.Equitable Investors expressly disclaims all liability for errors and omissions in the materials on this blog and for the use or interpretation by others of information contained on the blog Funds operated by this manager: |
.jpg)
.jpg)
.jpg)
.png)
.jpg)
.png)
.png)

13 Sep 2021 - Performance Report: Cyan C3G Fund
| Report Date | |
| Manager | |
| Fund Name | |
| Strategy | |
| Latest Return Date | |
| Latest Return | |
| Latest 6 Months | |
| Latest 12 Months | |
| Latest 24 Months (pa) | |
| Annualised Since Inception | |
| Inception Date | |
| FUM (millions) | |
| Fund Overview | Cyan C3G Fund is based on the investment philosophy which can be defined as a comprehensive, clear and considered process focused on delivering growth. These are identified through stringent filter criteria and a rigorous research process. The Manager uses a proprietary stock filter in order to eliminate a large proportion of investments due to both internal characteristics (such as gearing levels or cash flow) and external characteristics (such as exposure to commodity prices or customer concentration). Typically, the Fund looks for businesses that are one or more of: a) under researched, b) fundamentally undervalued, c) have a catalyst for re-rating. The Manager seeks to achieve this investment outcome by actively managing a portfolio of Australian listed securities. When the opportunity to invest in suitable securities cannot be found, the manager may reduce the level of equities exposure and accumulate a defensive cash position. Whilst it is the company's intention, there is no guarantee that any distributions or returns will be declared, or that if declared, the amount of any returns will remain constant or increase over time. The Fund does not invest in derivatives and does not use debt to leverage the Fund's performance. However, companies in which the Fund invests may be leveraged. |
| Manager Comments | The fund's Sortino ratio (which excludes volatility in positive months) has ranged from a high of 1.38 for performance over the most recent 12 months to a low of 0.28 over the latest 36 months, and is 1.25 for performance since inception. By contrast, the ASX Small Ordinaries Total Return Index's Sortino for performance since August 2014 is 0.72. The fund's down-capture ratio for returns since inception is 51.75%. Over all other periods, the fund's down-capture ratio has ranged from a high of 123.68% over the most recent 12 months to a low of 79.59% over the latest 60 months. A down-capture ratio less than 100% indicates that, on average, the fund has outperformed in the market's negative months over the specified period. |
| More Information |

13 Sep 2021 - Performance Report: DS Capital Growth Fund
| Report Date | |
| Manager | |
| Fund Name | |
| Strategy | |
| Latest Return Date | |
| Latest Return | |
| Latest 6 Months | |
| Latest 12 Months | |
| Latest 24 Months (pa) | |
| Annualised Since Inception | |
| Inception Date | |
| FUM (millions) | |
| Fund Overview | The investment team looks for industrial businesses that are simple to understand; they generally avoid large caps, pure mining, biotech and start-ups. They also look for: - Access to management; - Businesses with a competitive edge; - Profitable companies with good margins, organic growth prospects, strong market position and a track record of healthy dividend growth; - Sectors with structural advantage and barriers to entry; - 15% p.a. pre-tax compound return on each holding; and - A history of stable and predictable cash flows that DS Capital can understand and value. |
| Manager Comments | The fund's returns over the past 12 months have been achieved with a volatility of 6.85% vs the index's 10.33%. The annualised volatility of the fund's returns since inception in January 2013 is 11.12% vs the index's 13.55%. Over all other periods, the fund's returns have been consistently less volatile than the index. The fund's Sharpe ratio has ranged from a high of 3.99 for performance over the most recent 12 months to a low of 1.01 over the latest 60 months, and is 1.33 for performance since inception. By contrast, the ASX 200 Total Return Index's Sharpe for performance since January 2013 is 0.67. Since inception in January 2013 in the months where the market was positive, the fund has provided positive returns 91% of the time, contributing to an up-capture ratio for returns since inception of 73.67%. Over all other periods, the fund's up-capture ratio has ranged from a high of 120.64% over the most recent 24 months to a low of 87.73% over the latest 60 months. An up-capture ratio greater than 100% indicates that, on average, the fund has outperformed in the market's positive months. The fund has a down-capture ratio for returns since inception of 45%. Over all other periods, the fund's down-capture ratio has ranged from a high of 73.41% over the most recent 36 months to a low of 15.64% over the latest 12 months. A down-capture ratio less than 100% indicates that, on average, the fund has outperformed in the market's negative months. |
| More Information |
13 Sep 2021 - To invest or not to invest in China?
|
To invest or not to invest in China? Robert Swift, Delft Partners September 2021 |
|
Investing in China remains a moral question, but to not invest now because of more government intervention and capricious legislation is illogical, since that would be to ignore the fact that these trends are clearly evident in other countries. More government, capricious and unexpected legislation to the apparent detriment of companies and shareholders, is now omnipresent as a global systemic risk to equity returns. Consequently, prepare for lower rates of profit growth and 'fatter' tails in your investment outcomes, even if you decide to never invest in China again. There are similarities between Xi Jinping's increasing intervention in the Chinese corporate sector and those by Western governments 1. Policy with social objectives (with a lack of awareness that the years of free money created the wealth inequality in the first place) 2. More taxation and worryingly more centrally directed capital allocation and subsidies (Tesla anyone?) 3. Penalising 'rentier capital' aka private savings 4. Population coercion to behave by scare tactics/messaging, and surveillance; China uses facial recognition software and 'social scores' (but you may care to read this: Amnesty - New York Police Facial Recognition Revealed) At least China has finally done something about moral hazard which would still seem to be prevalent in 'the West'. China Evergrande is 95% certain to default on over $80bn of bonds and we'll have to see how that pain gets allocated between locals and foreigners before making more judgements, but bankruptcy is part of capitalism, or it used to be. In this respect China is ahead of the US perhaps and certainly the Europeans in letting a failed enterprise actually fail. For those of you who think that China's decision making comes without due warning and therefore makes it too risky in which to invest, the second part of the US 'Infrastructure' bill, equal to a 3.5tln $ spend, will take 17 days (!) to debate. Obamacare took 9 months even with a significant Democrat majority, (which is not the case now) and FDR's programmes were spread over his first 2 terms - 8 years. The UK government recently announced hikes on national insurance and dividend tax increases in essentially a unilateral decision by the prime minister. The unelected European Central Bank has essentially decided both monetary and fiscal policy for Europe and the result has been less than stellar growth. The Euro remains a political construct not a valid economic one but it's an ideology akin to 'Mao thought' and so on we go regardless.
In short, governments everywhere are consulting less and intervening more quickly. Government exist to provide essential services but to also redress other imbalances dangerous to national cohesion - or they should. Currently imbalances are very evident in wealth inequality and the share of profits in the economy relative to wages. Using the US data (the best around) we can see from the chart below that corporate profits have been on a rising trend relative to wages. Since the consumers of the companies' products need money with which to buy them, this % allocation tends to oscillate around an average. If wages rise too quickly then companies become less profitable, can't invest and won't hire which the reduces wage growth. Vice versa. Sometimes a nudge is needed - the General Strikes in the 1920s, the Reagan, Thatcher, Laffer curve revolution of the late 1970s and the Schroeder reforms in Germany in the 1990s serve as examples.
Source: BEA, BLS This swing back to wages is needed and will come with the attendant ever bigger government. Don't blame government - blame companies that have indulged in such anti-social behaviour as zero contract hours, and paying no taxes while enjoying the legal protection, trained workforce, and infrastructure that other people's taxes have provided. Could this have been prevented in the last few years had companies perhaps not bought back stock to the tune of c$900bn p.a., significantly benefitting corporate executive share option schemes, and instead raised wages, increased re-investment and improved job security? This imbalance got a big tailwind from ZIRP aka "monetary policy for rich people", and so we would actually view this shift as much need rebalance because without the rebalance...economic distress causes revolutions and if you want examples checkout Wikipedia -The_Great_Wave Two final thoughts. Trickle-down economics is dead and as investors you should prepare for more government, National Industrial Polices, thus more inflation and taxation and lower returns from equities. Our advice is to focus on smaller companies since they are seldom directly in the firing line of legislation, find companies that do 'useful things' such as building a country's capital stock, look very closely at Japan which we think is both cheap and showing change for the good, and increase the volatility of returns if you do such things as portfolio optimisations. |
|
Funds operated by this manager: Delft Partners Global High Conviction Strategy, Delft Partners Asia Small Companies Strategy, Delft Partners Global Infrastructure Strategy |


13 Sep 2021 - The Outlook for China
|
One way or another China is always in the news. The current nervousness by some fund managers surrounding China is a reflection of the risks involved, while others see resulting lower prices as an opportunity. In this video Chris Gosselin explores both sides of the argument with Rob Swift from Delft Partners, Jack Dwyer from Conduit Capital, and Alex Pollak from Loftus Peak.
|