
NEWS

14 Oct 2021 - Performance Report: Bennelong Kardinia Absolute Return Fund
| Report Date | |
| Manager | |
| Fund Name | |
| Strategy | |
| Latest Return Date | |
| Latest Return | |
| Latest 6 Months | |
| Latest 12 Months | |
| Latest 24 Months (pa) | |
| Annualised Since Inception | |
| Inception Date | |
| FUM (millions) | |
| Fund Overview | There is a slight bias to large cap stocks on the long side of the portfolio, although in a rising market the portfolio will tend to hold smaller caps, including resource stocks, more frequently. On the short side, the portfolio is particularly concentrated, with stock selection limited by both liquidity and the difficulty of borrowing stock in smaller cap companies. Short positions are only taken when there is a high conviction view on the specific stock. The Fund uses derivatives in a limited way, mainly selling short dated covered call options to generate additional income. These typically have less than 30 days to expiry, and are usually 5% to 10% out of the money. ASX SPI futures and index put options can be used to hedge the portfolio's overall net position. The Fund's discretionary investment strategy commences with a macro view of the economy and direction to establish the portfolio's desired market exposure. Following this detailed sector and company research is gathered from knowledge of the individual stocks in the Fund's universe, with widespread use of broker research. Company visits, presentations and discussions with management at CEO and CFO level are used wherever possible to assess management quality across a range of criteria. |
| Manager Comments | The fund's returns over the past 12 months have been achieved with a volatility of 9.29% vs the index's 9.42%. The annualised volatility of the fund's returns since inception in May 2006 is 7.6% vs the index's 14.18%. Over all other periods, the fund's returns have been consistently less volatile than the index. The fund's down-capture ratio for returns since inception is 49.23%. Over all other periods, the fund's down-capture ratio has ranged from a high of 62.37% over the most recent 48 months to a low of 45.61% over the latest 24 months. A down-capture ratio less than 100% indicates that, on average, the fund has outperformed in the market's negative months over the specified period. |
| More Information |

14 Oct 2021 - Webinar Recording | Paragon
|
Webinar recording: Performance Update & Outlook
Funds operated by this manager: |
14 Oct 2021 - Sic Parvis Magna: Great Things from Small Beginnings

13 Oct 2021 - Performance Report: DS Capital Growth Fund
| Report Date | |
| Manager | |
| Fund Name | |
| Strategy | |
| Latest Return Date | |
| Latest Return | |
| Latest 6 Months | |
| Latest 12 Months | |
| Latest 24 Months (pa) | |
| Annualised Since Inception | |
| Inception Date | |
| FUM (millions) | |
| Fund Overview | The investment team looks for industrial businesses that are simple to understand, generally avoiding large caps, pure mining, biotech and start-ups. They also look for: - Access to management; - Businesses with a competitive edge; - Profitable companies with good margins, organic growth prospects, strong market position and a track record of healthy dividend growth; - Sectors with structural advantage and barriers to entry; - 15% p.a. pre-tax compound return on each holding; and - A history of stable and predictable cash flows that DS Capital can understand and value. |
| Manager Comments | The fund's down-capture ratio for returns since inception is 41.96%. Over all other periods, the fund's down-capture ratio has ranged from a high of 66.66% over the most recent 36 months to a low of -141.82% over the latest 12 months. A down-capture ratio less than 100% indicates that, on average, the fund has outperformed in the market's negative months over the specified period, and negative down-capture ratio indicates that, on average, the fund delivered positive returns in the months the market fell. The fund's Sharpe ratio has ranged from a high of 4.96 for performance over the most recent 12 months to a low of 1.04 over the latest 60 months, and is 1.35 for performance since inception. By contrast, the ASX 200 Total Return Index's Sharpe for performance since January 2013 is 0.65. |
| More Information |

13 Oct 2021 - Webinar | Premium China Funds Management
|
Premium China Funds Management: ESG and Asia - Oxymoron?
|
||||||||||||||||


13 Oct 2021 - New Funds on Fundmonitors.com
|
New Funds on Fundmonitors.com |
|
Below are some of the funds we've recently added to our database. Follow the links to view each fund's profile, where you'll have access to their offer documents, monthly reports, historical returns, performance analytics, rankings, research, platform availability, and news & insights. |
|
|
||||||||||||||||||||||||||||
| Ellerston Global Mid Small Cap Fund (Class A) | ||||||||||||||||||||||||||||
|
||||||||||||||||||||||||||||
|
||||||||||||||||||||||||||||
|
|
||||||||||||||||||||||||||||
|
||||||||||||||||||||||||||||
| View Profile | ||||||||||||||||||||||||||||
|
Want to see more funds? |
||||||||||||||||||||||||||||
|
Subscribe for full access to these funds and over 600 others |
||||||||||||||||||||||||||||


13 Oct 2021 - Active dividend income after the pandemic
|
Active dividend income after the pandemic: From 'pub with no beer' to multi-year growth outlook Michael Price, Ausbil Investment Management
|
|
The pandemic and the COVID sell-down, a potential nightmare scenario for income investors, has given us a real-life stress test in which some companies lost almost all revenue in a demand shock from which we are still unwinding. Michael Price, Portfolio Manager, Equity Income, answers your questions on how dividends changed in the pandemic, with some encouraging and valuable lessons on active dividend investing for the future. Q: Give us the 'elevator pitch' on what is happening in ASX dividends. A: In short and simple terms, the elevator pitch on dividends is as follows. The recent boom in resources as part of a mega-cycle in bulk and base metals, and battery materials has seen dividends from resources companies take share from the usually dominant banks. At the end of 2021, this expected to see resource dividends exceed bank dividend payments in 2021 and 2022, as illustrated in Chart 1. Chart 1: Banks ceded their traditional dividend dominance in 2020 (% of market dividends paid) Banks had a tough few years, and in the pandemic they had to cut (cancel in Westpac's case) dividends to help provision for potential bad and doubtful debts (which did not eventuate to anywhere near the level projected), as illustrated in Chart 2. The recent dividends show the switch to growth momentum in bank earnings as the economy surges. Chart 2: Bank dividends took a hit, but they are coming back Banks, resources companies and the broad market are now looking at multi-year earnings upgrades that we forecast will result in multi-year dividend upgrades. An active approach to dividends can optimise the opportunities this brings, including capturing more franking credits across the year from this fundamental earnings growth. Q: What do dividends look like compared to the past? A: The long-term average dividend yield for the S&P/ASX 200 over the last 20-years has been around 4% before adjusting for any franking credits. During this period, there have been two major dividend tail events. The first was the GFC, with COVID-19 the second, as illustrated in Chart 3. Chart 3: Dividend yields set for a rerate The GFC saw dividends per share fall some 30% as the world entered financial crisis, and the US suffered a major recession. Move forward a decade, and the pandemic of 2020 saw an even larger disruption, with dividends falling some 33% during COVID. The nature of the pandemic, which for many companies involved seeing their revenue line almost instantaneously run dry like 'a pub with no beer', impacted payout ratios through companies retaining earnings to fund the impact of COVID. This saw a general re-basing of dividends across the market in effected stocks, including banks, where APRA determined that banks should pay smaller dividends and retain additional capital for the purposes of provisioning. Contactus@ ausbil.com.au 2 Bank dividends 30% fall in GFC 3 Q: Why are dividends complicated, what are some of the considerations for investors? A: The old heuristics around which companies are income generators and who pays the best dividends are out the window as markets have become increasingly volatile, and many of the perennial 'dividend darlings' have been supplanted. An active approach to dividend investing is more important than ever, for a number of reasons. Firstly, dividends are paid almost every month of the year, as evidenced in Chart 4. A simple buy-and-hold strategy cannot maximise the spread of dividends and franking credits on offer across the calendar year. Chart 4: An active dividend strategy can find more dividends and more franking credits for investors across the year Secondly, stocks have become more volatile around reporting season, as illustrated in Chart 5. Understanding the underlying fundamentals of each company, and tactical allocation can help reduce the impact of this price volatility on overall portfolio value. Chart 5: An active dividend income approach can help manage volatility around reporting Q: So, what is your outlook for dividends in the coming years? A: We are at an interesting point in time, where monetary policy has seen yields across non-equity asset classes fall dramatically to lows they are expected to hold for a number of years. Relative to bond, credit and cash yields, the yield on equities (excluding any potential from capital gains) is relatively higher, as illustrated in Chart 6. Chart 6: Investors continue to look to equity yields as an anchor for income strategies While dividend yields fell away during the pandemic, they are showing recovery, as illustrated in Chart 6. Across 2020 and into early 2021, dividends across the year had fallen with lockdowns across Australia, and globally. The February 2021 half-year reporting season showed that company earnings were recovering on the back of a growing economy. As a result, the consensus outlook for dividends has also risen, showing growth not just for the coming year, but also into 2022 and 2023, as illustrated in Chart 7. Chart 7: Recovery and a new dividend growth story The two key sectors where we see the potential for earnings surprise are the banks and resources sectors. Banks, which offer primary exposure to a recovering economy, entered the pandemic after heavy barrage from the Hayne Inquiry and having already been sold down. The pandemic saw them sold down further on fears that the recession and COVID job losses would impact their lending books. All the banks provisioned majorly for the potential for credit loss, and APRA further enforced capital retention through limiting the dividends they were allowed to pay. Looking at the banks in the 2021 New Year, it was evident that the bad and doubtful debt experience was nowhere near predictions, and that the banks had over-provisioned for losses. With APRA allowing a return to more commercial dividend levels, and the economy resurging from the 2020 lows, we could see banks were in a position to reduce these provisions and grow their books further in a renewing real estate market. The result is that over the next few years, the unwind of this over-provisioning will see a rerating of earnings, ahead of the consensus expectation at the time we began up-weighting into banks. Metals and mining are in the midst of two fundamental themes in global resources investing. The first is the super-cycle demand for Australia's bulk commodities including iron ore, from China in terms of building and infrastructure demand, and as a function of the growth path of the world economy. This theme is expected to drive earnings in companies like BHP, Rio Tinto and Fortescue Metals. The second is the fundamental shift in the energy transition to renewable energy, and the rapid adoption of electric vehicles, which is sparking a secular demand for bulk, base and battery materials (copper, lithium, cobalt, zinc, manganese and rare earths) that is expected to last for decades, underwriting the fundamentals of a strong resources market. Ausbil has been overweight Banks and Resources (metals and mining) for some time. These overweights remain in place across our portfolios and have driven outperformance across our different strategies. Importantly, we are still in the early stages of the economic cycle, with a positive growth outlook for multiple years that is expected to drive performance in these megasectors. Taking in the broader economic context, Ausbil's view is that economies will run 'hot' for some time, with the support of policymakers, and are delivering the best growth figures since 1983, across a multi-year growth profile. While inflation will remain an ongoing source of worry as the perennial flipside to growth, it is important to understand whether inflation spikes are intermittent or if they are moves to a higher sustained level. It is our view, and indeed that of most global central banks, that inflation will not be a problem for some years as the world economy returns to health. Since the historic reversal in consensus across the February reporting season that saw the FY21 consensus earnings outlook for the broad market rebound from -1.6% to +15.6%, consensus earnings outlook for both indices has rerated to +22.5% (S&P/ASX 200) and +22.6% (S&P/ASX 300). While these earnings figures are strong, Ausbil's house view is that consensus is still underestimating the rebound in earnings that will occur in the prevailing economic conditions, with rates to remain low, and with the world economy providing a tailwind to Australia's current expansion. This will only further benefit the dividend payers on the market, and most benefit investors who are able to actively allocate to the best blend of dividend and franking credits across the market, across each month of the year. |
|
Funds operated by this manager: Ausbil 130/30 Focus Fund, Ausbil Australian Active Equity Fund, Ausbil Global SmallCap Fund, Ausbil MicroCap Fund |
|
DISCLAIMER Important Information: Australia, Canada, Denmark, Kuwait, Netherlands, Sweden, United Arab Emirates, USA, United Kingdom. General Research provided to a client may vary depending upon various factors such as a client's individual preferences as to the frequency and manner of receiving communications, a client's risk profile and investment focus and perspective (e.g., market wide, sector specific, long-term, short-term, etc.), the size and legal and regulatory constraints. This information is for distribution only as may be permitted by law. It is not directed to, or intended for distribution to or use by, any person or entity who is a citizen or resident of, or located, in any locality, state, country or other jurisdiction where such distribution, publication, availability or use would be contrary to law or regulation or would subject Ausbil to any registration or licensing requirement within such jurisdiction. This information is a general communication and is educational in nature; it is not an advertisement nor is it a solicitation or an offer to buy or sell any financial instruments or to participate in any particular trading strategy. Nothing in this document constitutes a representation that any investment strategy or recommendation is suitable or appropriate to an investor's individual circumstances or otherwise constitutes a personal recommendation. By providing this document, none of Ausbil or its representatives has any responsibility or authority to provide or have provided investment advice in a fiduciary capacity or otherwise. Investments involve risks, and investors should exercise prudence and their own judgment in making their investment decisions. None of Ausbil or its representatives is suggesting that the recipient or any other person take a specific course of action or any action at all. By receiving this document, the recipient acknowledges and agrees with the intended purpose described above and further disclaims any expectation or belief that the information constitutes investment advice to the recipient or otherwise purports to meet the investment objectives of the recipient. The financial instruments described in the document may not be eligible for sale in all jurisdictions or to certain categories of investors. The value of any investment or income may go down as well as up, and investors may not get back the full (or any) amount invested. Past performance is not necessarily a guide to future performance. Neither Ausbil nor any of its directors, employees or agents accepts any liability for any loss (including investment loss) or damage arising out of the use of all or any of the Information. Prior to making any investment or financial decisions, any recipient of this document or the information should take steps to understand the risk and return of the investment and seek individualised advice from his or her personal financial, legal, tax and other professional advisors that takes into account all the particular facts and circumstances of his or her investment objectives. Any prices stated in this document are for information purposes only and do not represent valuations for individual securities or other financial instruments. There is no representation that any transaction can or could have been effected at those prices, and any prices do not necessarily reflect Ausbil's internal books and records or theoretical model-based valuations and may be based on certain assumptions. Different assumptions by Ausbil or any other source may yield substantially different results. No representation or warranty, either expressed or implied, is provided in relation to the accuracy, completeness or reliability of the information contained in any materials to which this document relates (the "Information"), except with respect to Information concerning Ausbil. The Information is not intended to be a complete statement or summary of the securities, markets or developments referred to in the document. Ausbil does not undertake to update or keep current the Information. Any opinions expressed in this document may change without notice and may differ or be contrary to opinions expressed by other business areas or groups, personnel or other representative of Ausbil. Any statements contained in this Report attributed to a third party represent Ausbil's interpretation of the data, Information and/or opinions provided by that third party either publicly or through a subscription service, and such use and interpretation have not been reviewed by the third party. In no circumstances may this document or any of the Information (including any forecast, value, index or other calculated amount ("Values")) be used for any of the following purposes: (i) valuation or accounting purposes; (ii) to determine the amounts due or payable, the price or the value of any financial instrument or financial contract; or (iii) to measure the performance of any financial instrument including, without limitation, for the purpose of tracking the return or performance of any Values or of defining the asset allocation of portfolio or of computing performance fees. By receiving this document and the Information you will be deemed to represent and warrant to Ausbil that you will not use this document or any of the Information for any of the above purposes or otherwise rely upon this document or any of the Information. Except as otherwise specified herein, these materials are distributed by Ausbil, to persons who are eligible counterparties or professional clients and are only available to such persons. The Information does not apply to, and should not be relied upon by, retail clients. The information contained in this document is given by Ausbil Investment Management Limited (ABN 2676316473) (AFSL 229722) (Ausbil) and has been prepared for informational and discussion purposes only and does not constitute an offer to sell or solicitation of an offer to purchase any security or financial product or service. Any such offer or solicitation shall be made only pursuant to an Australian Product Disclosure Statement or other offer document (collectively Offer Document) relating to an Ausbil financial product or service. A copy of the relevant Offer Document may be obtained by calling Ausbil on +612 9259 0200 or by visiting www.ausbil.com.au. You should consider the Offer Documents in deciding whether to acquire, or continue to hold, any financial product. This document is for general use only and does not take into account your personal investment objectives, financial situation and particular needs. Ausbil strongly recommends that you consider the appropriateness of the information and obtain independent financial, legal and taxation advice before deciding whether to invest in an Ausbil financial product or service. The information provided by Ausbil has been done so in good faith and has been derived from sources believed to be accurate at the time of completion. While every care has been taken in preparing this information. Ausbil make no representation or warranty as to the accuracy or completeness of the information provided in this video, except as required by law, or takes any responsibility for any loss or damage suffered as a result or any omission, inadequacy or inaccuracy. Changes in circumstances after the date of publication may impact on the accuracy of the information. Ausbil accepts no responsibility for investment decisions or any other actions taken by any person on the basis of the information included. Past performance is not a reliable indicator of future performance. Ausbil does not guarantee the performance of any strategy or fund or the securities of any other entity, the repayment of capital or any particular rate of return. The performance of any strategy or fund depends on the performance of its underlying investments which can fall as well as rise and can result in both capital gains and losses. Canada This document does not pertain to the offering of any securities. This document is not, and under no circumstances is to be construed as, an advertisement or a public offering of the securities described in Canada. No securities commission or similar authority in Canada has reviewed or in any way passed upon this document or the merits of the securities, and any representation to the contrary is an offence. Sweden The information contained in the document is given by Ausbil and has been prepared for information and discussion purposes only and does not constitute an offer to sell or solicitation of an offer to purchase any security or financial product or service. It is provided to you as an institutional investor as that term is understood under Swedish law. By reading this document, you agree to be bound by these limitations, terms and conditions set out in the paragraphs above. United Arab Emirates & Kuwait This information relates to a Fund which is not subject to any form of regulation or approval by the Dubai Financial Services Authority ("DFSA"). The DFSA has no responsibility for reviewing or verifying any Prospectus or other documents in connection with this Fund. Accordingly, the DFSA has not approved this or any other associated documents nor taken any steps to verify the information set out in this Prospectus, and has no responsibility for it. The Units to which this Report relates may be illiquid and/or subject to restrictions on their resale. Prospective purchasers should conduct their own due diligence on the Units If you do not understand the contents of this document you should consult an authorized financial adviser. This information does not constitute or form part of any offer to issue or sell, or any solicitation of any offer to subscribe for or purchase, any securities or investment products in Kuwait, UAE (including the Dubai International Financial Centre) and accordingly should not be construed as such. Furthermore, this information is being made available on the basis that the recipient acknowledges and understands that the entities and securities to which it may relate have not been approved, licensed by or registered with the UAE Central Bank, the UAE Securities & Commodities Authority, the Dubai Financial Services Authority or any other relevant licensing authority or governmental agency in the UAE. The content of this Report has not been approved by or filed with the CBK, UAE Central Bank, the UAE Securities & Commodities Authority or Dubai Financial Services Authority. United Kingdom This information may be issued in the United Kingdom to, and/or is directed at, only persons to or at whom it may lawfully be issued, or directed under the Financial Services and Markets Act 2000 (Financial Promotion) Order 2005 (as amended) including persons who are authorised under the Financial Services and Markets Act 2000 ("FSMA"), certain persons having professional experience in matters relating to investments, high net worth companies, high net worth unincorporated associations or partnerships, or trustees of high value trusts. The services described in it are only available to such persons in the United Kingdom and this document must not be relied or acted upon by any other persons in the United Kingdom. By reading this document, you agree to be bound by these limitations, terms and conditions set out in the paragraphs above. Australia The information contained in this Report has been prepared for general use only and does not take into account your personal investment objectives, financial situation or particular needs. Ausbil is the issuer of the Ausbil Australian Active Equity Fund (ARSN 089 996 127), Ausbil Australian Geared Equity Fund (ARSN 124 196 407), Ausbil Australian Emerging Leaders Fund (ARSN 089 995 442), Ausbil MicroCap Fund (ARSN 130 664 872), Ausbil Australian SmallCap Fund (ARSN 630 022 909), Ausbil Balanced Fund (ARSN 089 996 949), Ausbil Active Dividend Income Fund (ARSN 621 670 120), Ausbil Australian Concentrated Fund (ARSN 622 627 696), Ausbil Active Sustainable Equity Fund (ARSN 623 141 784), Ausbil Global SmallCap Fund (ARSN 623 619 625), Candriam Sustainable Global Equity Fund (ARSN 111 733 898), Ausbil 130/30 Focus Fund (ARSN 124 196 621), Ausbil Long Short Focus Fund (ARSN 642 635 498), Ausbil Global Essential Infrastructure Fund (ARSN 628 816 151), Ausbil Global Resources Fund (ARSN 623 619 590) and MacKay Shields Multi-Sector Bond Fund (ARSN 611 482 243) (collectively known as 'the Funds').The information provided is factual only and does not constitute financial product advice. It does not take account of your individual objectives, financial situation or needs. Before you make any decision about whether to invest in a financial product, you should obtain and consider the Product Disclosure Statement of the financial product. The information provided by Ausbil Investment Management Limited (ABN 26 076 316 473 AFSL 229722) has been done so in good faith and has been derived from sources believed to be accurate at the time of compilation. Changes in circumstances, including unlawful interference and unauthorised tampering, after the date of publication may impact on the accuracy of the information. Ausbil Investment Management Limited accepts no responsibility for any inaccuracy or for investment decisions or any other actions taken by any person on the basis of the information included. Past performance is not a reliable indicator of future performance. Ausbil Investment Management Limited does not guarantee the performance of the Funds, the repayment of capital or any particular rate of return. The performance of any unit trust depends on the performance of its underlying investment which can fall as well as rise and can result in both capital losses and gains. Consequently, due to market influences, no assurance can be given that all stated objectives will be achieved. United States AN INVESTMENT IN THE FUND IS SPECULATIVE AND INCLUDES A HIGH DEGREE OF RISK, INCLUDING THE RISK OF A TOTAL LOSS OF CAPITAL. INTERESTS IN THE FUND WILL BE ILLIQUID AND SUBJECT TO SIGNIFICANT RESTRICTIONS ON TRANSFER. PROSPECTIVE INVESTORS SHOULD BE AWARE THAT THEY MAY BE REQUIRED TO BEAR THE RISKS ASSOCIATED WITH SUCH INVESTMENT FOR AN INDEFINITE PERIOD OF TIME. A PRIVATE OFFERING OF INTERESTS IN THE FUND WILL ONLY BE MADE PURSUANT TO THE FUND'S PRODUCT DISCLOSURE STATEMENT (THE "PDS"), AND RELATED DOCUMENTATION FOR THE FUND, WHICH WILL BE FURNISHED TO QUALIFIED INVESTORS ON A CONFIDENTIAL BASIS AT THEIR REQUEST FOR THEIR CONSIDERATION IN CONNECTION WITH SUCH OFFERING, WHO SHOULD CAREFULLY REVIEW SUCH DOCUMENTS PRIOR TO MAKING AN INVESTMENT DECISION. ANY INVESTMENT DECISION WITH RESPECT TO SUCH INTERESTS MUST BE BASED SOLELY ON THE DEFINITIVE AND FINAL VERSIONS OF SUCH DOCUMENTS. The information contained herein will be superseded by, and is qualified in its entirety by reference to the PDS, which contains additional information about the investment objective, terms and conditions of an investment in the Fund and also contains tax information, information regarding conflicts of interest and risk disclosures that are important to any investment decision regarding the Fund. No person has been authorized to make any statement concerning the Fund other than as set forth in the PDS and any such statements, if made, may not be relied upon. The information contained in this Report must be kept strictly confidential and may not be reproduced (in whole or in part) or redistributed in any format without the express written approval of AUSBIL INVESTMENT MANAGEMENT LIMITED (together with its affiliates, the "Firm"). Neither the Firm nor any of its affiliates makes any representation or warranty, express or implied, as to the accuracy or completeness of the information contained herein and nothing contained herein should be relied upon as a promise or representation as to past of future performance of the Fund or any other entity. Except where otherwise indicated herein, the information provided in this Report is based on matters as they exist as of the date of the document and not as of any future date, and will not be updated or otherwise revised to reflect information that subsequently becomes available, or circumstances existing or changes occurring after the date hereof. This Report has not been approved by the U.S. Securities and Exchange Commission (the "SEC"), the Financial Industry Regulatory Authority ("FINRA"), or any other regulatory authority or securities commission in the United States or elsewhere and does not constitute an offer to sell, or a solicitation of any offer to buy, any securities. This Report is not to be relied upon as investment, legal, tax, or financial advice. Any investor must consult with his or her independent professional advisors as to the investment, legal, tax, financial or other matters relevant to the suitability of an investment in the interests of the Fund. The reader is urged to read the sections in the PDS addressing risk factors, conflicts of interest and other relevant investment considerations. The Interests may not be transferred or resold except as permitted under the Securities Act and any applicable U.S. or non-U.S. securities laws. The Interests have not been reviewed or approved by any U.S. federal, other U.S. or non-U.S. securities commission or regulatory authority. Interests are not and will not be insured by the U.S. Federal Deposit Insurance Company or any government agency, are not guaranteed by any bank and are subject to investment risks, including the loss of an investor's entire principal amount invested. Investors should be aware that they may be required to bear the financial risks of an investment in the Interests for an indefinite period of time because the Interests (i) cannot be sold unless they are subsequently registered under any and all applicable securities laws in the United States, or an exemption from registration exists and (ii) are subject to the restrictions on transfer contained in the offering document or limited partnership agreement of the Fund. The reader must comply with all applicable laws and regulations in any jurisdiction in which it subscribes for an investment; and the reader, by its acceptance of this report, agrees that the Firm and the Fund will not have any responsibility for the reader's compliance with such laws and regulations. The Firm is registered as an investment adviser with the U.S. Securities & Exchange Commission. Certain information contained in this Report constitutes "forward-looking statements," which can be identified by the use of forward-looking terminology such as "may," "will," "should," "expect," "anticipate," "target," "project," "estimate," "intend," "continue" or "believe," or the negatives thereof or other variations thereon or comparable terminology. Due to various uncertainties and risks, actual results and performance of the Fund may differ materially from those reflected or contemplated in such forward-looking statements A short notice on the COVID-19 public health event, and how it can impact investments Given the currently evolving issues around the Coronavirus (or Covid-19) globally, which has officially been designated a pandemic by the World Health Organisation, we wish to notify that, as with many firms, business may be disrupted. A public health crisis, pandemic, epidemic or outbreak of a contagious disease, such as the recent outbreak of Coronavirus (or Covid-19) in Australia, Italy, China, South Korea, the United States and other countries, could have an adverse impact on global, national and local economies, which in turn could negatively impact investment returns in any of Ausbil Investment Management Limited's registered managed investment schemes (the Funds). Disruptions to commercial activity relating to the imposition of quarantines or travel restrictions (or more generally, an inability on behalf of authorities to contain this pandemic) may adversely impact any investment, including by delaying or causing supply chain disruptions or by causing staffing shortages. The outbreak of Coronavirus has contributed to, and may continue to contribute to, volatility in financial markets. The impact of a public health crisis such as the Coronavirus (or any future pandemic, epidemic or outbreak of a contagious disease) is difficult to predict, which presents material uncertainty and risk with respect to any investment or fund performance. |

12 Oct 2021 - Performance Report: Bennelong Concentrated Australian Equities Fund
| Report Date | |
| Manager | |
| Fund Name | |
| Strategy | |
| Latest Return Date | |
| Latest Return | |
| Latest 6 Months | |
| Latest 12 Months | |
| Latest 24 Months (pa) | |
| Annualised Since Inception | |
| Inception Date | |
| FUM (millions) | |
| Fund Overview | The portfolio typically consists of 20-35 high-conviction stocks from the S&P/ASX 300 Index. The Fund may invest in securities listed on other exchanges where such securities relate to ASX-listed securities. Derivative instruments are mainly used to replicate underlying positions and hedge market and company specific risks. |
| Manager Comments | The fund's returns over the past 12 months have been achieved with a volatility of 9.08% vs the index's 9.42%. The annualised volatility of the fund's returns since inception in February 2009 is 14.91% vs the index's 13.48%. Over all other periods, the fund's returns have been more volatile than the index. Since inception in February 2009 in the months where the market was positive, the fund has provided positive returns 92% of the time, contributing to an up-capture ratio for returns since inception of 164.56%. Over all other periods, the fund's up-capture ratio has ranged from a high of 154.9% over the most recent 24 months to a low of 126.7% over the latest 12 months. An up-capture ratio greater than 100% indicates that, on average, the fund has outperformed in the market's positive months over the specified period. |
| More Information |

12 Oct 2021 - Misunderstood Multiples
|
Misunderstood Multiples Amit Nath, Montaka Global Investments September 2021
This is one of the most used and repeated phrases of market commentary. In fact, multiples are probably the most enduring pieces of investment analysis of all time. Unfortunately, they are often completely useless. The law of the instrument, or 'Maslow's hammer', is a cognitive bias where people rely too much on a familiar tool. The renowned American phycologist, Abraham Maslow, articulated this concept with his hammer and nail metaphor -
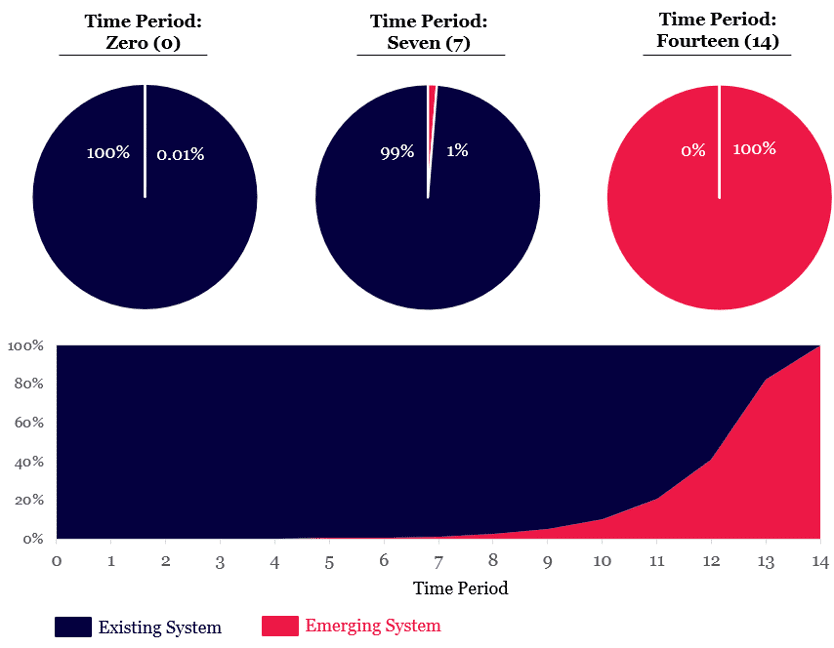
Multiples are a short-cut, lazy approximation for valuing a business For many market commentators and armchair enthusiasts, valuation multiples are their Maslow's hammer, and they apply it indiscriminately - perhaps because it is the only valuation tool they possess in their toolkit. Valuation multiples are a simplified, abbreviated and short-cut methodology for thinking about the value of a company. They blindly take a company's price (market cap, enterprise value) and divide it by a fundamental metric (revenue, operating income, EPS, etc). But they don't tell the whole story or give a complete picture of underlying value and are prone to sizeable error when applied in isolation. And, sadly, multiples have never been less useful than they are today. If investors can understand how multiples can mislead, and how to value companies in this new complex market, they will be better placed to identify and ride 'multi-decade compounders' - the current and next generation of Amazons and Microsofts that build massive long-term wealth. Multiples were not designed for today's world For traditional valuation multiples to be effective, a company needs stable and predictable cash-flows, which are generally found in mature industries like utilities, real-estate and infrastructure. Multiples do a poor job of valuing privileged businesses models that have advantaged economics, including barriers to entry, network effects, and unique datasets. They also fail to reflect the value of emerging opportunities (aka real options) embedded in the world's best businesses, including the likes of Facebook's AR/VR platform and Alphabet's AI unit. Multiples provide an inadequate view when companies have high and relatively sustained growth rates, particularly for the world's best software-driven ecosystems like Microsoft, Google, Amazon or in the alternative asset management space, like Blackstone, KKR, and Carlyle. Basically, multiples simply break down when investors are analyzing a disruptive company in the midst of an inflection or an industry that is adapting to a new world, a world we are seeing across myriad of sectors such as technology, healthcare, financials, transportation, and energy. The problem: Humans are very bad at exponential thinking The core of the problem can be traced back to the fact that humans are very bad at exponential thinking. We prefer to use a simplifying linear concept (like a multiple) for a more complex non-linear concept (high growth business). But we lose information, and that mapping mismatch can lead to errors and ultimately incorrect conclusions. Google's world-renowned futurist and Director of Engineering, Raymond Kurzweil, believes humans are linear thinkers by nature, whereas technology, biology and our environment are often exponential. That, he says, creates enormous blind spots when we pursue higher-order thinking and seek to solve increasingly complex problems. Let's consider a simple thought experiment often sighted as Kurzweil's 'law of exponential doublings'. It takes seven doublings to go from 0.01% to 1%, and then seven more doublings to go from 1% to 100%. So within 14 time periods an emerging system has gone from being completely invisible in the linear world (0.01%), to entirely encompassing it (100%). The Covid-19 pandemic and the exponential spread of the virus gave us a real-world look at what exponential growth feels like as our lives were significantly disrupted. Yet most of us are simply not built to intuitively reconcile this phenomenon. Visualizing exponential growth through doublings
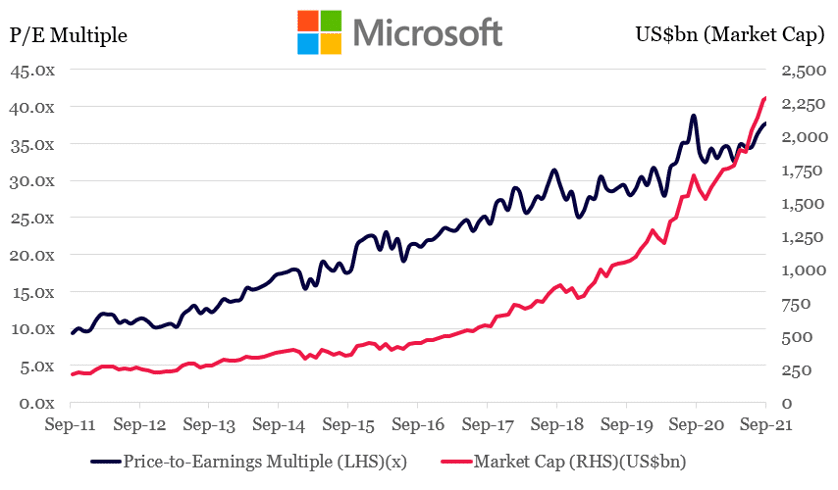
Source: Montaka Multiples meant investors missed massive Microsoft gainsMicrosoft is an example of a company where the use of multiples fail. For the last decade the company has been consistently criticized by some investors for having an 'extremely high multiple' and is on the verge of a sharp pull-back. This narrative continues to persist in parts of the market even today. Yet Microsoft's multiple has consistently expanded for the entirety of that time. A linear conversation about Microsoft's multiple ignores several underlying drivers of Microsoft's valuation, from its virtual monopoly in enterprise computing (Windows), strangle hold on productivity applications (Office), to the enormous opportunity ahead of its cloud business (Azure). Some six years ago Azure was an invisible real option within Microsoft. But it certainly feels pretty real today after growing from basically zero revenue to an estimated $40 billion annualized run-rate (June-2021). Azure continues to grow at around 40-50% year on year with enormous runway ahead. It demonstrates the exponential growth that many investors still struggle to believe or comprehend. Another fallacy those decrying Microsoft's 'high multiple' is that its market capitalization gains have been entirely driven by multiple expansion and the low-interest-rate environment. Those factors certainly play a role, but multiple expansion only explains a third of Microsoft's value gains. While Microsoft's multiple has expanded four-fold over the last decade, its market cap has increased nearly eleven-fold during that time - driven by a massive earnings inflection and exponential growth within the Azure business. That's an extremely significant error produced by the unhelpful market heuristic of multiples. Entrenched habits and lazy analysis have a very long-tail and multiples are a seductive short-cut. Microsoft's multiple has expanded for a decade
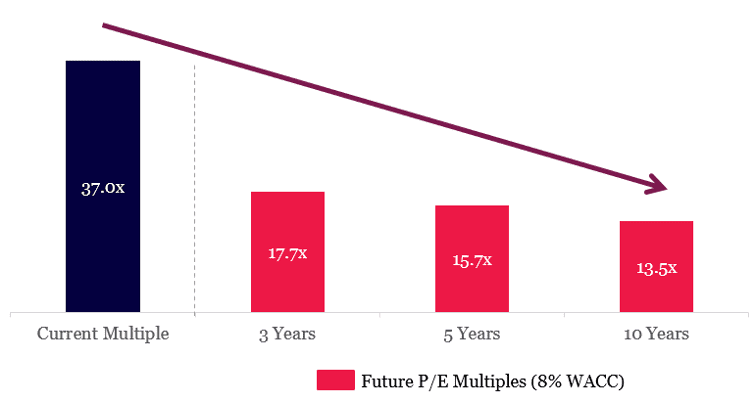
Source: Bloomberg, Montaka How to value companies in today's complex marketSo if multiples mislead, how do investors value companies in this new environment? The truth is, there are no short-cuts in valuing a business. It is a hard, detailed, and rigorous exercise that takes considerable time and insight to get right. At Montaka, all our investment theses are fundamentally driven and while not an exhaustive list, we look to gain insights across the following areas: - Detailed, bottoms-up, DCF (discounted cash flow) assessment of each company we invest in with an exploration of business model economics, TAM (total addressable market), competition, etc - Top-down perspective of the markets the company currently serves and potentially will serve in the future - Considerable time is spent considering what the business and industry will look like in 5 to 10 years and what challenges / opportunities may be encountered (this is a never-ending cycle of course) - We also establish a set of valuation scenarios that are weighted by the probability of the scenario being reached. They guide our view around upside and downside, and color our level of conviction in the position. We then effectively take a 'time machine' to several points in the future. For each time period we observe the multiple our valuation implies. This helps us check whether we are being too conservative, or too exuberant relative to what the market is willing to pay for the business today. In fact we often find instances where our DCF has compressed multiples in an unreasonable way or the market is being too conservative with its current price level. Get comfortable with high multiplesIf we continue with Microsoft as an example. The current share price (US$300) implies the market is being extraordinarily bearish on the Azure cloud business, and also believes Microsoft's future multiple will materially compress over the coming decade. We strongly disagree with the market's assessment on both fronts and believe it is significantly underestimating Microsoft's earnings potential and opportunity set, plus unreasonably discounts the quality of these earnings by slashing its multiple by more than half. In fact, under our bullish scenarios, we believe Microsoft's share price could increase several fold, even from here. Significant multiple compression implied by current share price
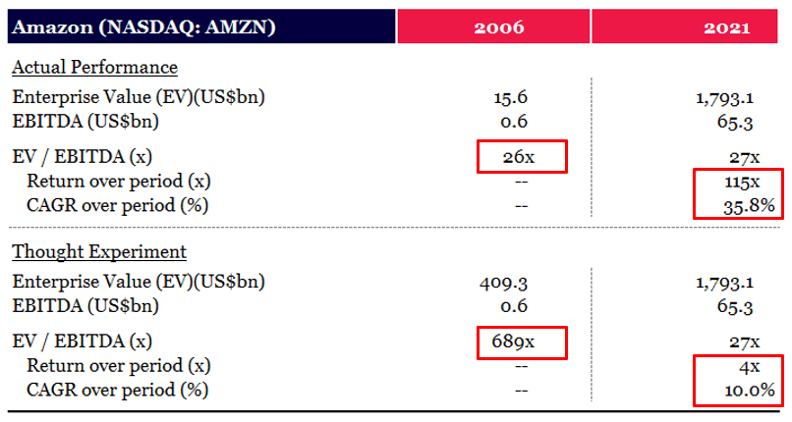
Source: Montaka Compounding your wealth over decadesWhen an investor looks at a multiple, it may seem high at first glance. But it is essential to focus beyond this and understand the underlying business, its growth opportunities and what current market expectations imply. Certainly, a high multiple can be a red flag for overvaluation. However, in isolation an investor can't draw any real conclusions from that multiple. As we've seen, in certain situations the current multiple may be outrageously low despite the incessant noise claiming the opposite. Let look at Amazon for example, in 2006, it was trading at an EBITDA multiple of 26x versus the market (S&P 500) which was trading at 10x. Certainly not cheap by typical measures. But as a thought experiment, if we were to discount the current Amazon enterprise value at an annual rate of 10% back to 2006, an investor should have willing to pay close to 690x EBITDA and they still would have quadrupled their money today. The market, however, materially undervalued Amazon and it went on to deliver investors 115x over that period. In fact, you could have paid double the share price for Amazon in 2006 and still made nearly 60x your money today.
Source: Montaka. Based on June-2021 LTM earnings for 2021 column. At Montaka we have a single clear goal: to maximize the probability of achieving multi-decade compounding of our clients' wealth, alongside our own. We are convinced that the months and years ahead will present opportunities to make attractive, multi-generational investments and we are prepared and well-positioned to take advantage of these. To achieve that, we won't let multiples become our Maslow's hammer! Funds operated by this manager: Montaka Global 130/30 Fund, Montaka Global Fund, Montaka Global Long Only Fund |

11 Oct 2021 - Performance Report: Collins St Value Fund
| Report Date | |
| Manager | |
| Fund Name | |
| Strategy | |
| Latest Return Date | |
| Latest Return | |
| Latest 6 Months | |
| Latest 12 Months | |
| Latest 24 Months (pa) | |
| Annualised Since Inception | |
| Inception Date | |
| FUM (millions) | |
| Fund Overview | The managers of the fund intend to maintain a concentrated portfolio of investments in ASX listed companies that they have investigated and consider to be undervalued. They will assess the attractiveness of potential investments using a number of common industry based measures, a proprietary in-house model and by speaking with management, industry experts and competitors. Once the managers form a view that an investment offers sufficient upside potential relative to the downside risk, the fund will seek to make an investment. If no appropriate investment can be identified the managers are prepared to hold cash and wait for the right opportunities to present themselves. |
| Manager Comments | Since inception in February 2016 in the months where the market was negative, the fund has provided positive returns 67% of the time, contributing to a down-capture ratio for returns since inception of 26.11%. Over all other periods, the fund's down-capture ratio has ranged from a high of 66.25% over the most recent 24 months to a low of -370.51% over the latest 12 months. A down-capture ratio less than 100% indicates that, on average, the fund has outperformed in the market's negative months over the specified period, and negative down-capture ratio indicates that, on average, the fund delivered positive returns in the months the market fell. The fund's Sortino ratio (which excludes volatility in positive months) has ranged from a high of 28.96 for performance over the most recent 12 months to a low of 1.28 over the latest 48 months, and is 1.47 for performance since inception. By contrast, the ASX 200 Total Return Index's Sortino for performance since February 2016 is 0.95. |
| More Information |