NEWS

22 Oct 2021 - Hedge Clippings | 22 October 2021
|
||||||
|
If you'd like to receive Hedge Clippings direct to your inbox each Friday
|


22 Oct 2021 - Performance Report: Paragon Australian Long Short Fund
| Report Date | |
| Manager | |
| Fund Name | |
| Strategy | |
| Latest Return Date | |
| Latest Return | |
| Latest 6 Months | |
| Latest 12 Months | |
| Latest 24 Months (pa) | |
| Annualised Since Inception | |
| Inception Date | |
| FUM (millions) | |
| Fund Overview | Paragon's unique investment style, comprising thematic led idea generation followed with an in depth research effort, results in a concentrated portfolio of high conviction stocks. Conviction in bottom up analysis drives the investment case and ultimate position sizing: * Both quantitative analysis - probability weighted high/low/base case valuations - and qualitative analysis - company meetings, assessing management, the business model, balance sheet strength and likely direction of returns - collectively form Paragon's overall view for each investment case. * Paragon will then allocate weighting to each investment opportunity based on a risk/reward profile, capped to defined investment parameters by market cap, which are continually monitored as part of Paragon's overall risk management framework. The objective of the Paragon Fund is to produce absolute returns in excess of 10% p.a. over a 3-5 year time horizon with a low correlation to the Australian equities market. |
| Manager Comments | Since inception in March 2013 in the months where the market was positive, the fund has provided positive returns 69% of the time, contributing to an up-capture ratio for returns since inception of 113.09%. Over all other periods, the fund's up-capture ratio has ranged from a high of 267.14% over the most recent 24 months to a low of 119.58% over the latest 60 months. An up-capture ratio greater than 100% indicates that, on average, the fund has outperformed in the market's positive months. The fund has a down-capture ratio for returns since inception of 73.98%. Over all other periods, the fund's down-capture ratio has ranged from a high of 115.18% over the most recent 24 months to a low of -7.03% over the latest 12 months. A negative down-capture ratio indicates that, on average, the fund delivered positive returns in the months the market fell over the specified period. |
| More Information |

22 Oct 2021 - Performance Report: Quay Global Real Estate Fund
| Report Date | |
| Manager | |
| Fund Name | |
| Strategy | |
| Latest Return Date | |
| Latest Return | |
| Latest 6 Months | |
| Latest 12 Months | |
| Latest 24 Months (pa) | |
| Annualised Since Inception | |
| Inception Date | |
| FUM (millions) | |
| Fund Overview | The Fund will invest in a number of global listed real estate companies, groups or funds. The investment strategy is to make investments in real estate securities at a price that will deliver a real, after inflation, total return of 5% per annum (before costs and fees), inclusive of distributions over a longer-term period. The Investment Strategy is indifferent to the constraints of any index benchmarks and is relatively concentrated in its number of investments. The Fund is expected to own between 20 and 40 securities, and from time to time up to 20% of the portfolio maybe invested in cash. The Fund is $A un-hedged. |
| Manager Comments | The fund's returns over the past 12 months have been achieved with a volatility of 10.98% vs the index's 11.87%. The annualised volatility of the fund's returns since inception in January 2016 is 11.97% vs the index's 12.9%. Over all other periods, the fund's returns have been consistently less volatile than the index. Since inception in January 2016 in the months where the market was positive, the fund has provided positive returns 90% of the time, contributing to an up-capture ratio for returns since inception of 106.57%. Over all other periods, the fund's up-capture ratio has ranged from a high of 107.92% over the most recent 60 months to a low of 97.02% over the latest 36 months. An up-capture ratio greater than 100% indicates that, on average, the fund has outperformed in the market's positive months. The fund has a down-capture ratio for returns since inception of 85.74%. Over all other periods, the fund's down-capture ratio has ranged from a high of 82.87% over the most recent 60 months to a low of 65.3% over the latest 12 months. A down-capture ratio less than 100% indicates that, on average, the fund has outperformed in the market's negative months over the specified period. |
| More Information |

22 Oct 2021 - Performance Report: Insync Global Quality Equity Fund
| Report Date | |
| Manager | |
| Fund Name | |
| Strategy | |
| Latest Return Date | |
| Latest Return | |
| Latest 6 Months | |
| Latest 12 Months | |
| Latest 24 Months (pa) | |
| Annualised Since Inception | |
| Inception Date | |
| FUM (millions) | |
| Fund Overview | Insync invests in a concentrated portfolio of high quality companies that possess long 'runways' of future growth benefitting from Megatrends. Megatrends are multiyear structural and disruptive changes that transform the way we live our daily lives and result from a convergence of different underlying trends including innovation, politics, demographics, social attitudes and lifestyles. They provide important tailwinds to individual stocks and sectors, that reside within them. Insync believe this delivers exponential earnings growth ahead of market expectations. Insync screens the universe of 40,000 listed global companies to just 150 that it views as superior. This includes profitability, balance sheet performance, shareholder focus and valuations. 20-40 companies are then chosen for the portfolio. These reflect the best outcomes from further analysis using a proprietary DCF valuation, implied growth modelling, and free cash flow yield; alongside management, competitor, and industry scrutiny. The Fund may hold some cash (maximum of 5%), derivatives, currency contracts for hedging purposes, and American and/or Global Depository Receipts. It is however, for all intents and purposes, a 'long-only' fund, remaining fully invested irrespective of market cycles. |
| Manager Comments | The Insync Global Quality Equity Fund returned -5.72% in September, a difference of -2.68% compared with the Global Equity Index which fell by -3.04%. Since inception in October 2009 in the months where the market was positive, the fund has provided positive returns 81% of the time, contributing to an up-capture ratio for returns since inception of 80.13%. Over all other periods, the fund's up-capture ratio has ranged from a high of 125.18% over the most recent 24 months to a low of 88.37% over the latest 12 months. An up-capture ratio greater than 100% indicates that, on average, the fund has outperformed in the market's positive months. The fund has a down-capture ratio for returns since inception of 72.66%. Over all other periods, the fund's down-capture ratio has ranged from a high of 233.61% over the most recent 12 months to a low of 89.05% over the latest 48 months. A down-capture ratio less than 100% indicates that, on average, the fund has outperformed in the market's negative months. |
| More Information |
22 Oct 2021 - Webinar | Colins St Asset Management
|
Webinar | Colins St Asset Management Superior investment outcomes require thinking outside of the box, doing something that others won't so that you can achieve the type of returns that others don't. Since inception in 2016 the Collins St Value Fund has delivered a net return in excess of 19% p.a., over 8% p.a. higher than the broader Australian equities market through an unconstrained, high conviction Australian equities mandate with zero fixed management fees. During this webinar, Michael Goldberg, Managing Director and Portfolio Manager of the #1 ranked Collins St Value Fund (3 & 5 years by Morningstar) and Rob Hay, Head of Distribution & Investor Relations will share some insights into how 'special situations' have helped drive these returns, whilst seeking to preserve investor capital through asymmetric investment opportunities in convertible notes and take-over arbitrage strategies.
|

22 Oct 2021 - Are Bonds Really Defensive?
|
Are Bonds Really Defensive? Jonathan Wu, Premium China Funds Management October 2021
|

22 Oct 2021 - Why slow drivers are fools
|
Why slow drivers are fools Nicholas Quinn, Spatium Capital October 2021 "Anybody driving slower than you is an idiot, and anyone going faster than you is a maniac" - George Carlin. A few months back, my colleague Jesse wrote about the competing nature of the efficient market hypothesis and behavioural finance. Here's a brief recap:
Rereading this got me thinking about the active vs passive investing debate. In particular, how we might divide them into the two above camps and the similarity to George Carlin's infamous stand-up routine. On the matter of dividing them into camps, it seems that passive investing is more akin to the Efficient Market Hypothesis, given its implied nature of not seeking an excess (or outperforming) return. Whereas with active investing, this would better align with behavioural finance, as often the mandate is to seek outperforming investments. Unpacking this further, we know that in theory all publicly listed companies must distribute pertinent information to the market equally. Although in practice, we know that despite this dissemination, rarely is every page or slide considered prior to making an investment. Put another way, assuming all investors have the time to read and digest all available information, and process this information at the same rate, we would essentially all drive at the same speed and arrive at the same time. Behaviourally however, we know that human decision-making does not always follow the same logic, which may help fuel mispricing's such as market bubbles and exponential growth in speculative assets (such as cryptocurrency). Similar to when some drivers may be driving faster and more erratically than you.
It's little surprise that as investment managers of the Spatium Small Companies Fund, an actively managed fund that has outperformed the index by 10.8% per annum since inception (to 31 August 2021), our bias is naturally weighted towards active investing. However, parking that aside for the moment, there may be some merit to low-cost passive investing for retail investors, especially those who entered the market in 2020. A report out of the University of NSW highlighted direct stock ownership by retail investors (defined as having 1,000 or less shares in the ASX300) increased by 7% in 2020, whilst CNBC reported that an estimated total of 15% of all retail investors began investing in 2020. No doubt retail investors were, in part, motivated by the unprecedented rise in markets post the COVID-invoked bottom of 23 March 2020. To put this rise into 'unprecedented' context, the S&P500 has doubled in value from the 23 March 2020 bottom to 16 August 2021. Considering that it normally takes an average of 1,000 trading days (of which this time only took 354 trading days) for the market to double from a bottom (such as the GFC or World War II), labelling this rise unprecedented may be not giving it enough justice. Furthermore, as many global markets drove at similar speeds post the initial COVID shocks, it is easy to get carried away with the (false) assumption that past performance is an indicator of future performance. Especially for the retail investors that sought to directly invest in stocks throughout 2020, there may be those who are beginning to drive at different speeds relative to the broader market. This begs the question, if retail investors are finding their once 'speeding' portfolios slowing to a school zone pace, might they be better off driving at the same speed as everyone else in a passive product? It is hard to argue with the ease of access and diversification options that passive products can offer one's portfolio. Additionally, a retail investor can access these options easily and at a relatively low cost. That said, a word of caution on passive products; there is a growing criticism that passive investing is eliminating the need for price discovery or individual research at the stock level. The lack of price discovery in passive products may be driving markets to be more inefficient as opposed to serving the very camp that they belong to. Given the relatively recent trend in passive products over the past decade, the full ramifications of their impact on markets is still unknown - some industry heavyweights such as Michael Burry have even gone as far to say that when passive product inflows become outflows, "it will be ugly". Fundamentally, an investor's willingness to agree with one investment style or the other resides with internal biases and past experiences, notwithstanding that the available data on the ever-evolving allocation to passive investing is still quite premature. As such, an assessment on exactly how this will affect markets remains an argument for another article. Either way, as the debate rolls on, we encourage all readers to abide by respective speed limits (levels of risk), rather than focusing solely on an estimated time of arrival (target return). Funds operated by this manager: Spatium Small Companies Fund |
21 Oct 2021 - Performance Report: Insync Global Capital Aware Fund
| Report Date | |
| Manager | |
| Fund Name | |
| Strategy | |
| Latest Return Date | |
| Latest Return | |
| Latest 6 Months | |
| Latest 12 Months | |
| Latest 24 Months (pa) | |
| Annualised Since Inception | |
| Inception Date | |
| FUM (millions) | |
| Fund Overview | Insync invests in a concentrated portfolio of high quality companies that possess long 'runways' of future growth benefitting from Megatrends. Megatrends are multiyear structural and disruptive changes that transform the way we live our daily lives and result from a convergence of different underlying trends including innovation, politics, demographics, social attitudes and lifestyles. They provide important tailwinds to individual stocks and sectors, that reside within them. Insync believe this delivers exponential earnings growth ahead of market expectations. The fund uses Put Options to help buffer the depth and duration that sharp, severe negative market impacts would otherwide have on the value of the fund during these events. Insync screens the universe of 40,000 listed global companies to just 150 that it views as superior. This includes profitability, balance sheet performance, shareholder focus and valuations. 20-40 companies are then chosen for the portfolio. These reflect the best outcomes from further analysis using a proprietary DCF valuation, implied growth modelling, and free cash flow yield; alongside management, competitor, and industry scrutiny. The Fund may hold some cash (maximum of 5%), derivatives, currency contracts for hedging purposes, and American and/or Global Depository Receipts. It is however, for all intents and purposes, a 'long-only' fund, remaining fully invested irrespective of market cycles. |
| Manager Comments | The Insync Global Capital Aware Fund returned -5.58% in September, a difference of -2.54% compared with the Global Equity Index which fell by -3.04%. The fund has a down-capture ratio for returns since inception of 65.65%. Over all other periods, the fund's down-capture ratio has ranged from a high of 229.66% over the most recent 12 months to a low of 73.35% over the latest 48 months. A down-capture ratio less than 100% indicates that, on average, the fund has outperformed in the market's negative months over the specified period. |
| More Information |

21 Oct 2021 - Fund Review: Bennelong Long Short Equity Fund September 2021
BENNELONG LONG SHORT EQUITY FUND
Attached is our most recently updated Fund Review on the Bennelong Long Short Equity Fund.
- The Fund is a research driven, market and sector neutral, "pairs" trading strategy investing primarily in large-caps from the ASX/S&P100 Index, with over 19-years' track record and an annualised returns of 14.26%.
- The consistent returns across the investment history highlight the Fund's ability to provide positive returns in volatile and negative markets and significantly outperform the broader market. The Fund's Sharpe Ratio and Sortino Ratio are 0.84 and 1.32 respectively.
For further details on the Fund, please do not hesitate to contact us.
21 Oct 2021 - When Opportunity Knocks
|
When Opportunity Knocks Aitken Investment Management 29 September 2021 |
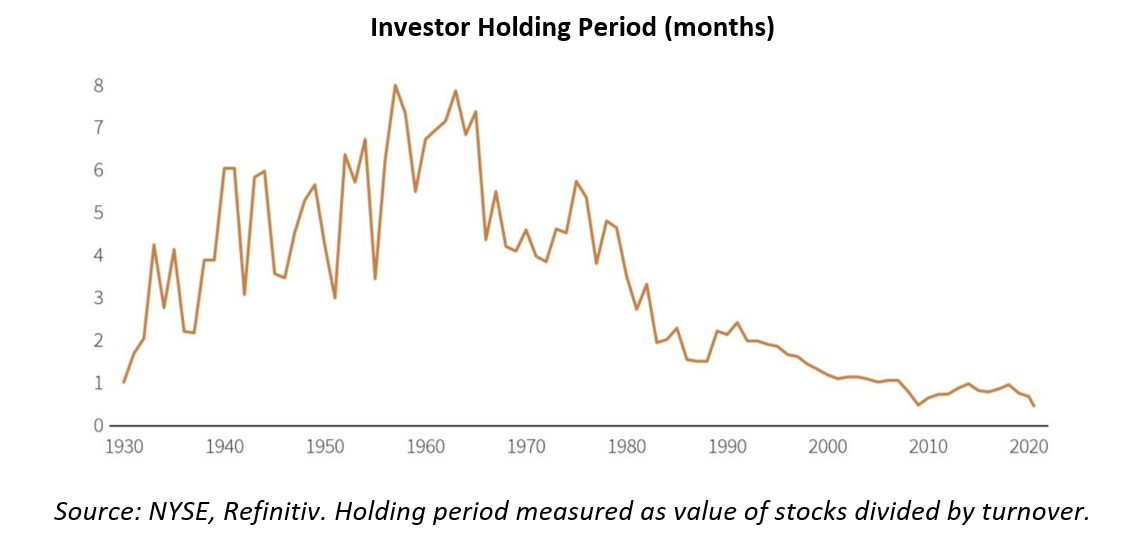
The Facts about Market TimingTo begin with, we subscribe to the view that the attraction of equities is the availability of compound total returns ahead of inflation over time. This comes with a cost: investors will only enjoy the effect of the compounding process if they remain invested for the medium to longer-term. An investor's friend is time, conviction, fundamental research and a business ownership mindset. Nevertheless, the temptation to 'take some risk off' is ever-present. While each individual investor will have unique circumstances driving their personal asset allocation, we don't attempt to engage in market timing within the Fund. (A piece of investing wisdom we take to heart is that there are two types of investors when it comes to market timing: those who cannot do it, and those who know they cannot do it). We believe that the reasons for market timing rarely working can be boiled down to two underlying issues: 1. The risk of missing out on big 'up' days can have incredibly negative impacts on long-term returns… and not surprisingly, the big 'up' days tend to be clustered around the big 'down' days during periods of increased volatility. Giving in to the temptation to 'get out' on the big down days dramatically increases the risk of missing the rebound. Many studies have borne this phenomenon out; according to a recent piece of research by JP Morgan Asset Management, $10,000 invested in the S&P 500 on 3 January 2000 would have turned into $32,421 by 31 December 2020 for an annual compound rate of return of 6.06%. Missing the 10 biggest 'up' days cuts that compound rate of return to 2.44%, while missing the 20 biggest days reduces it yet further to a paltry 0.08% per year. Missed the 30 best days? You would actually end up with less money than you started, having compounded at -1.95% per year for 20 years. 'Getting out' to avoid the psychological pain of short-term paper losses is not worth the increased risk of long-term damage to returns, in our opinion. 2. Markets are second-level systems. It is not enough to accurately predict an event; one must also correctly predict what the market was anticipating prior to the event and then correctly deduce how the market might react to the new information. We think that getting all three of those variables correct - and then being right on the timing, to boot - is nigh-on impossible to do repeatably. Since 1950, the S&P 500 has experienced 36 separate drawdowns of 10% or more. Ten of these double-digit declines ended up exceeding 20% (the popular definition of a 'bear market') peak-to-trough, while the other 26 ended up somewhere between -10% and -20% (a 'correction, euphemistically.) Statistically speaking, if there have been 36 double-digit drawdowns over the past 70-odd years, it works out that investors should expect this to happen with a frequency of about once every two years. Corrections and pullbacks are essentially an unavoidable part of the investment journey - and when seen in perspective as a period of prudent capital allocation with a margin of safety, is more likely to provide opportunity than lasting damage. Investor Time-Horizons: Shorter Than EverClosely linked to this point - using periods of market weakness to allocate capital - is the fact that investor time horizons have almost never been shorter. Based on an analysis of turnover, the average investor in US equities hold their positions for less than a year.
As the chart above shows, investor holding periods have been steadily decreasing since essentially the early 1990's, meaning this dynamic is not a new one. Over the past 18 months or so, access to cheap leverage and commission-free trading has likely exacerbated the trend. We recently tested this thesis on some of the high-profile, high-growth businesses that have come to market since the start of the pandemic. After adjusting for management ownership and strategic investors, it appears to us that a number of businesses essentially see their free float turned over in full every two to four months. Keep in mind, this is for businesses where the drivers of value lie several years in the future. We have very little doubt that there is substantial short-term speculating about long-term variables occurring in the equity of certain businesses. Of course, shortening holding periods also create opportunity. If an investor can simply take a 12 to 18-month forward view, one is already looking out further than the majority of the daily activity in markets. (We generally try to formulate a view on a 3-to-5-year basis). When a high-profile business suffers the inevitable disappointment relative to the sky-high expectations embedded in its price, the pullback can provide a window to the patient investor. The narrative behind any pullback can be varied: stalled US debt ceiling negotiations, fears of a slowdown in China, rising energy prices, ongoing supply chains disruptions, resurgent COVID cases or lockdowns all seem like likely candidates. However, to the investor who takes a business ownership perspective and understands the quasi-permanent nature of equity ownership (particularly in competitively advantaged businesses), such pullbacks usually provide the time to wisely allocate capital. Getting scared off by a compelling narrative around risk is exactly what causes inactivity when the market goes on sale. The Psychology of Uncertainty -Prepare, Don't PredictFred Schwed Jr. was a professional broker active on Wall Street active during the crash of 1929. Several years after the event, he wrote the seminal Where Are The Customer's Yachts?, in which he provided a true, timeless and hilarious view on the inner workings of investment markets and Wall Street culture. Despite being nearly 100 years old, the observations in it remain timely, and we highly recommend it to our investors - it is a quick read, and extremely funny to boot. In Where Are The Customer's Yachts?, Schwed writes: For one thing, customers have an unfortunate habit of asking about the financial future. Now, if you do someone the single honour of asking him a difficult question, you may be assured that you will get a detailed answer. Rarely will it be the most difficult of all answers - "I don't know." We strongly agree with this statement. The one thing markets (and by extension, investors) hate is uncertainty. Uncertainty leads to volatility, which leads to those troublesome corrections everyone is trying to avoid. It is therefore no surprise that market commentators hold forth on a variety of subjects with great certainty: "inflation will do X", "the currency will do Y", etc. The problem is this: absolutely no one knows what will happen with 100% certainty. All of the knowable facts lie in the past, while all of the value lies in the unknowable future. Following the recent experience of navigating markets in 2020, one maxim of AIM's investment team is that among the four most dangerous words in investing (alongside Sir John Templeton's famous "this time it's different") are "we know for sure" - particularly when it comes to macro-economic prediction. Instead of selling you certainty, we believe in working alongside our investors to get comfortable in living with the psychology of uncertainty. Our motto in this regard: prepare, don't predict. We limit our predictions about the future to businesses we believe we understand, and by sticking to this circle of competence - and owning businesses with prodigious amounts of cash on hand and cash being generated - we believe we are prepared for the 'vicissitudes of fate' that will play out in the real economy. When we believe we have both an edge in understanding as well as a margin of safety, we prudently invest your capital, effectively handing it over to the right business managers at the right price. We believe this approach is likely to lead to far more beneficial outcomes over time than trying to predict and position for short-term macro-economic outcomes. Sustained, Incremental, SensibleAs exciting as it may feel to time the market, worry about every headline promising impending doom and trading in and out based on some forecast of an imminent correction (which may or may not happen), the evidence proves that such strategies rarely work. Instead, far more is achieved when sticking to a strategy that allows for the aggregation of small gains - in other words, compounding - to build up over time. Practically speaking, this means that most investors are almost always going to be better off by simply using a dollar-cost averaging strategy through time. By mentally sticking with an allocated amount to invest through thick and thin, investors generally do better over the long term than by making big calls to get in and out of the market. The reason is simplicity itself: this strategy keeps you invested - and more importantly, still investing - when the proverbial lean years come around in the market. (Logically, one may consider whether it is appropriate within their personal circumstances and risk appetite to accelerate such a strategy when market volatility offers a greater margin of safety when a correction (or bear market) does occur.) If the conclusion to this note seems somewhat boring, we have achieved our goal in writing it. 'Sustained, incremental and sensible' as a capital allocation strategy is hardly going to get the blood pumping on any particular day, but it makes all the difference when adhered to for long periods of time through the wonders of compounding. Through a number of market cycles, we have found that time in the market matters more than timing the market. |
|
Funds operated by this manager: AIM Global High Conviction Fund |