
NEWS

1 Nov 2021 - Market volatility does not change key drivers of the share market
|
Market volatility does not change key drivers of the share market ST Wong, Prime Value Asset Management October 2021 Recent market volatility will likely impact the Australian share market in the short-term, driven largely by volatility in the commodities market. The concerns over commodities can be traced back to problems with Chinese property company Evergrande, which is currently experiencing a debt crisis. This has understandably fed anxiety over China's near term demand for commodities such as iron ore. Evergrande's story is an interesting one, and reminds me a little of some companies I analysed when I was based in Malaysia during the Asian Financial Crisis in the 1990s. Similar to a number of Asian companies, particularly property companies in the 1990s, Evergrande over-extended its balance sheet and engaged in number of non-core businesses. During the Asian Financial Crisis, I recall biscuit manufacturing companies over-geared to enter property development on a big scale, only to see demand shrivel. Evergrande fits that bucket of over-geared companies venturing across non-core businesses then finding themselves in a tangle--in Evergrande's case, a US$300bn tangle. However, while the Asian Financial Crisis reflected widespread systemic problems, Evergrande does not look like a systemic issue. It is more an economic problem. The financial institutions in Asia are not overly exposed by Evergrande's debt challenges, and the Chinese financial services industry can absorb this issue. Chinese policy makers have been on the Evergrande case for over a year, working to ring fence the issue to stave off systemic risks. Similar to developed economies, the Chinese authorities value consumer confidence, and we expect them to bolster the diminishing confidence in the Chinese property market. Evergrande is likely to remain in the news headlines over the next few months. This is because information surrounding the short-term specifics of Evergrande's problems are not known. Further, we are uncertain of China's policy approach to reduce excessive investment and speculation in properties--Chinese authorities may look to reduce the leverage of financial institutions and property companies. The consequence is for lower, but more stable, Chinese economic growth. While we expect commodities to be volatile short-term, when we look through the current noise to consider the next 18-24 months, commodities look sound. However, markets react to short-term concerns which is why stocks such as BHP look like they have been recently oversold. At Prime Value, we believe the key drivers to economic and market performance have not changed. The key factors are:
We can expect many bumps along the way, but the opportunities to pick good companies through this next economic cycle looks promising. Funds operated by this manager: Prime Value Growth Fund - Class A, Prime Value Equity Income (Imputation) Fund - Class A, Prime Value Opportunities Fund, Prime Value Emerging Opportunities Fund |

1 Nov 2021 - New Funds on Fundmonitors.com
|
New Funds on Fundmonitors.com |
|
Below are some of the funds we've recently added to our database. Follow the links to view each fund's profile, where you'll have access to their offer documents, monthly reports, historical returns, performance analytics, rankings, research, platform availability, and news & insights. |
|
|
||||||||||||||||||||||||||||
| T. Rowe Price Global Growth Equity Fund | ||||||||||||||||||||||||||||
|
||||||||||||||||||||||||||||
|
||||||||||||||||||||||||||||
|
||||||||||||||||||||||||||||
| View Profile | ||||||||||||||||||||||||||||
|
Want to see more funds? |
||||||||||||||||||||||||||||
|
Subscribe for full access to these funds and over 600 others |
||||||||||||||||||||||||||||


29 Oct 2021 - Hedge Clippings | 29 October 2021
|
||||||
|
If you'd like to receive Hedge Clippings direct to your inbox each Friday
|


29 Oct 2021 - Performance Report: Laureola Australia Feeder Fund
| Report Date | |
| Manager | |
| Fund Name | |
| Strategy | |
| Latest Return Date | |
| Latest Return | |
| Latest 6 Months | |
| Latest 12 Months | |
| Latest 24 Months (pa) | |
| Annualised Since Inception | |
| Inception Date | |
| FUM (millions) | |
| Fund Overview | Life Settlements are resold life insurance policies and can be thought of as a form of finance extended to an individual backed by the person's life insurance policy. This financing is repaid upon maturity by collecting the death benefit from the insurance company. Risk mitigation measures implemented by Laureola include science-driven due diligence of policies, active monitoring of insured through a vertically integrated operation, and investor aligned fund design. |
| Manager Comments | The portfolio now holds 184 policies with a combined $127 ml of Face value; The average Life Expectancy is 74 mos. 35% of the insureds have a Life Expectancy of less than 4 years, including the insureds of several larger policies. 22 insureds are more than 90 years old, including the insureds of several larger policies. In their latest report, Laureola noted there are growing indications that we are entering a difficult period for the traditional markets and for the global economy. They believe Laureola investors can be confident that their investment in the Laureola Fund is well sheltered from the coming storms. The fund has a low correlation to all major indices. |
| More Information |

29 Oct 2021 - Fund Review: Insync Global Capital Aware Fund September 2021
INSYNC GLOBAL CAPITAL AWARE FUND
Attached is our most recently updated Fund Review on the Insync Global Capital Aware Fund.
We would like to highlight the following:
- The Global Capital Aware Fund invests in a concentrated portfolio of 15-30 stocks, targeting exceptional, large cap global companies with a strong focus on dividend growth and downside protection.
- Portfolio selection is driven by a core strategy of investing in companies with sustainable growth in dividends, high returns on capital, positive free cash flows and strong balance sheets.
- Emphasis on limiting downside risk is through extensive company research, the ability to hold cash and long protective index put options.
For further details on the Fund, please do not hesitate to contact us.

29 Oct 2021 - Inching Towards Normal But Not Without Risks
|
Inching Towards Normal But Not Without Risks Delft Partners October 2021 |
Global equities had a better time recently, and we believe they should marginally outperform bonds in the coming weeks. There are signs of a broader reopening underway that we expect should boost consumer confidence and spending. Consequently, we should see downgrades to global growth forecast abate. However, there are two risks to a pro-equity call. First, the spike in inflation will lead to a quicker tightening by central banks, and second, there is a marked deterioration in the Chinese economy on the back of the problems in the property sector there. We believe central banks will be worried that the pick-up in energy prices will undermine consumer spending resurgence and remain slow to tighten monetary policy. But China continues to concern us. Global equities have recovered their poise but have failed to make much progress over the past five months. The surge in inflation has undoubtedly provided a drag. However, the challenges posed by the delta variant of COVID have proved to be as much a dampener. Economic activity has lost momentum; the re-openings in many economies have gone into the reverse, leading to a slowing of consumer spending and employment growth.
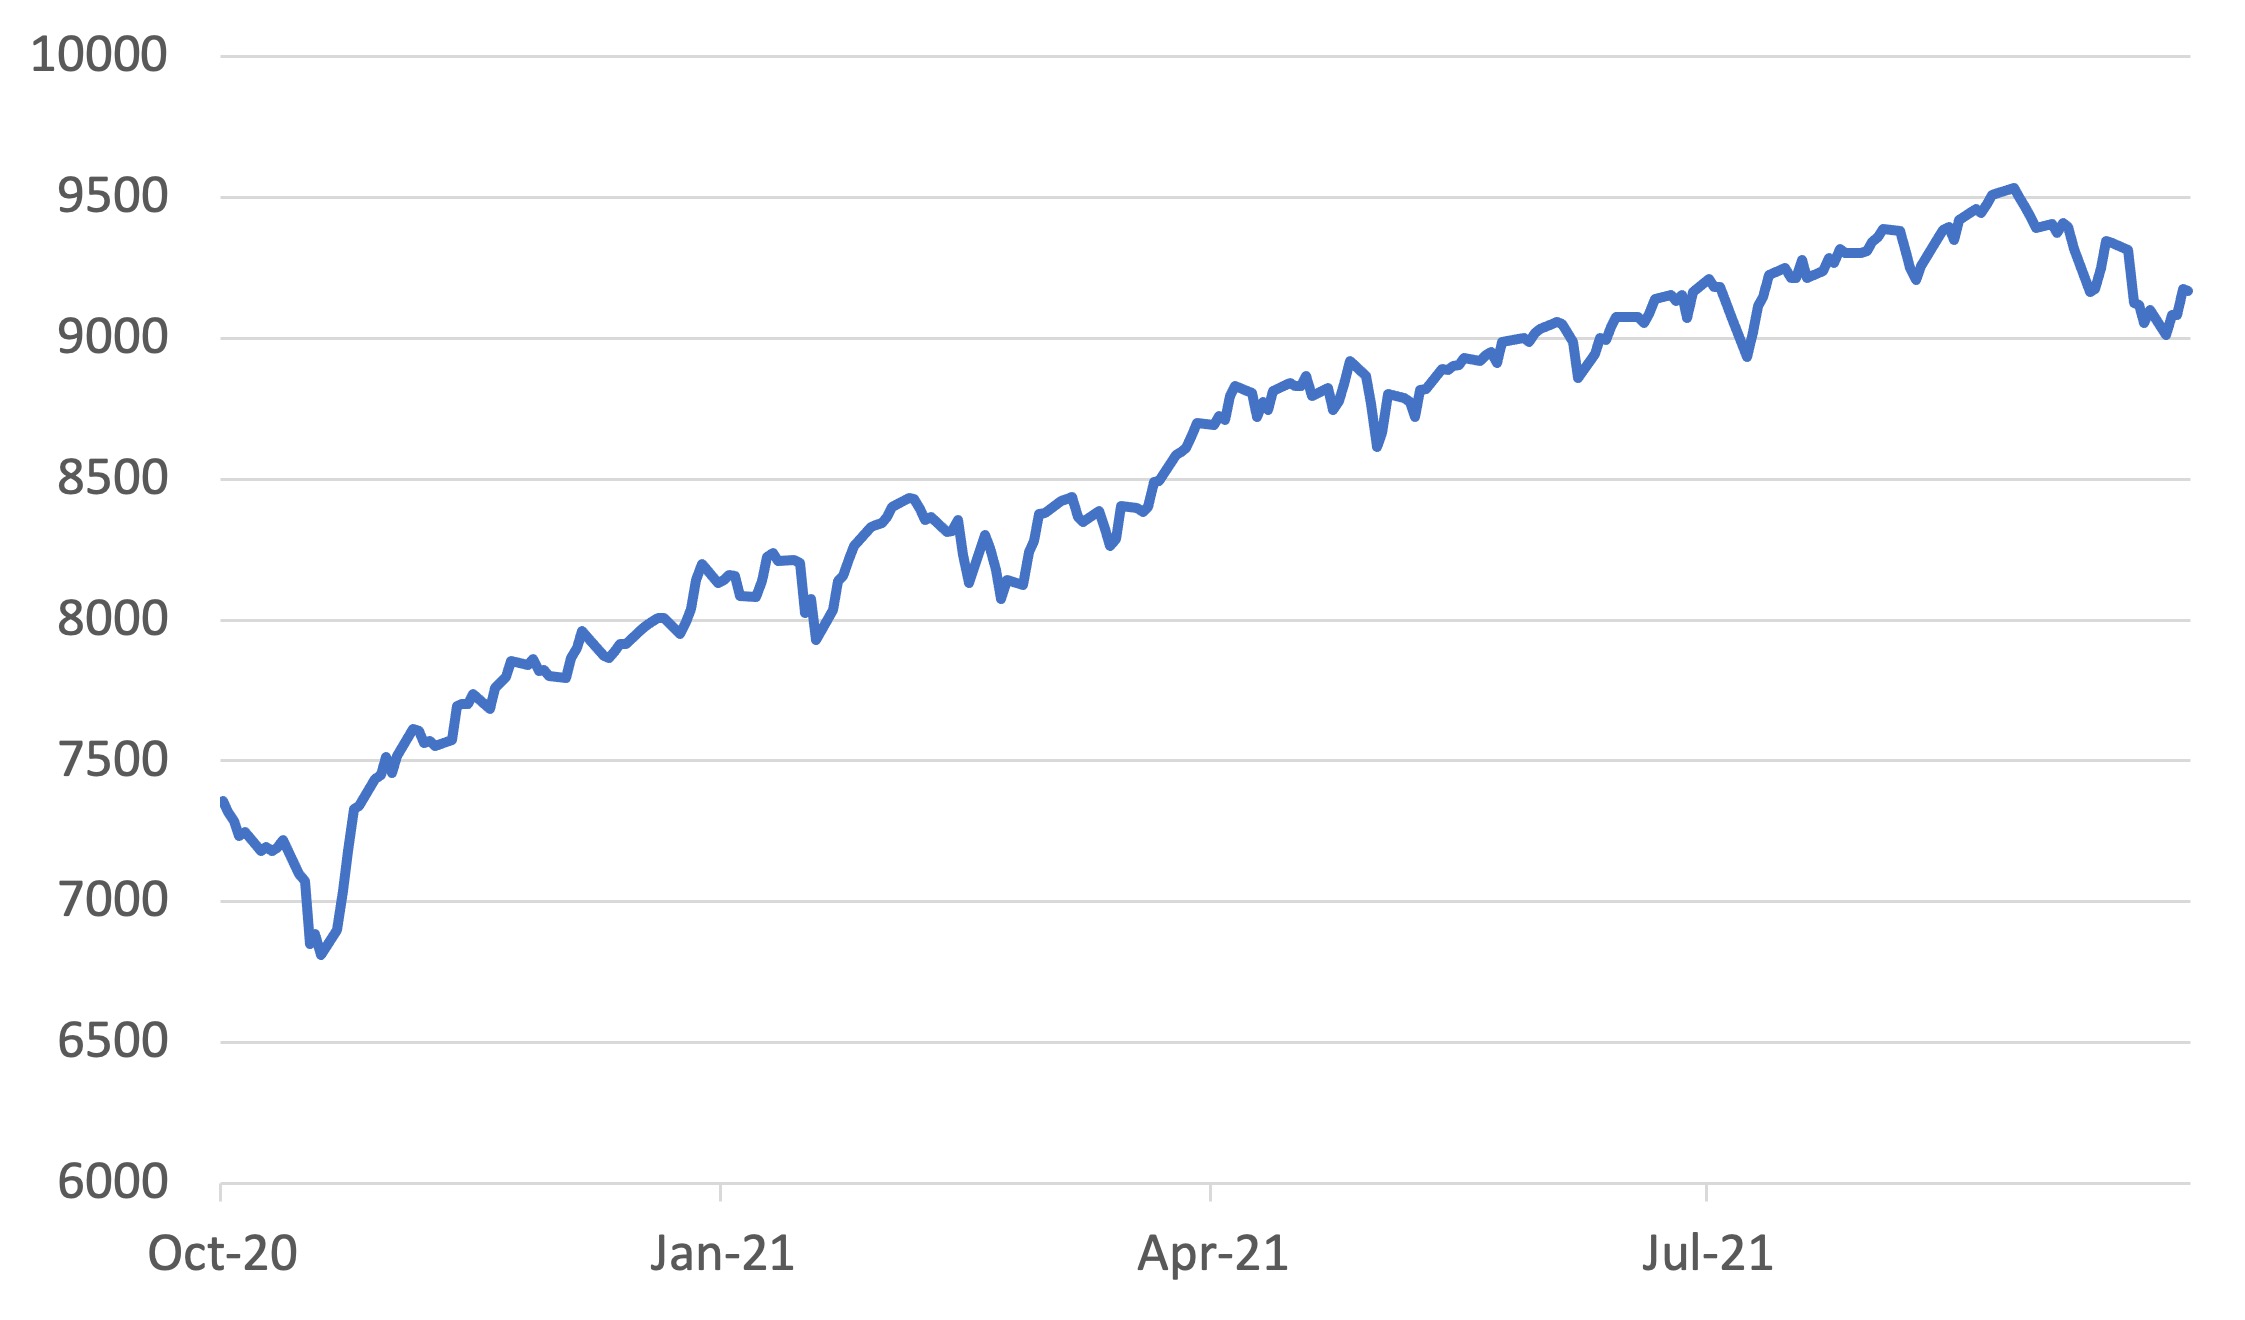
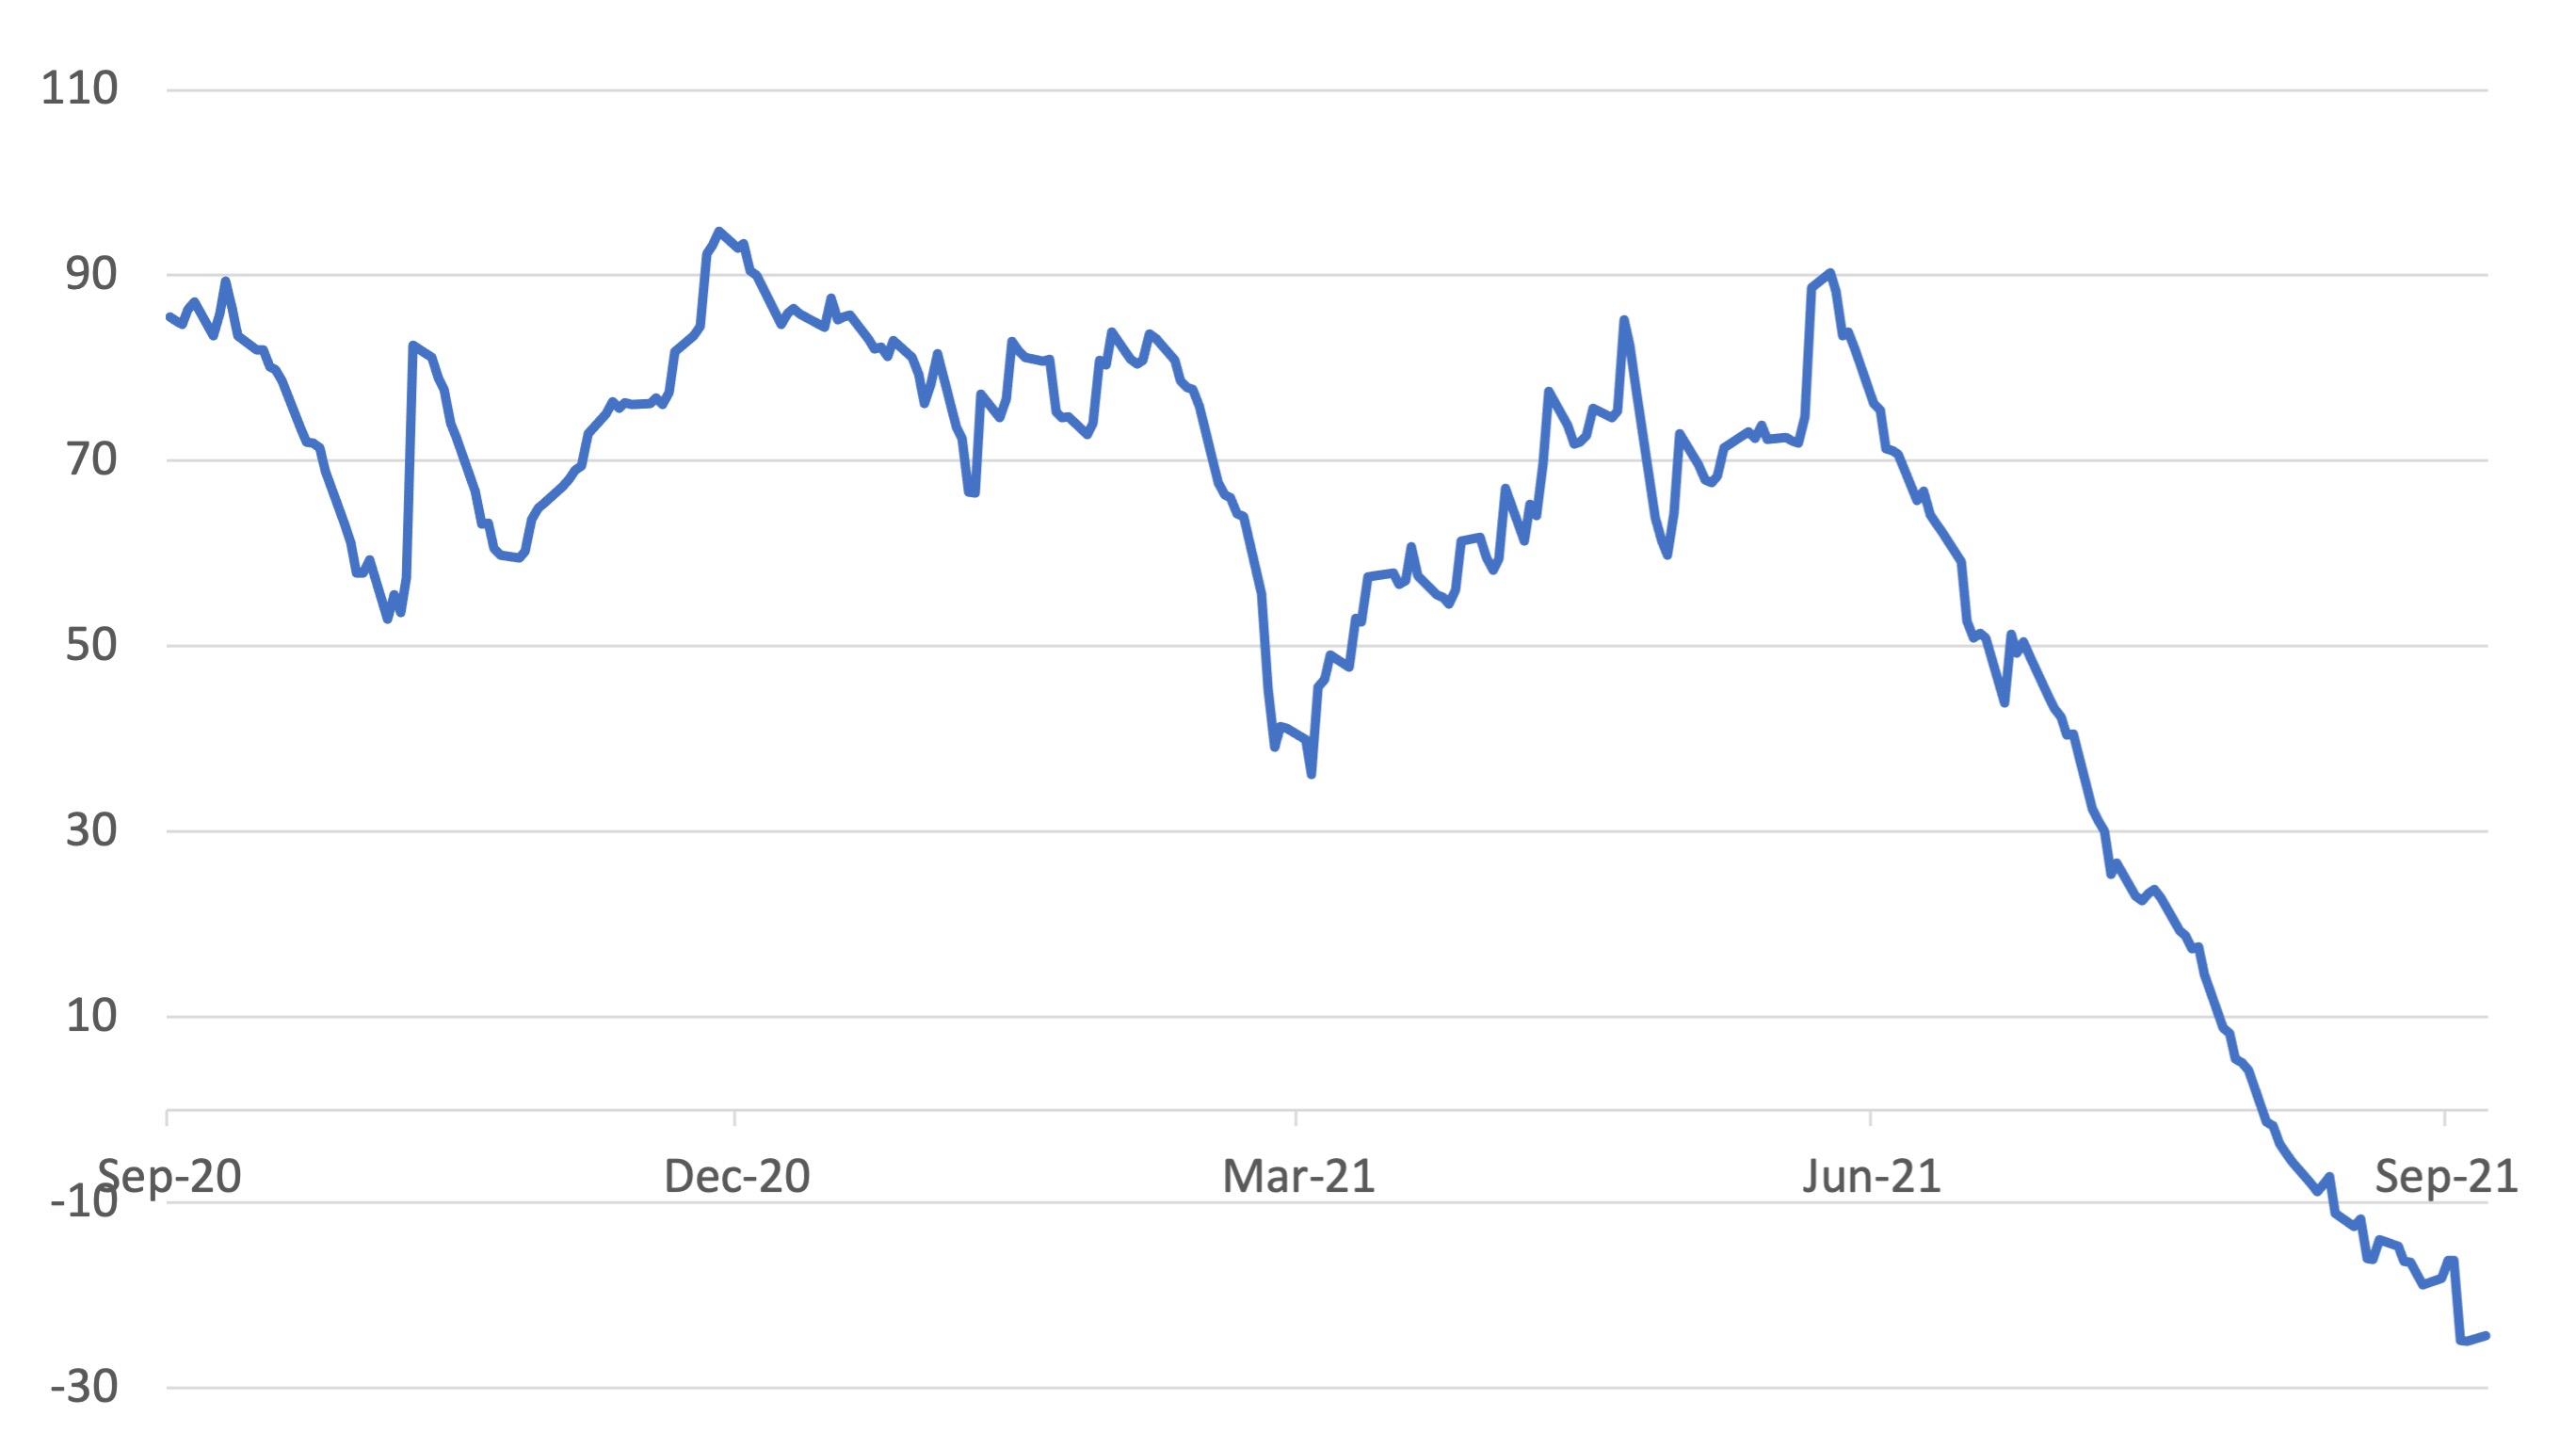
Nevertheless, the drop in COVID cases of late has been encouraging. Several governments have quickly moved towards reopening their economies, taking down a considerable number of the barriers to movement. The newfound freedom is most apparent in the considerably reduced number of countries on travel 'red lists', enabling people to travel more freely. Greater freedom to travel alone has the power to increase consumer confidence and lead to increased consumer spending and GDP growth. While the diminished impact of COVID is a positive for consumer spending, we have to concede that the rise in inflation, particularly the recent rise in energy prices, is harmful. The increase in gas prices in the past quarter has been quite extraordinary. Gas prices are up a whopping 150% in Europe; the US has seen a 50% surge. As Chart 2 shows, the recent spate of economic data has often been below expectations. That could be about to change as the current round of downgrades to GDP forecasts washes through the system. Daily US COVID cases peaked in the latest wave on the 3rd of September and fell steadily since. However, it's not just about the daily cases. It is about the reaction of governments to the COVID situation. In the UK, the daily COVID count has been around 30,000 for the past three months; however, the government has just substantially reduced barriers to overseas travel. Indeed, people from the UK can now travel to Singapore and vice versa. At the weekend, the Singapore government pleasantly surprised the country by relaxing the restrictions on overseas travel with travel lanes opened with eight countries. Singapore now has travel lanes for fully vaccinated passengers from the US, the UK, Denmark, France, the Netherlands, Spain, Italy and Germany.
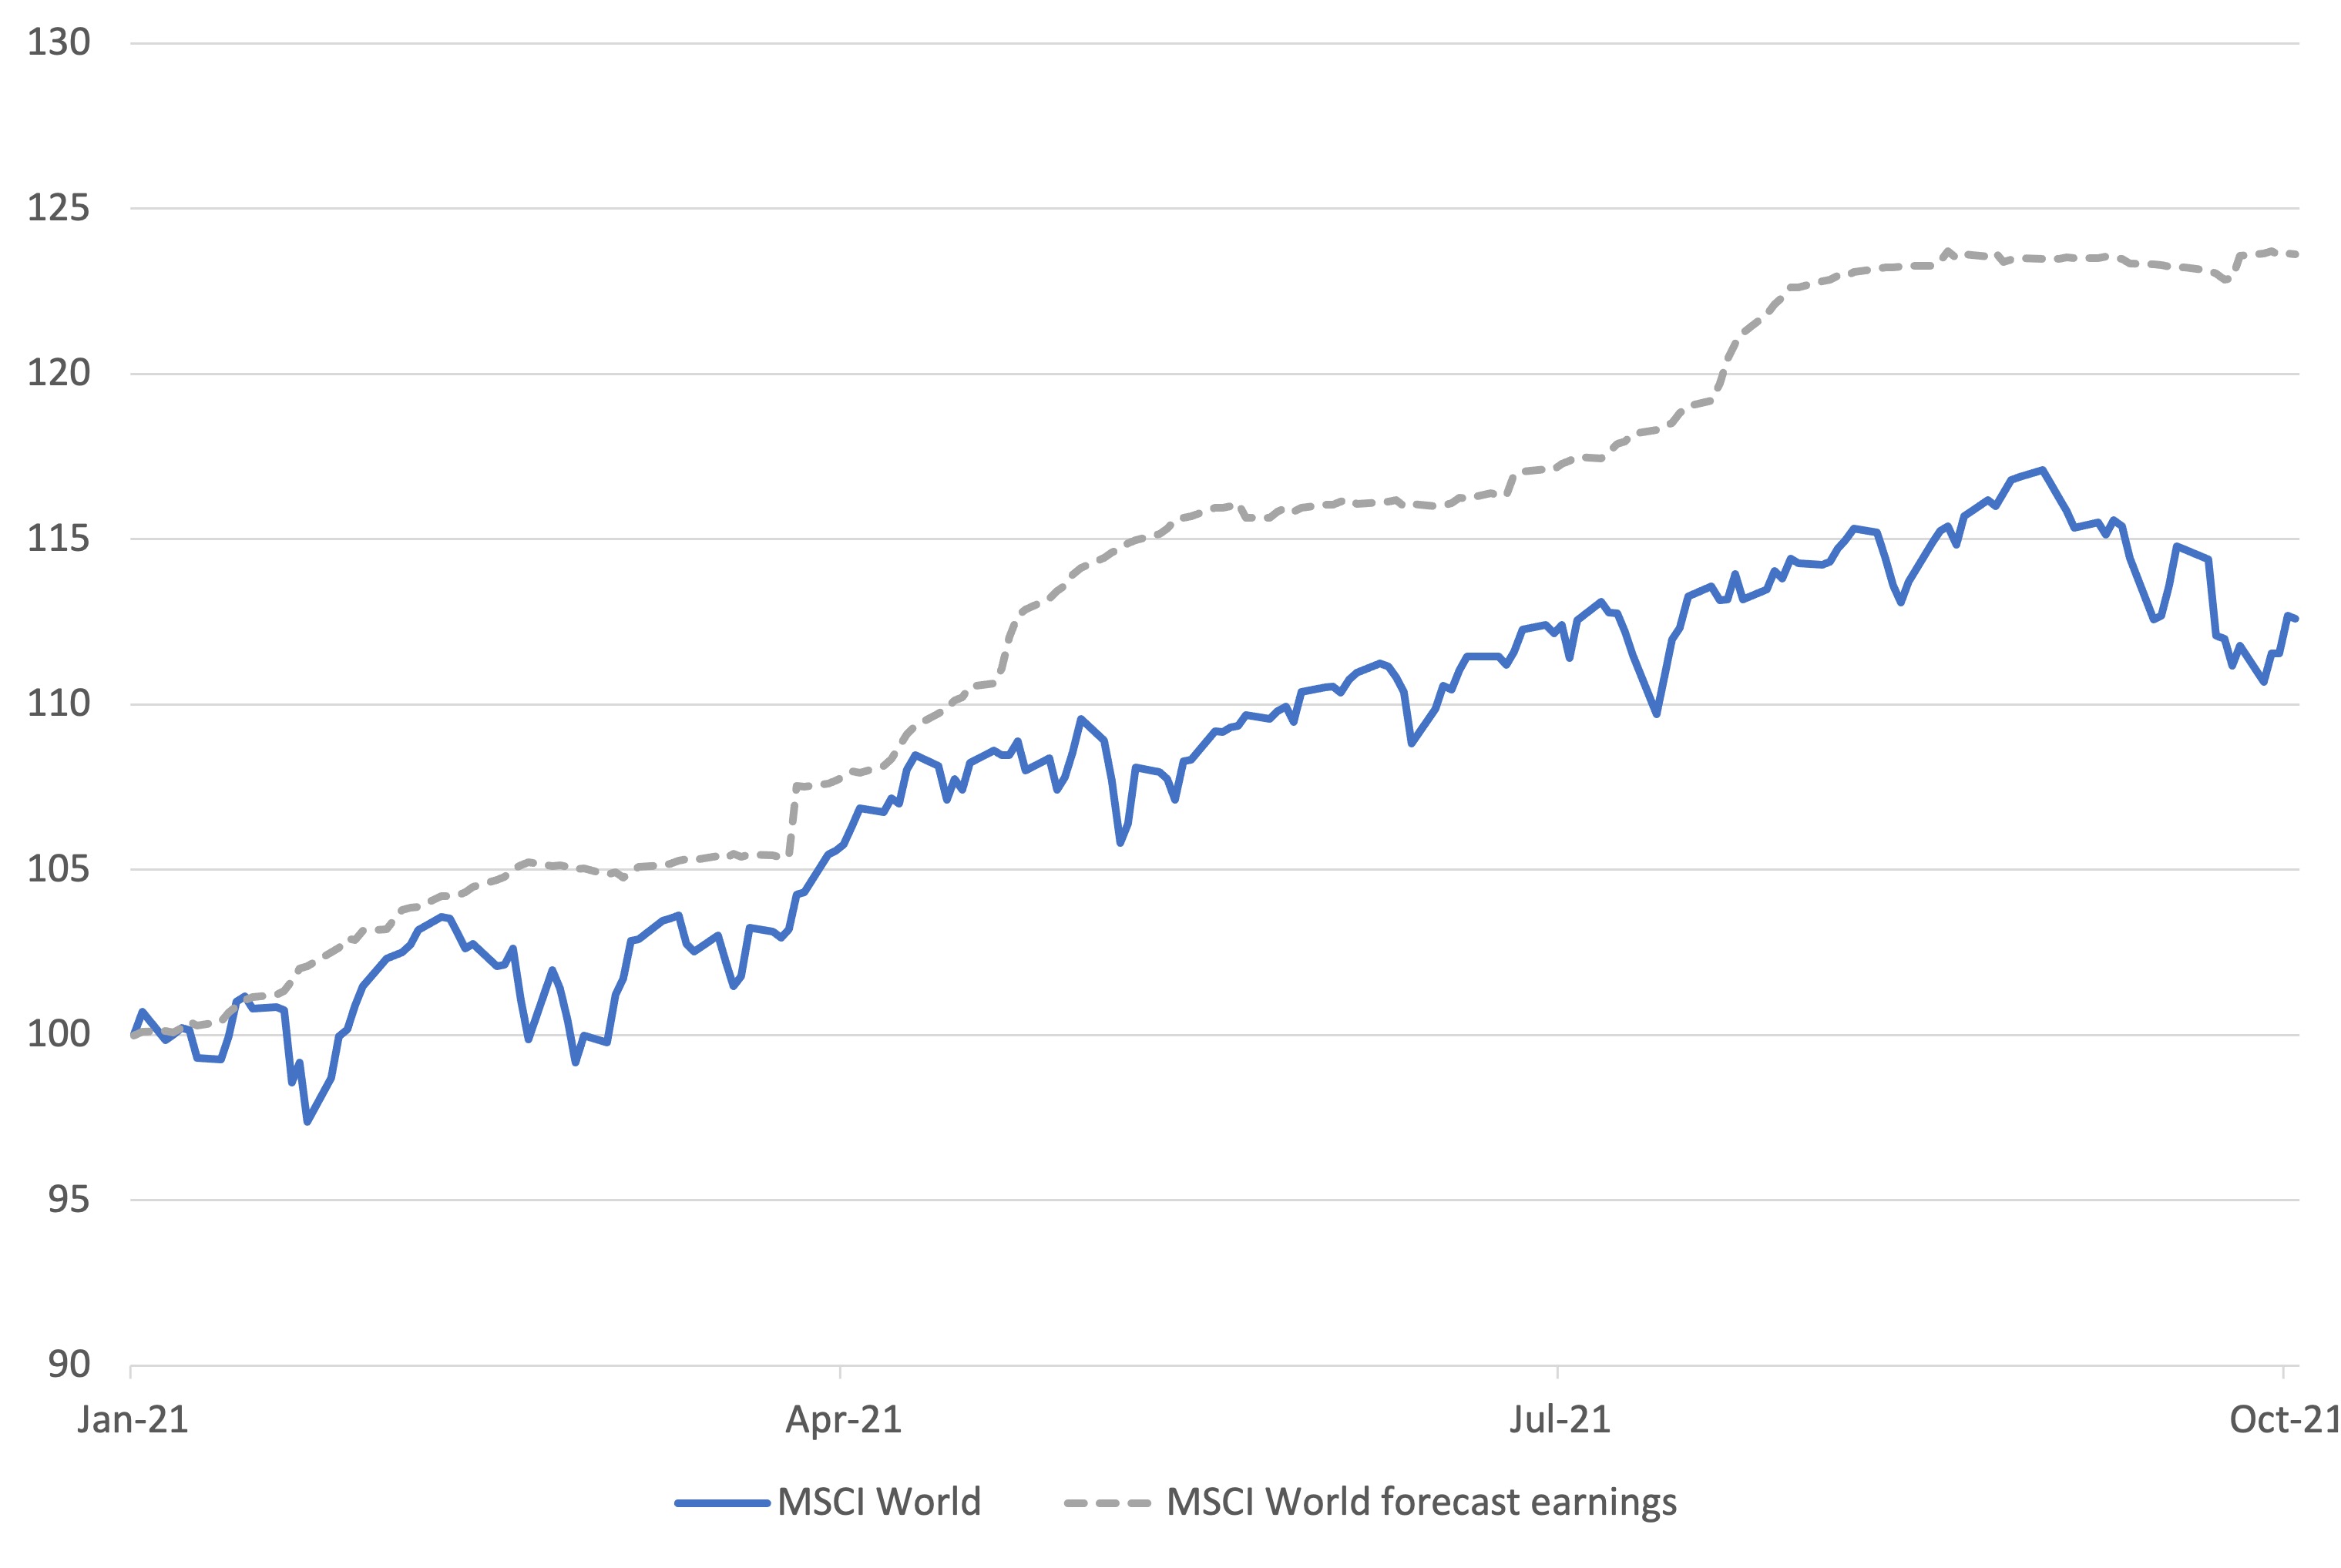
The pause in the equity markets' advance has led to a more substantial gap between the rise in the level of consensus corporate profit expectations for 2021 and the level of the global equity index (Chart 3). The expected level of corporate profits has risen nearly 24% year-to-date, yet the global equity index is up just 12%.
We expect investors to take a more positive view of the upside for equities. With bond markets under pressure from higher yields, equities remain the asset class of investor choice. The market sees the spike in global inflation as much less transitory than before. The quick pace of the US 10-year bond yield rise suggests it may have further to go, potentially through the 1.70% level in the coming days. It is noteworthy that the spike has occurred at a time of weakening global growth. Given that backdrop, consider where the yield might be if we have a recovery in consumer spending, ongoing higher-than-expected energy prices and a global re-stocking cycle, all meeting still dysfunctional supply lines. Even though last week's headline US employment growth disappointed the market, the stronger-than-expected working hours and wage growth figures kept the bond market from rallying.
The most significant global risk to a more positive tone to the global asset markets is the Chinese property market angst. It has almost become a game of chicken between investors and the government to see who blinks first. Evergrande equity is suspended, and its debt is trading in the low 20 cents in the dollar. Across the Chinese property debt market, prices have fallen on the news that Evergrande's problems have led to a buyers' strike at property development sites. Property development unit sales are down on average by 35% year on year. Property developer liquidity is being squeezed by a lack of pre-sales, an offshore bond market that has largely dried up and an onshore banking market that is at its limit. The great hope among investors is that the Chinese government will step in and relax onshore banking limits. However, that may require them to compromise on the three red lines that they set as the de minimis requirement for companies to be on the right side of regulations to receive funding. At this point, it is reported that 50% of the top 30 developers are in breach of at least one of the red lines. |
|
Funds operated by this manager: Delft Partners Global High Conviction Strategy, Delft Partners Asia Small Companies Strategy, Delft Partners Global Infrastructure Strategy |

28 Oct 2021 - Fund Review: Bennelong Kardinia Absolute Return Fund September 2021
BENNELONG KARDINIA ABSOLUTE RETURN FUND
Attached is our most recently updated Fund Review. You are also able to view the Fund's Profile.
- The Fund is long biased, research driven, active equity long/short strategy investing in listed ASX companies.
- The Fund has significantly outperformed the ASX200 Accumulation Index since its inception in May 2006 and also has significantly lower risk KPIs. The Fund has an annualised return of 8.63% p.a. with a volatility of 7.60%, compared to the ASX200 Accumulation's return of 6.65% p.a. with a volatility of 14.18%.
- The Fund also has a strong focus on capital protection in negative markets. Portfolio Managers Kristiaan Rehder and Stuart Larke have significant market experience, while Bennelong Funds Management provide infrastructure, operational, compliance and distribution capabilities.
For further details on the Fund, please do not hesitate to contact us.

28 Oct 2021 - 10k Words - October Edition
|
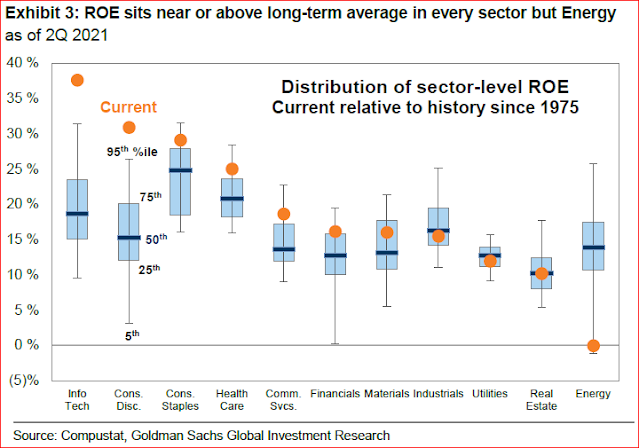
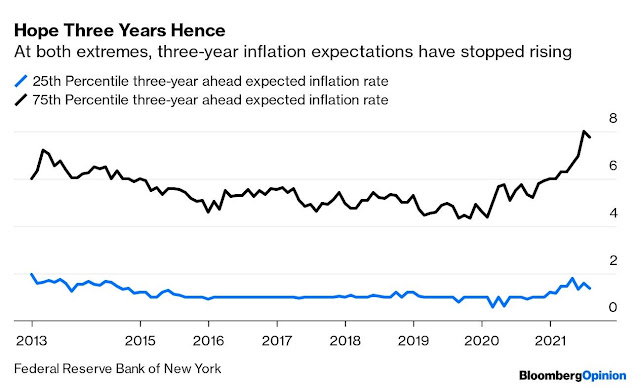
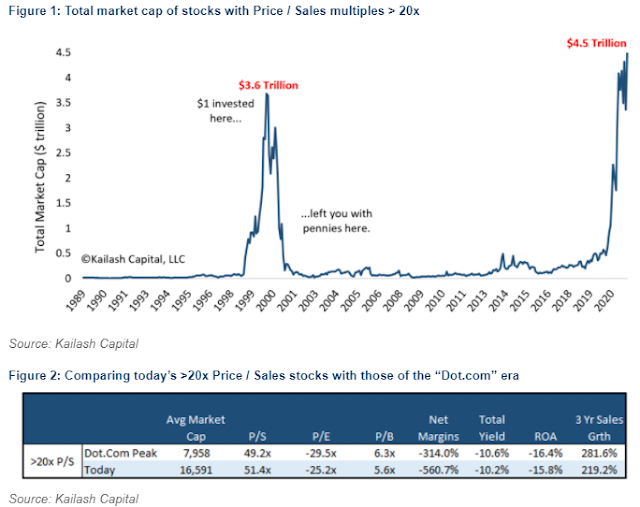
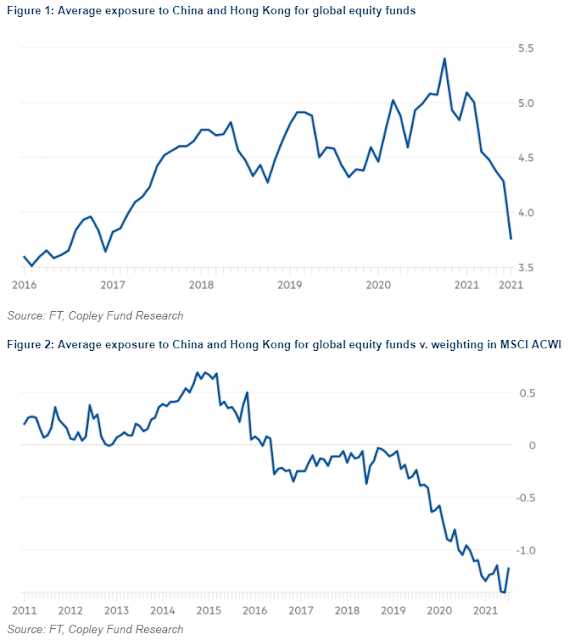
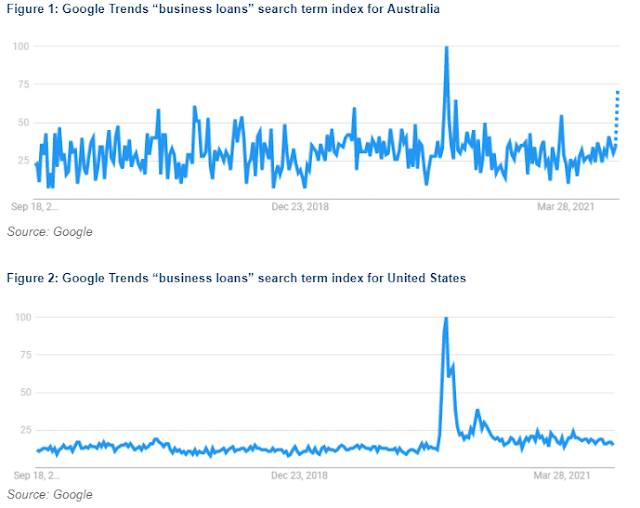
10k Words - October Edition Equitable Investors October 2021 This month we start off with a picture that really does tell a story - Goldman Sachs looking at Return on Equity at an industry level and where it sits currently relative to the past. Bloomberg has the inflation story covered off, showing expectations at both extremes had levelled off after recent rises and providing greater perspective by using a two-year inflation figure. Then we leverage off charts we have highlighted in recent weekly Small Talk updates to Equitable Investors' clients: The FT showed us how equity portfolio weightings to China and Hong Kong have been in decline. Kailash Capital charts the huge run in US price/sales multiples back to "dot.com" levels (albeit in a different interest rate and cost of capital regime) and we look at how Australian small business is searching for finance. Return on Equity by Industry (US)
Source: Goldman Sachs
Inflation expectations in the US have increased but at the extremes the rise has come to a stop
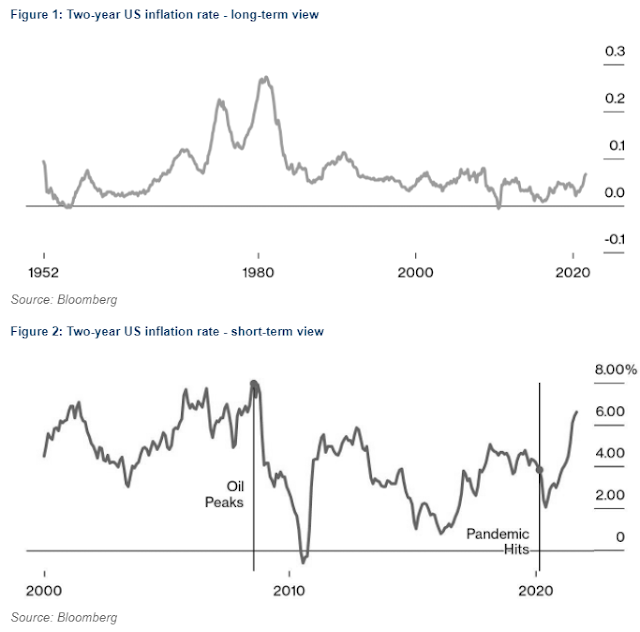
Source: Bloomberg Two-year inflation rate over long-term and short-term views
Price/Sales in the US market now v. "Dot.com" era
Global equity funds reducing exposure to China and Hong Kong
The search for "business loans" in Australia
Source: Google, Equitable Investors
Disclaimer Nothing in this blog constitutes investment advice - or advice in any other field. Neither the information, commentary or any opinion contained in this blog constitutes a solicitation or offer by Equitable Investors Pty Ltd (Equitable Investors) or its affiliates to buy or sell any securities or other financial instruments. Nor shall any such security be offered or sold to any person in any jurisdiction in which such offer, solicitation, purchase, or sale would be unlawful under the securities laws of such jurisdiction. The content of this blog should not be relied upon in making investment decisions.Any decisions based on information contained on this blog are the sole responsibility of the visitor. In exchange for using this blog, the visitor agree to indemnify Equitable Investors and hold Equitable Investors, its officers, directors, employees, affiliates, agents, licensors and suppliers harmless against any and all claims, losses, liability, costs and expenses (including but not limited to legal fees) arising from your use of this blog, from your violation of these Terms or from any decisions that the visitor makes based on such information. This blog is for information purposes only and is not intended to be relied upon as a forecast, research or investment advice. The information on this blog does not constitute a recommendation, offer or solicitation to buy or sell any securities or to adopt any investment strategy. Although this material is based upon information that Equitable Investors considers reliable and endeavours to keep current, Equitable Investors does not assure that this material is accurate, current or complete, and it should not be relied upon as such. Any opinions expressed on this blog may change as subsequent conditions vary. Equitable Investors does not warrant, either expressly or implied, the accuracy or completeness of the information, text, graphics, links or other items contained on this blog and does not warrant that the functions contained in this blog will be uninterrupted or error-free, that defects will be corrected, or that the blog will be free of viruses or other harmful components.Equitable Investors expressly disclaims all liability for errors and omissions in the materials on this blog and for the use or interpretation by others of information contained on the blog Funds operated by this manager: |

28 Oct 2021 - Global Matters: Infrastructure, interest rates & inflation

27 Oct 2021 - Performance Report: Glenmore Australian Equities Fund
| Report Date | |
| Manager | |
| Fund Name | |
| Strategy | |
| Latest Return Date | |
| Latest Return | |
| Latest 6 Months | |
| Latest 12 Months | |
| Latest 24 Months (pa) | |
| Annualised Since Inception | |
| Inception Date | |
| FUM (millions) | |
| Fund Overview | The main driver of identifying potential investments will be bottom up company analysis, however macro-economic conditions will be considered as part of the investment thesis for each stock. |
| Manager Comments | The fund's Sharpe ratio has ranged from a high of 3.42 for performance over the most recent 12 months to a low of 0.77 over the latest 24 months, and is 1.13 for performance since inception. By contrast, the ASX 200 Total Return Index's Sharpe for performance since June 2017 is 0.66. Since inception in June 2017 in the months where the market was positive, the fund has provided positive returns 92% of the time, contributing to an up-capture ratio for returns since inception of 231.09%. Over all other periods, the fund's up-capture ratio has ranged from a high of 211.43% over the most recent 48 months to a low of 160.09% over the latest 12 months. An up-capture ratio greater than 100% indicates that, on average, the fund has outperformed in the market's positive months over the specified period. |
| More Information |