
NEWS

19 Nov 2021 - Performance Report: Insync Global Quality Equity Fund
| Report Date | |
| Manager | |
| Fund Name | |
| Strategy | |
| Latest Return Date | |
| Latest Return | |
| Latest 6 Months | |
| Latest 12 Months | |
| Latest 24 Months (pa) | |
| Annualised Since Inception | |
| Inception Date | |
| FUM (millions) | |
| Fund Overview | Insync invests in a concentrated portfolio of high quality companies that possess long 'runways' of future growth benefitting from Megatrends. Megatrends are multiyear structural and disruptive changes that transform the way we live our daily lives and result from a convergence of different underlying trends including innovation, politics, demographics, social attitudes and lifestyles. They provide important tailwinds to individual stocks and sectors, that reside within them. Insync believe this delivers exponential earnings growth ahead of market expectations. Insync screens the universe of 40,000 listed global companies to just 150 that it views as superior. This includes profitability, balance sheet performance, shareholder focus and valuations. 20-40 companies are then chosen for the portfolio. These reflect the best outcomes from further analysis using a proprietary DCF valuation, implied growth modelling, and free cash flow yield; alongside management, competitor, and industry scrutiny. The Fund may hold some cash (maximum of 5%), derivatives, currency contracts for hedging purposes, and American and/or Global Depository Receipts. It is however, for all intents and purposes, a 'long-only' fund, remaining fully invested irrespective of market cycles. |
| Manager Comments | The Insync Global Quality Equity Fund has a track record of 12 years and 2 months and has outperformed the Global Equity Index since inception in October 2009, providing investors with a return of 14.39%, compared with the index's return of 11.96% over the same time period. On a calendar basis the fund has had 1 negative annual return in the 12 years and 2 months since its inception. Its largest drawdown was -12.64% lasting 7 months, occurring between September 2018 and April 2019 when the index fell by a maximum of -10.57%. The Manager has delivered higher returns but with higher volatility than the index, resulting in a Sharpe ratio which has never fallen below 1 and currently sits at 1.08 since inception. The fund has provided positive monthly returns 81% of the time in rising markets, and 22% of the time when the market was negative, contributing to an up capture ratio since inception of 81% and a down capture ratio of 73%. |
| More Information |

19 Nov 2021 - Performance Report: Bennelong Twenty20 Australian Equities Fund
| Report Date | |
| Manager | |
| Fund Name | |
| Strategy | |
| Latest Return Date | |
| Latest Return | |
| Latest 6 Months | |
| Latest 12 Months | |
| Latest 24 Months (pa) | |
| Annualised Since Inception | |
| Inception Date | |
| FUM (millions) | |
| Fund Overview | |
| Manager Comments | The Bennelong Twenty20 Australian Equities Fund has a track record of 12 years and 1 month and has consistently outperformed the ASX 200 Total Return Index since inception in November 2009, providing investors with a return of 11.91%, compared with the index's return of 8.34% over the same time period. On a calendar basis the fund has had 2 negative annual returns in the 12 years and 1 month since its inception. Its largest drawdown was -26.09% lasting 9 months, occurring between February 2020 and November 2020 when the index fell by a maximum of -26.75%. The Manager has delivered higher returns but with higher volatility than the index, resulting in a Sharpe ratio which has fallen below 1 four times and currently sits at 0.74 since inception. The fund has provided positive monthly returns 97% of the time in rising markets, and 8% of the time when the market was negative, contributing to an up capture ratio since inception of 129% and a down capture ratio of 96%. |
| More Information |

19 Nov 2021 - Crypto Revolution in Gaming
|
Crypto Revolution in Gaming Michael Frazis, Frazis Capital Partners 02 November 2021 Part 2 of a series on Web31 exploring the impact on highly disparate aspects of the human experience: art, music, science, crime, capital, business, payments and, of course, investment opportunities. As with art and music, crypto is formalising and dramatically enhancing nascent human behaviour in gaming. Long before Web3, there were people with plenty of time but no money, building characters in games for people with money but no time. Countless hours were sunk into games like Runescape, where characters wander around a richly developed world doing quests, mining for ores, smelting that ore into metal, then forging that into weapons to be sold for in game currency, or used in battle in the wild regions. Those that died in battle lost everything they held, and characters with any kind of credibility represented years of play time. A Runescape village, where you might smelt some ore, deposit goods in the bank, or shop. World of Warcraft had an even richer world and a wealthier audience. Players in poorer countries spent huge amounts of time building valuable characters and selling them: on an hourly rate, it was competitive with whatever else was on offer. The problem with all this is that these worlds are under the firm control of companies who made this activity illegal. Interestingly, the centralised control of traditional gaming was a key motivator for the then-teenage Vitalik Buterin to create Ethereum, after Blizzard disabled hard-earned abilities on his World of Warcraft character. And there was plenty of fraud and skullduggery that made transacting a minefield for all involved. People who accrue value in one game can immediately exchange it on extremely liquid marketplaces. Axie Infinity The largest NFT2 game right now is Axie Infinity. Similar to Pokemon, you can buy, trade and fight with Axies. Axies can breed, replete with dominant and recessive characteristics, to create new and more valuable characters. Each funny little creature is unique and apparently the game is quite fun. Players can earn (relatively) hard currency by developing, fighting, and trading their Axies, and then safely transfer and store that value in crypto wallets - an aspect that was absent from all games prior. This has taken the Philippines by storm, is something of a gateway drug into crypto. 50% of Axie players had never used crypto before, and 25% didn't have a bank account (according to a founder). More info and a better explanation of the game here. Can't you have games like this without crypto? As with the examples of art and music: yes, but no. Yes, because earlier games did indeed develop vibrant economies. But no - you could not easily transfer value in and out, and there was no way for players to capture the value of the community they were building. There was no way to set new players up with secure wallets that could transact in a trusted way with people both in and out of the game. Companies could and often would squash out the nascent economies that developed. World of Warcraft's creator, Blizzard, made even the simplest kinds of transactions illegal. Human nature being what it is, a black economy developed anyway, albeit in a strained, risky, and hacky kind of way. All the value created by those endless years of gameplay was ultimately captured by the companies, not the players. The chance to change this is the real revolution. So how big is this use case, really? One of the beautiful things about crypto is that you can see every transaction. Every dollar of revenue is on chain and searchable. Imagine if you could do that in public markets, see day-by-day revenue of every company, and invest accordingly. We certainly wouldn't have to stress about reporting seasons in the same way. That is exactly what happens in crypto, which may partly explain why things move so fast. We can say with some certainty that Ethereum generated over $1 billion over the last 30 days in transaction fees, paid directly to the validator nodes. Axie Infinity generated $190 million, a greater than $2 billion run rate.
Which means there is a veritable monthly fortune on offer for players in the Philippines and countries like Nigeria, Venezuela, and Ghana. Unsurprisingly, Blizzard, Steam, Apple, all the game publishers and developers aren't so keen on these kinds of value transfers to players, and have all actively banned games that incorporate NFTs and crypto, missing an extraordinary opportunity.
Early users and adopters become hyper-engaged financial stakeholders in a way that conventional corporations never allowed, which is one reason why people in Web3 are so obsessed with their chosen communities. Sandbox
One of the more surprisingly successful traditional games is Minecraft, which was bought by Microsoft for $2.5 billion in 2014, an absolute steal. Sandbox takes this concept into the crypto Metaverse. Block-by-block creations in Minecraft - imagine what people would make with an economic incentive? VoxEdit allows players to make and animate (with sounds) their own NFTs in the Sandbox. Assets are bought and sold using SAND tokens, and if you don't want to create, or buy, but believe in the concept, you can buy the tokens outright.
Sandbox tokens have been on a bit of a run late And Sandbox has sold real estate on their world for increasingly spectacular sums: A map of The Sandbox While the full game is yet to launch (expected early next year), this is a tantalising application of Web3. Facebook's Metaverse, as if meetings weren't bad enough already. You're on mute! Star Atlas In Star Atlas, also under development, players buy Starcraft NFTs and explore a rich universe with real monetary value up for grabs. Players can discover planets, mine asteroids and accrue real cryptocurrency while playing. A US$30,000 starship for sale As with games like Runescape, players can form alliances and leave safe parts of the map, to commit violence on whoever they find in the uncharted wilder regions, again an intensification of existent gaming behaviour. Only, in the crypto Web3 version, where entry level capital starships are priced in the tens of thousands, the stakes are much higher. 1 Web1, Web2, Web3: three stages of internet growth. Web 1.0 - connecting information and getting on the net. Web 2.0 - connecting people / social participation. Web 3.0 - use of machine learning and artificial intelligence to create more open, connected, and intelligent websites or web applications; includes decentralised apps that run on blockchain. 2 A non-fungible token is a unique and non-interchangeable datum stored on a digital ledger. NFTs can be used to represent easily reproducible items such as photos, videos, audio, and other types of digital files as unique items, and use blockchain technology to establish a verified and public proof of ownership. Funds operated by this manager:
Disclaimer The information in this note has been prepared and issued by Frazis Capital Partners Pty Ltd ABN 16 625 521 986 as a corporate authorised representative (CAR No. 1263393) of Frazis Capital Management Pty Ltd ABN 91 638 965 910 AFSL 521445. The Frazis Fund is open to wholesale investors only, as defined in the Corporations Act 2001 (Cth). The Company is not authorised to provide financial product advice to retail clients and information provided does not constitute financial product advice to retail clients. The information provided is for general information purposes only, and does not take into account the personal circumstances or needs of investors. The Company and its directors or employees or associates will use their endeavours to ensure that the information is accurate as at the time of its publication. Notwithstanding this, the Company excludes any representation or warranty as to the accuracy, reliability, or completeness of the information contained on the company website and published documents. The past results of the Company's investment strategy do not necessarily guarantee the future performance or profitability of any investment strategies devised or suggested by the Company. The Company, and its directors or employees or associates, do not guarantee the performance of any financial product or investment decision made in reliance of any material in this document. The Company does not accept any loss or liability which may be suffered by a reader of this document.
|

18 Nov 2021 - Performance Report: Paragon Australian Long Short Fund
| Report Date | |
| Manager | |
| Fund Name | |
| Strategy | |
| Latest Return Date | |
| Latest Return | |
| Latest 6 Months | |
| Latest 12 Months | |
| Latest 24 Months (pa) | |
| Annualised Since Inception | |
| Inception Date | |
| FUM (millions) | |
| Fund Overview | Paragon's unique investment style, comprising thematic led idea generation followed with an in depth research effort, results in a concentrated portfolio of high conviction stocks. Conviction in bottom up analysis drives the investment case and ultimate position sizing: * Both quantitative analysis - probability weighted high/low/base case valuations - and qualitative analysis - company meetings, assessing management, the business model, balance sheet strength and likely direction of returns - collectively form Paragon's overall view for each investment case. * Paragon will then allocate weighting to each investment opportunity based on a risk/reward profile, capped to defined investment parameters by market cap, which are continually monitored as part of Paragon's overall risk management framework. The objective of the Paragon Fund is to produce absolute returns in excess of 10% p.a. over a 3-5 year time horizon with a low correlation to the Australian equities market. |
| Manager Comments | The Paragon Australian Long Short Fund has a track record of 8 years and 9 months and has consistently outperformed the ASX 200 Total Return Index since inception in March 2013, providing investors with a return of 15.36%, compared with the index's return of 8.64% over the same time period. On a calendar basis the fund has had 1 negative annual return in the 8 years and 9 months since its inception. Its largest drawdown was -45.11% lasting 2 years and 7 months, occurring between January 2018 and August 2020 when the index fell by a maximum of -26.75%. The Manager has delivered higher returns but with higher volatility than the index, resulting in a Sharpe ratio which has fallen below 1 five times and currently sits at 0.65 since inception. The fund has provided positive monthly returns 69% of the time in rising markets, and 46% of the time when the market was negative, contributing to an up capture ratio since inception of 113% and a down capture ratio of 77%. |
| More Information |

18 Nov 2021 - Performance Report: Premium Asia Fund
| Report Date | |
| Manager | |
| Fund Name | |
| Strategy | |
| Latest Return Date | |
| Latest Return | |
| Latest 6 Months | |
| Latest 12 Months | |
| Latest 24 Months (pa) | |
| Annualised Since Inception | |
| Inception Date | |
| FUM (millions) | |
| Fund Overview | The Fund is managed by Value Partners using a disciplined value-oriented approach supported by intensive, on-the-ground bottom-up fundamental research resulting in a portfolio of individual holdings, which are, in the view of Value Partners, undervalued and of high quality, on either an absolute or relative basis, and which have the potential for capital appreciation. The Fund will primarily have exposure to the equity securities of entities listed on securities exchanges across the Asia (ex-Japan) region, however, the Fund may also gain exposure to entities listed on securities outside the Asia (ex-Japan) region which have significant assets, investments, production activities, trading or other business interests in the Asia (ex-Japan) region as well as unlisted instruments with equity-like characteristics, such as participatory notes and convertible bonds. The Fund may also invest in cash and money market instruments, depositary receipts, listed unit trusts, shares in mutual fund corporations and other collective investment schemes (including real estate investment trusts), derivatives including both exchange-traded and OTC, convertible securities, participatory notes, bonds, and foreign exchange contracts. |
| Manager Comments | The Premium Asia Fund has a track record of 12 years and has consistently outperformed the MSCI All Country Asia Pacific ex-Japan Index since inception in December 2009, providing investors with a return of 11.98%, compared with the index's return of 5.8% over the same time period. On a calendar basis the fund has had 2 negative annual returns in the 12 years since its inception. Its largest drawdown was -21.41% lasting 1 year and 11 months, occurring between June 2015 and May 2017 when the index fell by a maximum of -19.56%. The Manager has delivered higher returns but with higher volatility than the index, resulting in a Sharpe ratio which has fallen below 1 twice and currently sits at 0.77 since inception. The fund has provided positive monthly returns 89% of the time in rising markets, and 20% of the time when the market was negative, contributing to an up capture ratio since inception of 161% and a down capture ratio of 91%. |
| More Information |
18 Nov 2021 - Performance Report: Bennelong Emerging Companies Fund
| Report Date | |
| Manager | |
| Fund Name | |
| Strategy | |
| Latest Return Date | |
| Latest Return | |
| Latest 6 Months | |
| Latest 12 Months | |
| Latest 24 Months (pa) | |
| Annualised Since Inception | |
| Inception Date | |
| FUM (millions) | |
| Fund Overview | |
| Manager Comments | The Bennelong Emerging Companies Fund has a track record of 4 years and therefore comparison over all market conditions and against the fund's peers is limited. However, since inception in November 2017, the fund has outperformed the ASX 200 Total Return Index, providing investors with an annualised return of 30.4%, compared with the index's return of 9.6% over the same time period. On a calendar basis the fund has had 1 negative annual return in the 4 years since its inception. Its largest drawdown was -41.74% lasting 10 months, occurring between December 2019 and October 2020 when the index fell by a maximum of -26.75%. The Manager has delivered higher returns but with higher volatility than the index, resulting in a Sharpe ratio which has fallen below 1 once and currently sits at 1.01 since inception. The fund has provided positive monthly returns 85% of the time in rising markets, and 36% of the time when the market was negative, contributing to an up capture ratio since inception of 321% and a down capture ratio of 119%. |
| More Information |

18 Nov 2021 - Why froth can't burn your tongue
|
Why froth can't burn your tongue Spatium Capital November 2021 The origin of the term "frothy" - in an investment context - is disputed, but many attribute it to Alan Greenspan. The former Chairman of the US Federal Reserve is believed to have normalised the word in his response to the state of the US housing market in 2005. Since the global financial crisis, the use of this word when referring to the markets has been looked upon ominously. In early 2019, the buzz surrounding the state of the frothy ASX was a lasting discussion. A frothy market is a state in which markets begin trading well above their tangible asset values, often because investors are ignoring fundamentals and making emotionally driven and speculative decisions (periods of which can endure for many quarters, if not years). The reason frothy markets are often so topical is historically these periods precede a burst of a market bubble. At least this was the case for the dotcom bust in 2001 and the housing crash (GFC) of 2007-2008. Given the almost two years since COVID19 first disrupted our lives, perhaps this latest episode is also one for the history books. The current argument we are seeing is the significant growth and interest in alternative 'asset' classes, mirroring the speculation-style dotcom and housing market catalysts for the two most recent frothy periods that preceded a burst bubble. With our eyes firmly on equities, we couldn't help but notice that Bitcoin, the most mainstream of the cryptocurrencies, took the quickest time (12 years) to reach $US1 trillion in market capitalisation. Bitcoin now joins an elite club of trillionaires alongside US household giants Microsoft (44 years), Apple (42 years), Amazon (24 years) and Google (21 years). Whether cryptocurrency will be the catalyst for the next bubble popping will likely only be realised in hindsight, however at the risk of playing into a false causality (falsely assuming events appear related and therefore causing one another) we prefer to remain impartial and observe. So are equities frothy right now? When comparing the equity markets amongst peer asset classes, there is some potential explanation to the current upward trend(s) that have occurred. Considering that many fixed income yields are currently heavily compressed, property rental yields in Australia aren't shifting nearly anywhere as quickly as the capital growth trend line and that bank term deposits are a heartbeat above zero, there is an argument to suggest that the stock market's liquidity, prospective growth profile and risk (in comparison to viable alternatives) is the beneficiary of this struggling peer group. Further, there is an argument to be made that equities, in contrast to some of these alternatives, might fare better in a rising inflation environment - a topic for another time. This enduring low yield environment does however shed light as to why some investors have found themselves including cryptocurrency as part of their asset allocation; when looking at the state of asset classes in this current environment the options for return (via speculation or yield) have become suddenly fewer. The final point we would add goes hand-in-fist with frothy markets; investing at all-time highs. Let's look at the below graph and reference what JP Morgan found when investigating all-time highs. Source: Ben Carlson, A Wealth of Common Sense, 'Investing in Stocks At All-Time Highs' As illustrated, it has been more lucrative over the last 30 years to invest at all-time highs, rather than shying away from these points and thereby attempting to market-time. We feel this is somewhat of an underappreciated phenomenon; whilst the brain naturally seeks out patterns in charts that highlight drop-offs such as the GFC, or the COVID drawdown (and consequently drives feelings of fear aversion and a flight to safety), it fails to identify the many, many times a market reaches an all-time high, and then continues to rise further. Startlingly, on average, key markets such as the US S&P500 set 16 new all-time highs a year. Like with all risk assets, including property, fixed income, shares and others, the long-term success of these asset classes has stood the test of time. The only true certainty is that diversification and patience are your best friends. Further, if diversification and patience are your best friends, conviction likely follows closely behind. As a fund manager, we approach each trading day with the pursuit of identifying mispriced equities and not trying to time this up or down movement of the broader index. Nor do we seek to fluctuate our cash weighting by keeping the fund's total assets 98-99% invested at all times. This approach minimises the human tendency to buy assets when prices are rising (and potentially overpaying) and selling when things get scary (and potentially selling at a discount). By maintaining a smooth and consistent approach to investing, irrespective of the asset class, one can work against this natural tendency. In conclusion, whilst the market might be considered frothy right now, we suggest in light of the above information that this might not necessarily be a bad thing. As Peter Lynch so famously said, "Far more money has been lost by investors preparing for corrections or trying to anticipate corrections than has been lost in corrections themselves." Funds operated by this manager: Spatium Small Companies Fund |

18 Nov 2021 - Why this market would freak out a Martian
|
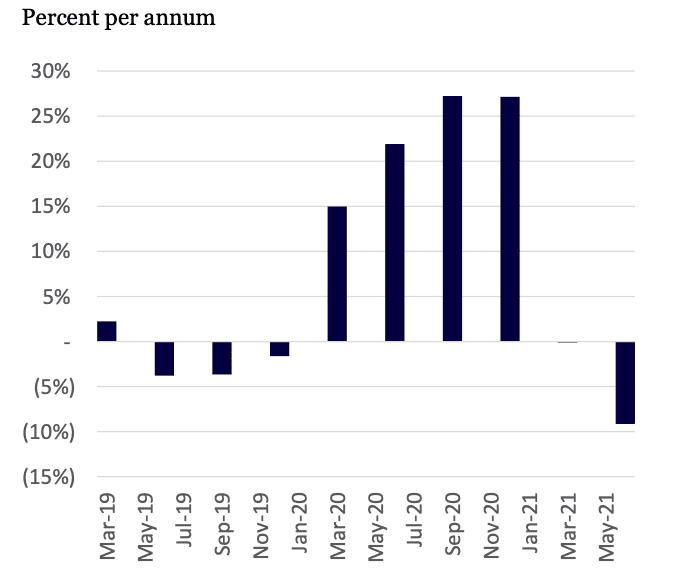
Why this market would freak out a Martian Montaka Global Investments 09 November 2021 If a Martian arrived on planet earth today, the global stock market would freak them out. This market is full of peculiarities. Mr Market - the personified term value investing legend Benjamin Graham used to describe the emotional swings of the market - is currently excited about narrative stocks, particularly 'reopening' and 'defensive' companies, and rewarding them with rich valuation multiples despite questionable fundamentals. At the same time, it is punishing companies with reliably growing profits and cash flows, particularly the world's leading mega techs, because of overblown concerns about inflation and regulation. On any given day, the market appears to be swept up in the prevailing narrative. What is missing is an objective outside examination of the facts that anchor sound investment decisions and underpin strong, long-term performance. Three examples of stocks in the reopening, defensive, and mega tech narratives highlight a market that would baffle a rational Martian. Are 'reopening up' stocks good investments? The first thing the Martian would see when he arrived on earth is that, as COVID-19 cases subside around the world, 'reopening' stocks are trading at very generous valuations. One is Royal Caribbean Cruises, the Florida-based cruise company that was severely impacted by the pandemic. When 'no sail orders' were introduced last year, its revenue literally fell to zero. With the reopening, around two-thirds of the company's fleet are now sailing and that should move to 100% over time. But the company's stock price is still one-third lower than pre-pandemic. The 'reopening up' narrative is often persuasive to Mr Market. Surely this investment represents easy money for the taking? Our Martian would say no. For a start, the company's balance sheet has become financially stretched: the ratio of net-debt-to-book-equity has more than doubled from 0.9 times to 2.2 times. So while its stock price is below pre-pandemic levels, its enterprise value (EV) - the company's total value including borrowings - has well and truly reflated back to pre-pandemic levels. So the company is not as cheap as one might think. Royal Caribbean Cruises Source: Bloomberg If our Martian assumed that earnings will return to pre-pandemic levels relatively soon (the company is currently loss-making), they would see that based on its current enterprise value, the company has an EV ratio of 20 times this recovered level of earnings (EBIT). A rational Martian would be bewildered that the market has put such a high valuation on this company. Why would Mr Market be willing to pay such a high multiple of fully-recovered earnings for a heavily-indebted cruise business that remains years away from pre-pandemic profitability - in an industry that will also expand capacity at double-digit rates over the coming years, adding downward pressure to ticket prices? All kinds of 'reopening-exposed' businesses, from airlines, travel agents, and live entertainment businesses, have seen their EVs fully-recover to pre-pandemic levels, despite earnings being years away from their fully recovered levels. Are 'defensive' stocks safe? Meanwhile, our Martian would also hear a narrative around markets being 'stretched' and observe some investors turning to defensive stocks which have become similarly irrationally overvalued. In California, The Clorox Company, a large producer and marketer of branded household cleaning products has a great, defensive business. Households continually buy their bleach, sanitizer, and stain removers irrespective of the natural ebbs and flows of the economy. It makes sense to Mr Market, therefore, that if the markets are feeling toppy, hiding out in companies like Clorox provides some safety. But our Martian would not think this company's stock is particularly safe at all. Its growth has recently turned negative. During the pandemic, its business grew rapidly when Americans rushed to stock their homes with cleaning products. But today that growth is naturally much harder to come by. It is hitting the inevitable 'air pocket' that follows such a drastic pull-forward in demand. The Clorox Company - Revenue Growth Source: Company Filings The company is also being hit by higher costs. The rising costs of commodity inputs and transport are materially impacting on profitability. In the company's most recent quarter, for example, its gross margin fell 10 percentage points relative to the same period in the prior year. Yet Mr Market has awarded the company a valuation that implies strong performance for years to come. Its ratio of EV to next year's earnings (EBIT) is 23 times - a materially higher ratio than even before the pandemic. Our Martian would once again be confused: this hardly feels like a safe investment offering protection from 'stretched' stock prices. Again, this dynamic is not isolated to Clorox. We are seeing similar dynamics in a wide range of branded consumer packaged goods businesses, as well as utilities - all of which are considered by Mr Market to be 'defensive' today.
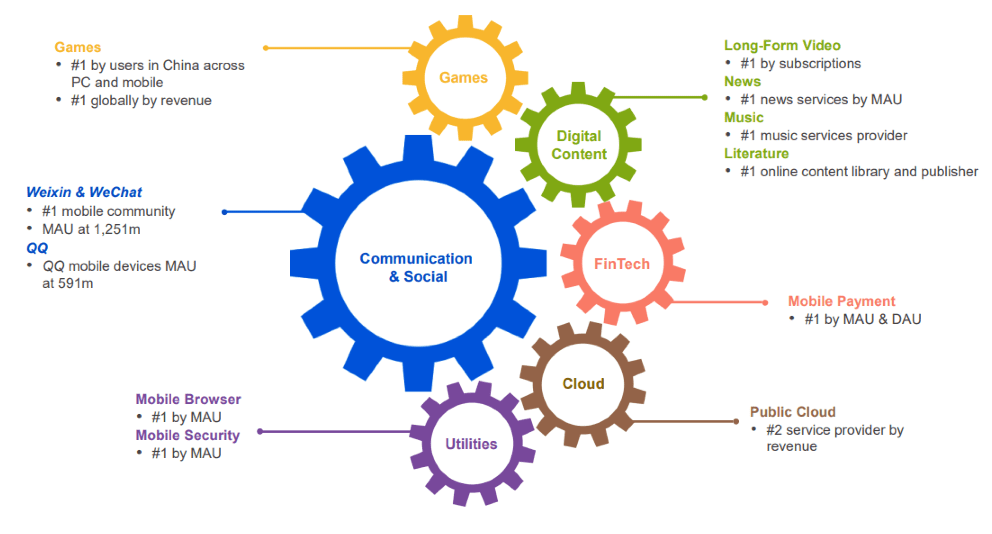
Are mega-tech's best days in the past? While our Martian sees 'reopening up' and 'defensive' stocks trading high, they would also see mega tech companies with great fundamentals being punished amid the 'mega-tech is dead' rotation due to concerns about inflation, regulation or other reasons that seem to justify the narrative Shenzhen-based Tencent is one example. It owns the most widely used digital communications applications in China. With 1.2 billion members in its mobile community, this business owns a privileged platform for social communication (both personal and professional) as well as gaming, news, music, video, e-commerce, and payments.
Tencent - A Platform of Platforms Source: Company Presentation This company also happens to own China's second-largest cloud computing business. It is rapidly building out leading enterprise applications and platform tools, which are the Chinese equivalent of Salesforce, Shopify, Zoom and Microsoft Office. These are not monetised today and, instead, represent valuable future growth options. But despite this powerful position, our Martian would see the stock is seriously undervalued. The ratio of enterprise value (excluding a large portfolio of equity investments) to next year's operating earnings (EBIT) is just 16 times. Unlike the reopening-up and defensive stocks above, our Martian would find this stock very interesting. A business of this quality, growing 15-20% per annum for at least the next five years and beyond, with an attractive collection of large, high-probability future growth options, yet trading at a reasonable price. And it's not just in China where these disconnects between the valuations of mega techs and their high business quality are occurring. In the US, for example, Mr Market is willing to sell you Facebook at less than 18 times next year's operating earnings. To our Martian, buying Tencent and Facebook from Mr Market - and selling him Royal Caribbean and Clorox seems logical. What is an investor to do? So how should an investor play a market that would baffle a rational Martian? It depends on your investment time horizon. Investors looking to make money next week, next month, or even next year have their work cut out for them. Anticipating Mr Market's mood swings - which change on a dime - is not easy and may well be impossible to do on a sustainable basis. But for investors, like us at Montaka, who are seeking to compound capital over the long-term - think ten, 20 years and beyond - the answer is to always let your investment decisions be guided by the facts, such as the strength of business advantages, the long-term growth of industries and the fair mappings of business earnings drivers to present values today. As Benjamin Graham famously told Warren Buffett:
Let the facts liberate you from the short-term mood swings of Mr Market. In the current market that means not getting sucked into short-term reopening and defensive narrative trades and focusing on owning the long-term winning businesses in the world's most attractive markets. Investing for the long-term by looking through the short-term noise means that your portfolio will perform differently to that of your peers but staying the course - as challenging as that can be - will yield the long-term rewards. Funds operated by this manager: Montaka Global 130/30 Fund, Montaka Global Fund, Montaka Global Long Only Fund |

17 Nov 2021 - Performance Report: Insync Global Capital Aware Fund
| Report Date | |
| Manager | |
| Fund Name | |
| Strategy | |
| Latest Return Date | |
| Latest Return | |
| Latest 6 Months | |
| Latest 12 Months | |
| Latest 24 Months (pa) | |
| Annualised Since Inception | |
| Inception Date | |
| FUM (millions) | |
| Fund Overview | Insync invests in a concentrated portfolio of high quality companies that possess long 'runways' of future growth benefitting from Megatrends. Megatrends are multiyear structural and disruptive changes that transform the way we live our daily lives and result from a convergence of different underlying trends including innovation, politics, demographics, social attitudes and lifestyles. They provide important tailwinds to individual stocks and sectors, that reside within them. Insync believe this delivers exponential earnings growth ahead of market expectations. The fund uses Put Options to help buffer the depth and duration that sharp, severe negative market impacts would otherwide have on the value of the fund during these events. Insync screens the universe of 40,000 listed global companies to just 150 that it views as superior. This includes profitability, balance sheet performance, shareholder focus and valuations. 20-40 companies are then chosen for the portfolio. These reflect the best outcomes from further analysis using a proprietary DCF valuation, implied growth modelling, and free cash flow yield; alongside management, competitor, and industry scrutiny. The Fund may hold some cash (maximum of 5%), derivatives, currency contracts for hedging purposes, and American and/or Global Depository Receipts. It is however, for all intents and purposes, a 'long-only' fund, remaining fully invested irrespective of market cycles. |
| Manager Comments | The Insync Global Capital Aware Fund has a track record of 12 years and 2 months and has outperformed the Global Equity Index since inception in October 2009, providing investors with a return of 12.38%, compared with the index's return of 11.96% over the same time period. On a calendar basis the fund has had 2 negative annual returns in the 12 years and 2 months since its inception. Its largest drawdown was -10.98% lasting 7 months, occurring between September 2018 and April 2019 when the index fell by a maximum of -10.57%. The Manager has delivered higher returns but with higher volatility than the index, resulting in a Sharpe ratio which has fallen below 1 once and currently sits at 0.97 since inception. The fund has provided positive monthly returns 80% of the time in rising markets, and 24% of the time when the market was negative, contributing to an up capture ratio since inception of 57% and a down capture ratio of 66%. |
| More Information |
17 Nov 2021 - Performance Report: Bennelong Concentrated Australian Equities Fund
| Report Date | |
| Manager | |
| Fund Name | |
| Strategy | |
| Latest Return Date | |
| Latest Return | |
| Latest 6 Months | |
| Latest 12 Months | |
| Latest 24 Months (pa) | |
| Annualised Since Inception | |
| Inception Date | |
| FUM (millions) | |
| Fund Overview | |
| Manager Comments | The Bennelong Concentrated Australian Equities Fund has a track record of 12 years and 10 months and has consistently outperformed the ASX 200 Total Return Index since inception in February 2009, providing investors with a return of 17.83%, compared with the index's return of 10.49% over the same time period. On a calendar basis the fund has had 2 negative annual returns in the 12 years and 10 months since its inception. Its largest drawdown was -24.11% lasting 6 months, occurring between February 2020 and August 2020 when the index fell by a maximum of -26.75%. The Manager has delivered higher returns but with higher volatility than the index, resulting in a Sharpe ratio which has fallen below 1 once and currently sits at 1.03 since inception. The fund has provided positive monthly returns 92% of the time in rising markets, and 19% of the time when the market was negative, contributing to an up capture ratio since inception of 165% and a down capture ratio of 91%. |
| More Information |