
NEWS

1 Dec 2021 - Fixed Income Dilemma
|
Fixed Income Dilemma Laureola Advisors 14 November 2021 The global financial crisis, COVID and bank deposit rates that are often negative in some countries means that the need for diversification of retirement earnings is not a textbook concept. As part of the process of formulating and regularly reviewing the Self-Managed Super Fund (SMSF) investment strategy, there is a requirement to consider diversification. Diversify how? Share market is booming but most portfolios can't take anymore equities' risk. SMSFs need to spread their capital across a range of investment types to reduce the risk of being exposed to one or a small number of poorly performing investments. SMSFs looking for assets that are uncorrelated with equity markets could consider investments such as life settlement funds, which invest in United States life insurance policies. Bonds offer no respite from low returns Bonds no longer offer the traditional and desired characteristics of diversification, cash income to beat inflation and providing investors with "Sleep at Night" comfort levels. Fixed income offers fundamental investors no respite. Government bonds yield near zero, despite the Fed abandoning its inflation targets in favour of job growth. Speculative High Yield bonds offer 5.6%, but with rapidly deteriorating credit risk. The worst news for bond investors may come from Credit Suisse, whose analysis confirms that, in today's markets, bonds no longer offer diversification from equity risk. Many investors have turned to real estate or real estate debt for fixed income alternatives but there are danger signs here too. One asset class still providing an attractive risk/return profile is Life Settlements, which continues to offer strong fundamentals, an above average yield, low credit risk, and genuine diversification. Written By Tony Bremness Funds operated by this manager: |

1 Dec 2021 - 4D podcast - the role of infrastructure in reaching net zero
|
4D podcast - the role of infrastructure in reaching net zero 4D Infrastructure 01 November 2021 With the COP26 summit upon us, Sarah Shaw weighs in on decarbonisation. "Decarbonisation must happen, and the goal of net zero is just not achievable without the right form of infrastructure investment." With COP26 dominating conversation in Australia, 4D's Sarah Shaw speaks with Bennelong's Holly Old about the role infrastructure will play in the decarbonisation opportunity, particularly within high carbon-emitting industries such as energy and transport. Speaker: Sarah Shaw, 4D Infrastructure Chief Investment Officer (CIO) Time Stamps: |
|
Funds operated by this manager: 4D Global Infrastructure Fund, 4D Emerging Markets Infrastructure Fund |

1 Dec 2021 - What to do with Miserly Cash and Bonds
|
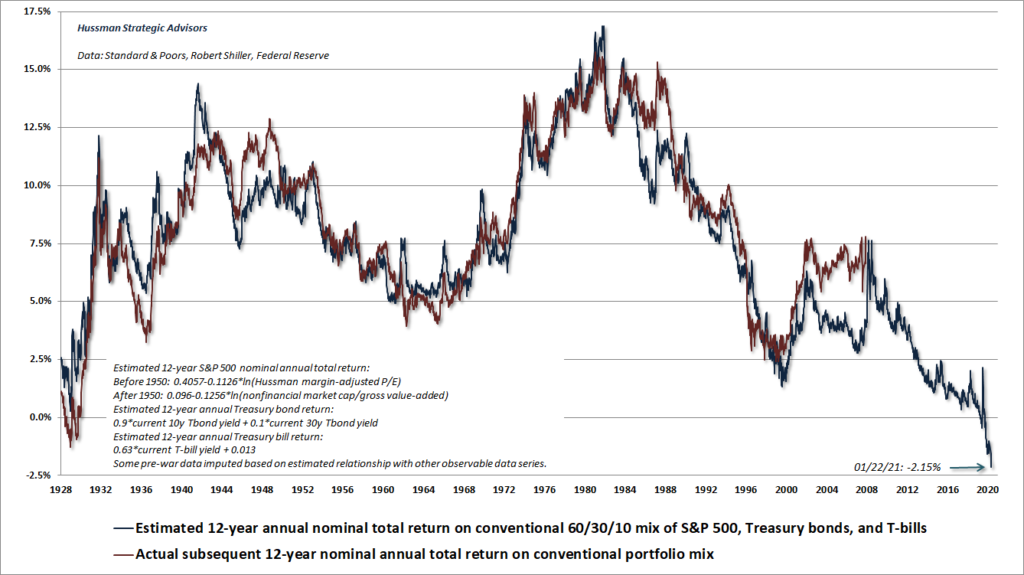
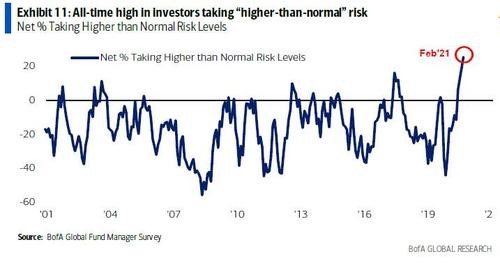
What to do with Miserly Cash and Bonds Wealthlander Active Investment Specialist 24 November 2021 Introduction Investors naturally fleeing cash and bonds in response to inadequate yields, poor prospective returns, and government monetary and fiscal policies. The narrative of "There Is No Alternative" (TINA) is rampant as investors look to equities as the go-to asset class for a significant proportion of their capital. Unfortunately, this appears imprudent and could even potentially prove entirely mistaken. In this article, we will explore the critical mistake investors are making in thinking "There is No Alternative" when considering their asset allocation and reveal a real emerging alternative to low cash and bond rates. We will explore how this alternative is essential to a good investment and incredibly prospective in terms of meeting prudent absolute return investor objectives and provides a less risky option to being all-in on risk assets. Why Cash and Bonds are on the Nose? Many investors and institutions allocate their assets among some combination of the following asset classes: cash, bonds, property, and equities, in line with their perceived risk profile and investment mandates. Cash and bonds are the traditional defensive assets while property and equities are the traditional risk-on or growth assets. The traditional 60:40 portfolio, or a variation thereof, is used as a kind of passive and lazy basis for portfolios for institutional investment management for the last 40 years. It includes 60% equities and property and 40% cash and bonds. It has been effective historically at producing modest risk-adjusted returns as it has benefited across the board from disinflation and lower interest rates, which has been a structural trend since the early 1980s. However, now that cash rates have gone all the way to 0 (0.1% in Australia) and bonds have a circa 1% yield, history will not be able to repeat itself in coming years. Furthermore, it is realistic that we may even see the reverse happening as inflation and interest rates begin to rise. Hence, in contrast to seeing the lovely tailwind for all traditional asset portfolios, we may very realistically see a significant and adverse macroeconomic headwind in the coming years. Furthermore, these asset classes are not priced for this to occur as they - and consensus - are dominated by passive investors who are largely trend following in nature, and who buy irrespective of value. It shows by the exponential growth of passive ETFs that predominantly track a market benchmark. If the massive structural trend changes, traditional assets, and portfolios can be expected to lose from the change in a big way. Most notably, higher inflation is terrible for most non-inflation indexed bonds (and long-duration assets). Higher discount rates would also challenge highly elevated property and equity valuations that are dependent on low discount rates. Some of these growth assets are arguably deeply divorced from fundamentals because of the TINA mantra and a broad consensus belief that central banks can be relied upon to keep interest rates low forever. Interestingly, there are credible forecasts such as Hussman (see chart below), that equities may not provide the high returns investors are generally expecting. Cash and bonds - even with low-interest rates - are priced to provide inadequate returns to meet even modest return expectations. Investors are hence needing alternative investments with greater return prospects and different rather than common, drivers of return and risk. Predicted and Actual Returns on Conventional 60/30/10 Portfolios
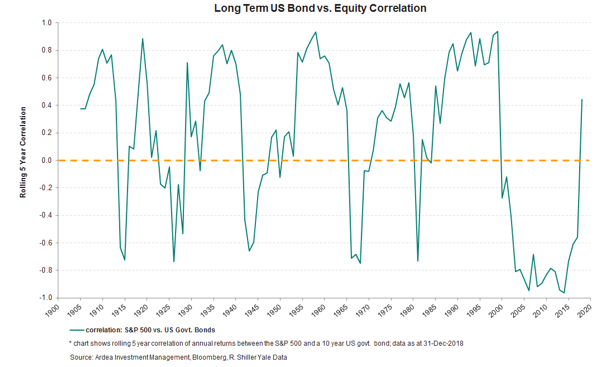
Source: Hussman Funds Bonds have often been included in a portfolio for their diversification benefits, on the view that they will perform well when equities underperform and hence lower the huge risk from being only inequities. However, this relies heavily upon bonds having a negative correlation with equities. Unfortunately, history tells us even this cannot be relied upon - and given starting yields and key portfolio risks such as inflation and higher yields today - we should not rely upon bonds being diversifying, as they may not be. There are many times in history when bonds simply do not diversify equity risk, most particularly when inflation rises, and long-term interest rate expectations rise too fast or above critical levels. Given current government policy around the world is to print and spend with abandon until we get inflation or some other calamity, inflation as a risk should clearly not be ruled out. Disinflation should simply no longer be relied upon as the basis to build an entire portfolio, which as an aside basically completely invalidates most passive portfolio approaches. Paradoxically, these portfolios or index-focused investment styles are more popular than ever. Furthermore, we know from watching central banks for a very long time that their prognostications about future interest rates and inflation have routinely been incorrect. In contrast, they can be somewhat relied upon to follow the market when market conditions push them to do so. They are also influenced by banks and other market participants pushing them around publicly and otherwise when it suits them - indeed we know of at least one activist fund manager that does this to the RBA (and presumably he does so because he thinks it is effective). One of the greatest fallacies we commonly hear is that central banks control our economies and determine growth and inflation and other economic settings. Simply, we don't believe there is any compelling evidence to suggest they control these. Hence, don't assume they do.
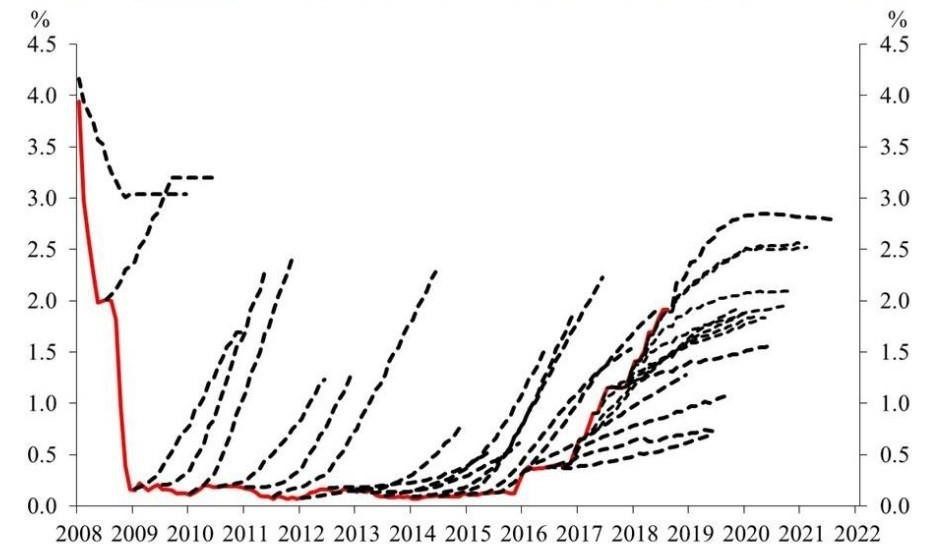
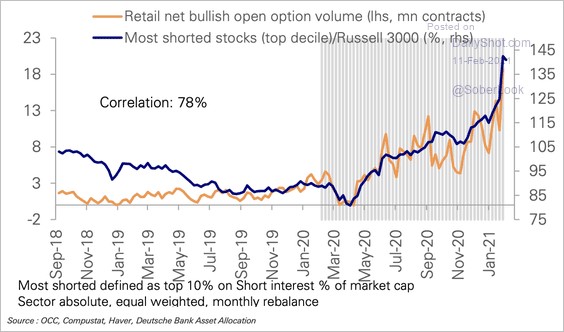
Source: FRB, Bloomberg Finance LP, DB Global Research. Note: Data for the graph courtesy of Torsten Slok, Deutsche Bank Whether you stick with the traditional portfolio or move more into equities, if you are constrained to traditional long-only assets, you will probably end up with a much riskier and lower returning portfolio today than you had before. Bonds may no longer protect and diversify, and equity risk is escalating with the nature of the investors in equities and higher valuations bringing down future return forecasts. There is certainly plenty to be concerned about contrary to consensus (and I haven't even mentioned Taiwan). Expect a Paradigm Shift We can see rampant signs of speculation on equities, and the period we're living through is very reminiscent of late 1999. For instance, there is massive call volume bidding up the prices of the worst quality and most shorted stocks in the market (see diagram below), as well as less shorting in markets than we've seen for a very long time. We could potentially see continuing rises on equities driven by price-insensitive buyers such as index investors and speculators, before a massive market collapse similar to 1987 or early 2000 when the trend reverses. This is what happens in bubbles - they become removed from fundamentals, escalate, last longer than anyone expects, and then - often with unpredictable timing - they collapse. Bidding up the Prices of the Worst Quality and Most Shorted Stocks in the Market Source: OCC, Compustat, Haver, Deutsche Bank Asst Allocation Note: Most shorted defined as top 10% on short interest % of market cap. Sector absolute, equal weighted, monthly rebalance. We have not had high and increasing inflation for decades. It should be clear that while "this time may not be different", it is very different from the time period which most investors, advisers and institutions have worked through. Importantly, some advisers and institutions are inflexible and hopelessly ill-equipped to manage well anything other than a rising market. The real question is not what short-term return will be achieved while the bubble inflates, but whether your assets are being risk-managed and what your compounded return is over time when markets turn south. Given many investors are doing exactly what they did in early 2020 when we last witnessed great market complacency, it may be instructive to see what happened to your portfolios in early 2020; how badly was your approach hurt from a market crisis, and how quickly did your approach recover from these falls (if at all?). Prima facie, while it may be very exciting, far from increasing equities and risk assets into escalating prices and speculative mania, it could very reasonably be argued that it is more reasonable for a prudent investor to be reducing risk when risk-loving is rampant or at least not increasing their exposure. This is even more important for conservative investors or for those who can't tolerate huge losses. It is very difficult to tell when the music will stop, so playing musical chairs with dangerous markets will not suit more conservative investors who are averse to large drawdowns. We do not argue against owning equities selectively; indeed, we can still identify numerous pockets of attractive opportunities for active and well-researched investors. However, unquestionably a real need for great active management, a risk management focus and differentiated portfolio management. Why Modest Portfolio Management is Now More Important than Modern Portfolio Theory The only thing we know for sure is that we don't know for sure. Hence, it is crucial - no matter what we believe about anything - that we diversify our portfolios and our risk-taking. Of course, we can and should make significant probability-based assessments about the future, and if you are good at this, we can do so with some accuracy, but we should never forget that we can't predict the future per se. Hence, the main reason to be confident in my (or another) portfolio is not only because my research and judgment or opinion are accurate or useful, but that I will be sensibly diversified among numerous attractive active strategies. This diversification is no longer available in a portfolio by simply buying bonds to offset equities, or indeed by owning a few typical equities. By being better diversified you narrow the range of realistic return outcomes and create a better, more consistent, and more tolerable journey for your capital and peace of mind.
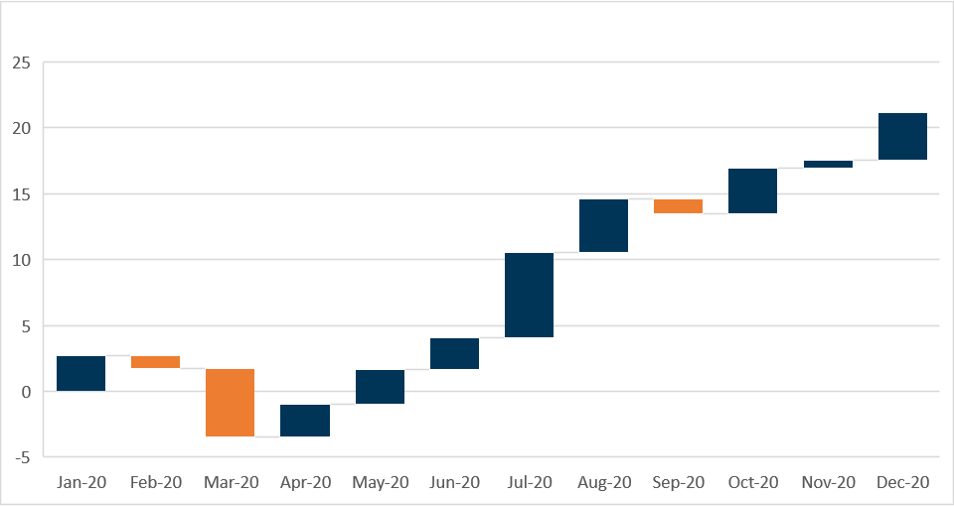
The "TINA" alternative crowd is overly narrow in its focus and overly confident by definition. There are many alternatives out there other than simple equities. Furthermore, in no small part because of all the inefficiencies and craziness in markets today, some of these alternative strategies are extremely promising and attractive investments - we consider many to have more than 10% outperformance potential compared to more commonly held investments. These opportunities are scarce and not easy to identify and will routinely be overlooked by the mainstream because they require a specialist skill set, training, and specialization to invest in well. Simply buying any alternative is no guarantee of success. Wholesale investors - such as those with SMSFs - have the potential opportunity to access the best alternatives because they are often only made accessible to wholesale investors. Wholesale investors should hence ensure that they are not missing out on these opportunities or being treated as retail investors and realizing much lower risk-adjusted returns than they should be. For those who can put themselves in a position to access it, a well-run and actively managed diversified alternative portfolio is a truly great alternative to being all-in on anything. Its results are also measurable and should speak for themselves over time with superior risk-adjusted returns. It is a better way to reduce cash and bonds without being overly concentrated on the same risks, as well as a great complement to investors' existing property portfolios. It is not without any risk - nothing is - but importantly, it has different risks and diversification greatly helps mitigate the risk of any individual strategy. Furthermore, while alternatives help reduce portfolio risk, they don't have to mean low returns. By way of example, during the turbulent 2020 calendar year, Dr. Jerome Lander was Portfolio Manager for an alternatives fund that achieved a net return of 21.13% with low volatility (circa 5%). This strong return compares favorably to single-digit returns across many asset classes including typical diversified funds such as large super funds during the same period (which was a historically important crisis period because of COVID-19). Alternative Fund Performance in 2020 - Net Return to Investors (%) 21.13% Total Net Return (Calendar Year 2020, LAIF)
Data Source for returns: LAIF, Mainstream fund services. LAIF is owned by a different firm and has different objectives and fees to the WealthLander Diversified Alternative Fund. The presentation of this information is designed to convey the quality of Dr Jerome Lander's work, not the performance potential of the WealthLander Diversified Alternative Fund. Past performance is not indicative of future performance. An active alternatives portfolio with an absolute return objective is aligned to what many investors want. It is designed around what matters most to many investors and quite possibly to you too as an investor. It targets lower volatility, lower drawdowns, and double-digit returns per annum, which is much higher than a traditional portfolio can expect - despite the lower market risk. It can even massively outperform equities as I did last year, particularly over a full cycle, given its lower drawdowns facilitate better long-term compounding. It has real return prospects unlike those of cash and bonds and its drawdowns should be tolerable and relatively quickly recovered from. The greater consistency, smoother return profile, and quicker recovery from drawdowns have a real benefit to investors, as it protects investors from buying high and selling low - which we know they are prone to do with many other strategies. It removes the fear factor of buying at the wrong time and immediately being exposed to huge losses from a market collapse. Conclusion It is necessary to adapt and alter investment behavior to changing market circumstances for investors to thrive and survive going forward. Traditional assets now have low long-term return prospects and could do anything in the short-term. There is a desperate need for a better-diversified portfolio in a world of potentially rising inflation. While cash and bonds offer poor return prospects and the need for alternatives is clear, being overly concentrated in long-only index-like equities at a time of great speculation could easily be considered imprudent, unprofessional, or at the very least, overly confident. A better-diversified portfolio provides different sources of returns to investors, including substantive and meaningful active management. It provides investors with much-needed exposure to incredibly attractive, differentiated, unique, and non-market-dependent opportunities. Although there is more than one alternative, it is the alternative that matters, and which is necessary today. Funds operated by this manager: |

30 Nov 2021 - Fund Review: Bennelong Kardinia Absolute Return Fund October 2021
BENNELONG KARDINIA ABSOLUTE RETURN FUND
Attached is our most recently updated Fund Review. You are also able to view the Fund's Profile.
- The Fund is long biased, research driven, active equity long/short strategy investing in listed ASX companies.
- The Fund has significantly outperformed the ASX200 Accumulation Index since its inception in May 2006 and also has significantly lower risk KPIs. The Fund has an annualised return of 8.63% p.a. with a volatility of 7.58%, compared to the ASX200 Accumulation's return of 6.60% p.a. with a volatility of 14.15%.
- The Fund also has a strong focus on capital protection in negative markets. Portfolio Managers Kristiaan Rehder and Stuart Larke have significant market experience, while Bennelong Funds Management provide infrastructure, operational, compliance and distribution capabilities.
For further details on the Fund, please do not hesitate to contact us.

30 Nov 2021 - Dissecting one of Berkshire Hathaway's greatest purchases - BNSF
|
Dissecting one of Berkshire Hathaway's greatest purchases - BNSF Datt Capital 08 November 2021 Disclaimer: This is a high level conceptual exercise and all figures are approximations using the CY2020 accounts. Funds operated by this manager: |
|
Disclaimer: This article does not take into account your investment objectives, particular needs or financial situation; and should not be construed as advice in any way. The author holds no exposure to the stock discussed |

30 Nov 2021 - Global equities market update and outlook for 2022
|
Global equities market update and outlook for 2022 Bell Asset Management 28 October 2021 |
|
|
Bell Asset Management Chief Investment Officer, Ned Bell discusses key themes that will influence global equity markets in the year ahead: geopolitics, global monetary policy, the economic cycle rotation and company earnings as well as responsible investing. Ned also looks at where the opportunities for investors may arise in 2022 and a look back at the lessons from this year.
|

29 Nov 2021 - Fund Review: Insync Global Capital Aware Fund October 2021
INSYNC GLOBAL CAPITAL AWARE FUND
Attached is our most recently updated Fund Review on the Insync Global Capital Aware Fund.
We would like to highlight the following:
- The Global Capital Aware Fund invests in a concentrated portfolio of 15-30 stocks, targeting exceptional, large cap global companies with a strong focus on dividend growth and downside protection.
- Portfolio selection is driven by a core strategy of investing in companies with sustainable growth in dividends, high returns on capital, positive free cash flows and strong balance sheets.
- Emphasis on limiting downside risk is through extensive company research, the ability to hold cash and long protective index put options.
For further details on the Fund, please do not hesitate to contact us.

29 Nov 2021 - Performance Report: Glenmore Australian Equities Fund
| Report Date | |
| Manager | |
| Fund Name | |
| Strategy | |
| Latest Return Date | |
| Latest Return | |
| Latest 6 Months | |
| Latest 12 Months | |
| Latest 24 Months (pa) | |
| Annualised Since Inception | |
| Inception Date | |
| FUM (millions) | |
| Fund Overview | The main driver of identifying potential investments will be bottom up company analysis, however macro-economic conditions will be considered as part of the investment thesis for each stock. |
| Manager Comments | The Glenmore Australian Equities Fund has a track record of 4 years and 5 months and therefore comparison over all market conditions and against the fund's peers is limited. However, since inception in June 2017, the fund has outperformed the ASX 200 Total Return Index, providing investors with an annualised return of 25.68%, compared with the index's return of 9.84% over the same time period. On a calendar basis the fund has never had a negative annual return in the 4 years and 5 months since its inception. Its largest drawdown was -36.91% lasting 13 months, occurring between October 2019 and November 2020. The Manager has delivered higher returns but with higher volatility than the index, resulting in a Sharpe ratio which has fallen below 1 once and currently sits at 1.13 since inception. The fund has provided positive monthly returns 92% of the time in rising markets, and 38% of the time when the market was negative, contributing to an up capture ratio since inception of 231% and a down capture ratio of 100%. |
| More Information |

29 Nov 2021 - Managers Insights | Glenmore Asset Management
|
|
||
|
Damen Purcell, COO of FundMonitors.com, speaks with Robert Gregory, Founder and Portfolio Manager at Glenmore Asset Management. The Glenmore Australian Equities Fund has a track record of 4 years and 5 months and since inception in June 2017 has outperformed the ASX 200 Total Return Index, providing investors with an annualised return of 25.68% compared with the index's return of 9.84% over the same time period.
|

29 Nov 2021 - The benefits of scale for private debt investors
|
The benefits of scale for private debt investors Metrics Credit Partners 22 November 2021 In private debt funds - unlike in boutique equity funds - there is a big payoff for investors from having a bigger loan book. Scale makes private debt providers more relevant to borrowers and investors, says Metrics Managing Partner Andrew Lockhart. Conventional wisdom says that by staying small, boutique managers can deliver superior returns. They are nimble and can move in and out of stocks without the burden of having to invest, even when conditions are not favourable. But what is true of equity managers does not hold for private debt providers. Increased scale makes a private debt manager more relevant to both the borrowers and the investors and provides more consistent returns. In this article we look at the reasons why, using the Metrics Credit Partners experience to illustrate the benefits. Metrics was established ten years ago, a pioneer in non-bank lending in Australia, by a team of three partners who worked at NAB and who had extensive experience in lending and portfolio risk management. Since then, Metrics has grown to a team of ~100 people with AUM of ~$10 billion. Metrics has not grown just for the sake of getting bigger, but because there are clear benefits for investors. Having scale makes Metrics more relevant to borrowers because access to non-bank debt finance can help them grow. With increased funding, Metrics can lend larger volumes to clients to help realise their plans. A smaller lender may not always have the capacity to match the needs of some borrowers and they don't have the certainty of capital that a larger lender provides. Metrics is not a bank. It is a minnow compared to the balance sheets of any of the Big Four. But it does not have their cost structure or rigid business practices, either. As one of the largest non-bank providers of debt finance to Australian businesses Metrics has the capability to match the needs of borrowers in a way that banks cannot. There are regulatory restrictions which impose a higher level of capital to be retained on balance sheets for banks that lend to business compared with lending for consumer purposes where the loan is secured against a residential property. This reduces the returns that a bank can generate from lending to companies which reduces their appetite to do so. But Metrics is focused on business and real estate lending. It has a highly skilled and a professional team with a deep understanding of each borrower, which means they can assess risk and price it accordingly. Through the recent wave of lockdowns that began in June 2021 Metrics again demonstrated its commitment to business borrowers. In the September quarter alone, Metrics financed in excess of $1.2 billion. By December, as the economy re-emerges from lockdowns, Metrics expects to finalise another $2 billion. It's unlikely any of our non-bank fund competitors can provide this volume of finance to Australian companies. All through this period Metrics has further added depth and breadth of expertise, increasing its team ~100 people. By resourcing teams in origination and risk assessment it has a larger more diverse team to consider more lending opportunities. That in turn delivers more attractive returns and capital preservation for investors. Contrast that with small private debt providers who claim to have the same benefits of a boutique equity investor. Their small scale means they can only do a handful of loans for a small number of clients before they reach capacity. That limits the potential of their borrowers. It also limits the managers ability to create diversified portfolios for their investors, increasing concentration and single large counterparty credit risk. The big global credit players setting up shop in Australia have a similar scale problem. On the face of it they have huge resources and big, well-known brand names to offer the local market. But the reality is that their local teams are small and lack the capacity to originate many good lending opportunities. When they do find one, the credit decisions are usually taken offshore, away from the relationships and understanding of local nuances that a larger, local private debt manager like Metrics provides. Being more relevant to borrowers has several important benefits for investors. Scale provides access to better deal flow, giving Metrics a better understanding of the market and the ability to focus on the best quality lending opportunities coming through. Having the ability to lend in larger size also means more negotiating power when determining the terms and conditions on the financing. It allows Metrics to tap sources of income - such as origination fees - that those smaller players cannot, generating better returns for investors. Scale also provides important risk management capabilities for investors, by allowing diversification across a wide range of industries and sectors. A larger portfolio of loans, where each exposure represents less than 1% of the total, provides cover against any one loan having an outsized impact on the returns to investors. This is also important in preserving investor capital, reducing concentration risk from any one borrower. Scale is only useful when it delivers better outcomes for borrowers and investors. Metrics' continued growth and performance reinforces this. This year alone, both listed funds have undertaken significant capital raisings to expand their capacity and continue to trade at a premium to their NAV. New additions to the Metrics suite of funds have and will continue to come to market to ensure those benefits of scale are realised for borrowers and investors alike. Funds operated by this manager: MCP Income Opportunities Trust (ASX: MOT), MCP Master Income Trust (ASX: MXT), Metrics Credit Partners Credit Trust, Metrics Credit Partners Direct Income Fund, Metrics Credit Partners Diversified Australian Senior Loan Fund, Metrics Credit Partners Real Estate Debt Fund, Metrics Credit Partners Secured Private Debt Fund II, Metrics Credit Partners Wholesale Investments Trust |