
NEWS

13 Dec 2021 - Performance Report: Bennelong Concentrated Australian Equities Fund
| Report Date | |
| Manager | |
| Fund Name | |
| Strategy | |
| Latest Return Date | |
| Latest Return | |
| Latest 6 Months | |
| Latest 12 Months | |
| Latest 24 Months (pa) | |
| Annualised Since Inception | |
| Inception Date | |
| FUM (millions) | |
| Fund Overview | |
| Manager Comments | The Bennelong Concentrated Australian Equities Fund has a track record of 12 years and 11 months and has consistently outperformed the ASX 200 Total Return Index since inception in February 2009, providing investors with a return of 17.73%, compared with the index's return of 10.38% over the same time period. On a calendar basis the fund has had 2 negative annual returns in the 12 years and 11 months since its inception. Its largest drawdown was -24.11% lasting 6 months, occurring between February 2020 and August 2020 when the index fell by a maximum of -26.75%. The Manager has delivered higher returns but with higher volatility than the index, resulting in a Sharpe ratio which has fallen below 1 once and currently sits at 1.03 since inception. The fund has provided positive monthly returns 92% of the time in rising markets, and 20% of the time when the market was negative, contributing to an up capture ratio since inception of 165% and a down capture ratio of 91%. |
| More Information |

13 Dec 2021 - Webinar | Premium China Funds Management
|
Webinar | Premium China Funds Management Gordon Ip, Fund Manager for the Premium Asia Income Fund, provided his views on current conditions and the outlook. Given the current uncertainty and volatility surrounding Chinese High Yield debt, this will be a timely and instructive deep-dive into Asian credit markets.
|

13 Dec 2021 - The revolving door of the Aussie share market
|
The revolving door of the Aussie share market Forager Funds Management 08 December 2021
It's been a busy, record-breaking year for the Australian share market. Not only did the S&P/ASX 200 close out its best financial year in two decades, but initial public offerings (IPOs) and mergers and acquisition (M&A) activity also reached new highs. So, where might opportunities lie in this avalanche of prospectuses and scheme deeds? On the way outM&A activity in 2021 has eclipsed the 2007 record, with corporate acquirers driven by cheap interest rates, low leverage at many listed companies, and an imperative to grow earnings. Meanwhile, private equity firms are sitting on a mountain of cash and super funds have entered the fray in a bigger way, seeking a home for accumulating retirement savings. A $23.6 billion bid for Sydney Airport (SYD) was announced recently and, if complete, will represent one of Australia's biggest ever buyouts. A $2.8 billion takeover bid was also proposed for fund administrator Link (LNK) - a rehash of last year's offer for the business. In another replay, Blackstone is back bidding for Crown (CWN). Premiums have also been higher than usual this year, averaging roughly 30%. Class Super (CL1) was bid for by HUB24 (HUB), with a staggering 72% premium. The Mainstream Group (MAI) takeover saga, which we chronicled in our June Monthly Report, finished with Apex Group paying $2.80 per share - 153% higher than where the business was trading before the initial bid. The $14 million for our remaining Mainstream shares landed in the Forager Australian Shares Fund's bank account at the end of October. A more recent example is Seven West Media (SWM), which made a bid for Prime (PRT) in October and handed Prime shareholders a 74% payday. By spending $72 million to fully own Prime, Seven West has paid just under three times earnings before interest, tax, depreciation and amortisation. Coupled with news that the company gained access to flexible new lending arrangements, its share price was more than 67% higher at the November peak. Breaking inWhile there were several businesses leaving the market this year, there were also plenty of new listings. Australia's IPO market has been back in full swing - rebounding from last year's COVID slump and overtaking the 2017 record to raise about $3 billion in the first six months alone. And so it should; macroeconomic conditions are favourable, equity valuations are healthy, and investors are opening their wallets in search of the next success story. Small-cap IPOs have been landing on fund managers' desks quicker than they can be chucked in the bin. Many of these small, and largely unproven, businesses have been dressed up for sale and offered at hefty prices. There have been plenty of well-timed exits from private equity sellers. We haven't found a lot to participate in so far, but we are sifting through the rubble. The post-IPO blues can send good businesses far below their listing prices as the market's attention wanes and the reality of listed life sets in. For example, the Forager Australian Shares Fund invested in online beauty retailer Adore Beauty (ABY) after its well-timed October 2020 IPO, but at a discount of about one-third to its IPO price. The Fund also invested in fintech lender Plenti (PLT), purchased a quarter below its IPO price. These are unlikely to be the last blown-up IPOs offering opportunities to patient investors. Written By Alex Shevelev Funds operated by this manager: Forager Australian Shares Fund (ASX: FOR), Forager International Shares Fund |

10 Dec 2021 - Hedge Clippings | 10 December 2021
|
||||||
|
If you'd like to receive Hedge Clippings direct to your inbox each Friday
|
10 Dec 2021 - Performance Report: Bennelong Australian Equities Fund
| Report Date | |
| Manager | |
| Fund Name | |
| Strategy | |
| Latest Return Date | |
| Latest Return | |
| Latest 6 Months | |
| Latest 12 Months | |
| Latest 24 Months (pa) | |
| Annualised Since Inception | |
| Inception Date | |
| FUM (millions) | |
| Fund Overview | |
| Manager Comments | The Bennelong Australian Equities Fund has a track record of 12 years and 11 months and has consistently outperformed the ASX 200 Total Return Index since inception in February 2009, providing investors with a return of 15.7%, compared with the index's return of 10.38% over the same time period. On a calendar basis the fund has had 1 negative annual return in the 12 years and 11 months since its inception. Its largest drawdown was -24.32% lasting 6 months, occurring between February 2020 and August 2020 when the index fell by a maximum of -26.75%. The Manager has delivered higher returns but with higher volatility than the index, resulting in a Sharpe ratio which has fallen below 1 once and currently sits at 0.93 since inception. The fund has provided positive monthly returns 93% of the time in rising markets, and 18% of the time when the market was negative, contributing to an up capture ratio since inception of 152% and a down capture ratio of 95%. |
| More Information |

10 Dec 2021 - What the NFT is the metaverse?
|
What the NFT is the metaverse? Magellan Asset Management December 2021 Non-fungible tokens, or NFTs, are ownership proof on blockchain technology of the original version of something digital, be that art, characters, tweets, videos or something else. People are paying millions for an exclusive claim on unique digital items (even if they can be copied at no cost).[1] Dune Analytics in August tallied sales of more than US$3 billion worth of non-fungible tokens on the largest platform, OpenSea,[2] as people sought claims on collectables such as Pudgy Penguins and the Bored Ape Yacht Club characters.[3] In September, a cryptocurrency chit tied to a set of 107 of these 10,000 cartoon apes sold at an online Sotheby's auction for US$24.4 million, while one Bored Ape token went for 740 ether (about US$2.4 million).[4] The fever over non-fungible tokens puzzles many. One explanation is that people in time will own more digital than physical items because they will spend more time online than offline. When people's digital presence is more important for impressing others than how they come across in real life, the coolest people will be those who own the best internet art displays, snappiest memes and prized virtual memberships.[5] Non-fungible tokens, so it goes, are an evolution of blockchain technology where digital money was the starting point. The second phase, taking shape now, is decentralised finance that heralds a reordered financial system. "NFTs are a glimpse into the third stage: a next generation of mainstream consumer apps built on crypto rails - the social networks, games, and more of the future," according to Coinbase co-founder Fred Ehrsam. "This is the true beginning of the metaverse."[6] The what? The term was first used in Neal Stephenson's satirical dystopian science-fiction novel of 1992, Snow Crash.[7] The word's use beyond the book harks to hypothetical virtual-reality communal spaces on the yet-to-be-built internet where the virtual and non-virtual worlds meet in a three-dimensional way. Mark Zuckerberg, CEO of Meta Platforms (formerly Facebook) describes the metaverse as the "embodied internet" where people will feel fully "present with other people" when sharing virtual experiences. "Instead of just viewing content, you are in it," Zuckerberg says.[8] Jensen Huang, the CEO of US chipmaker Nvidia, describes the metaverse as "a virtual world that is a digital twin" of the physical world.[9] Hints of the metaverse's coming - even arrival, some say - can be seen on the narrow, shared spaces on today's internet. Perhaps the best glimpse of the future is the Fortnite multi-player battle-based video game that works across all entertainment platforms. Aside from the shooting, Fortnite operates as a social square for its users. Gamers use v-bucks to decorate their avatars that 'emote' or dance. Friends meet virtually via their avatars to attend digital concerts that have featured stars such as Ariana Grande. Users can relive historical events such as Martin Luther King's 'I have a dream' speech by being 'teleported' to a reimagined Washington in 1963.[10] For an idea of how the metaverse might operate, seven likely attributes listed by venture capitalist Matthew Ball are a common place to start.[11] The metaverse will never pause or end, and will be live, Ball predicts. It will host an unlimited number of users, be a self-contained economy and span the digital and physical worlds. The metaverse will depend on unprecedented interoperability so people's avatars can shift across simulations. The metaverse will be crammed with experiences. As with the internet, no one would likely control this decentralised, interactive, virtual-reality world that will come with a dollop of augmented reality (a technology that via computers on glasses places a virtual image over a genuine scene). But some companies will build the metaverse's infrastructure and the key spaces within it. To eventuate, the metaverse will require standards and protocols to enable people's single digital identities (or avatars) to experience the teleporting, holograms, simulations, file sharing, pop-up graphics and whatever across platforms, taking with them their virtual possessions and digital currencies. People will then need affordable head-mounted displays embedded with virtual (and augmented) reality technology to log onto the metaverse, even if it is accessible through gaming consoles, mobiles and PCs. On top of that, companies will create the content and experiences. Just like the internet, the more time people spend in the metaverse, the more money to be made from ads, shopping carts and subscriptions. Zuckerberg stirred interest in the metaverse in July when he said the then-Facebook would invest billions of dollars each year to transform itself into a metaverse company. Signs of this intent include the launch in August of Horizon Workrooms, which allows people wearing headsets to meet remotely. In September, the company came out with Ray-Ban Stories 'smart glasses' that feature cameras, a microphone, speaker and voice assistant. October's move was the name change to Meta. Microsoft CEO Satya Nadella talks of the "enterprise metaverse" and how Accenture and Mars already use its software or "metaverse stack to digitise the supply chain and optimise production through complex digital simulation".[12] Epic Games in April raised US$1 billion to invest in the metaverse.[13] Walt Disney CEO Bob Chapek in November said the entertainment company intends to "connect the physical and digital worlds" ... "in our own Disney metaverse".[14] While no consensus exists on how the metaverse might develop, nor how it might operate, coders are planning for a virtual world where people might spend up to eight hours a day moving through spaces for work and leisure. That would be a big jump. Nowadays, the average US adult spends two hours eight minutes a day on social media, while the average Australian notches one hour 48 minutes.[15] It might take decades of incremental advances until the metaverse is discernible. It's likely to be a messy process as platforms and systems become interoperable. If the metaverse were to suddenly materialise today, it would no doubt be haunted by the same ethical and social questions that dog the internet and, in particular, social media. Wealthy private companies would appear best placed to exert control over the new public square. Anti-competition concerns would intensify if Big Tech were to get bigger. A magnified ability to gather data might amplify privacy concerns. Content would be contentious and might silo people by nurturing their biases, much the same way algorithms do with content on social media. Technology-wise, it's reasonable to assume the metaverse will happen. Big advances in the comfort and capabilities of the wearable technology around augmented and virtual reality will be among the signs the metaverse is forming. Perhaps by the time the metaverse eventuates, society will have largely resolved the controversies surrounding cyberspace. The biggest doubt about the metaverse's success thus might be whether or not billions of people will willingly don head- and eyewear devices to spend so much time in an immersive online world. The failure of virtual reality to break through to mainstream, despite improvements in the technology, suggests people might prefer reality. It's anyone's guess. To be sure, the metaverse needs huge computational advancements to happen. If holograms were to eventuate to add to the wow of the metaverse they would require technology not yet here that simultaneously captured, transported and recreated an image of someone to somewhere else. The metaverse might be so many decades off as to be irrelevant now. The shift to protect the privacy of data might hamper its usefulness. Some cynics think the metaverse is spin about the 'next big thing' to overcome the handicap that smart phones are already passé. Others dismiss the metaverse as rebranded virtual reality. The tech, entertainment and gaming industries are betting not. Be prepared to hear a lot about how the metaverse is coming and how it will change much. Perhaps the price of non-fungible tokens might prove a guide as to how the arrival of the metaverse is tracking. Staying niche The then-Facebook in 2014 paid US$2.3 billion for Oculus, a company that had been set up two years earlier to produce virtual-reality sets. The plan was to turn the company into a leader in virtual reality, a technology that gained attention in the 1980s due to the efforts of Jaron Lanier, who is considered the 'father of virtual reality'.[16] In 2017, Zuckerberg attended the Oculus Connect conference and announced the company's ambitions for its virtual-reality business. "We want to get a billion people in virtual reality," he said.[17] Nowadays, the Facebook site attracts more than 2.8 billion users each month. The company's Instagram has one billion users. WhatsApp boasts 1.5 billion, the same number of users Messenger attracts. But the company won't divulge the number of Oculus sets sold. Industry media estimates only 10 million units have been purchased.[18] Oculus headsets, often comprising a headpiece and two arm attachments, are marketed under the "Live the unbelievable" slogan and are among the industry's leading products in virtual reality. The price range, starting at A$479 for the successful Oculus Quest 2 model (an estimated five million sold), is reasonable compared with the cost of the latest Apple iPhone. The apparatus allows people to take part in "games, entertainment, live events, fitness and more". Users can adopt identities, visit faraway places and chase friends virtually. Yet sales are slow as the technology offers limited experiences until the next upgrade.[19] Other companies have struggled to turn virtual and augmented reality into anything that excites people enough to take the technology mainstream. Sony took four years to sell five million PlayStation VR, after launching in 2016 what has turned out to be the most successful virtual-reality competitor to Oculus.[20] One drawback of virtual reality is that weighty and awkward headsets only offer solitary experiences and wearing them can make people feel tired and nauseated from motion sickness. Few opportunities arise where people can interact with others likewise gadgeted up; hence the excitement of the possibilities of the metaverse. A second drawback is that virtual reality is an enclosed experience, whereas the internet and social media have wider practical, everyday applications that even make them essential services. A third weakness is that not all the senses are engaged, which means virtual reality never feels authentic. Nor does virtual reality require human qualities such as finding the courage to experience daredevil stunts. A fourth disadvantage of virtual reality is accentuated by the metaverse. People seem reluctant to wear headsets to spend time in a make-believe world. There is no sign that the metaverse is being driven by demand from millions, even billions, of expectant users who can't wait to wear what no doubt would be lighter and better headsets so they can play, socialise and earn a living in a parallel virtual universe. Could it be that people will stick with reality? The tech, entertainment and gaming industries are likely to make a multi-billion-dollar bet the metaverse will be so special the answer will be no. Perhaps the soaring prices of non-fungible tokens say likewise. Written By Michael Collins, Investment Specialist |
|
Funds operated by this manager: Magellan Global Fund (Hedged), Magellan Global Fund (Open Class Units) ASX:MGOC, Magellan High Conviction Fund, Magellan Infrastructure Fund, Magellan Infrastructure Fund (Unhedged), MFG Core Infrastructure Fund [1] Bloomberg. QuickTake. 'What's an NFT? It's what makes GIFS worth big bucks.' 11 March 2021. bloomberg.com/news/articles/2021-03-10/what-s-an-nft-it-s-what-makes-gifs-worth-big-bucks-quicktake [2] Bloomberg News. 'Day-trading arm goes all-in on NFTs as meme-stock mania ebbs.' 3 September 2021. bloomberg.com/news/articles/2021-09-02/day-trading-army-goes-all-in-on-nfts-as-meme-stock-mania-ebbs [3] See 'Welcome to the Bored Ape Yacht Club.' boredapeyachtclub.com/#/' [4] Reuters. 'Set of 'Bored Apes' NFTS sells for $24.4 mln in Sotheby's online auction.' 10 September 2021. reuters.com/lifestyle/set-bored-ape-nfts-sell-244-mln-sothebys-online-auction-2021-09-09/. Three months earlier, Sotheby's sold a 'CryptoPunk' token, a 10,000-pixel art character of a masked male head made by Larva Labs in 2017, for US$11.8 million. See Reuters. ''Crypto Punk' NFT sells for $11.8 million at Sotheby's.' 11 June 2021. reuters.com/technology/cryptopunk-nft-sells-118-million-sothebys-2021-06-10/. Most NFT trading is based on the Ethereum blockchain. [5] See 'Zed'. community.zed.run/ [6] See Vanity Fair. 'Imagine if the Mona Lisa was digital and then auctioned on the internet: The only NFT explainer you really need, from a true believer.' Interview with Coinbase cofounder Fred Ehrsam. 16 September 2021. vanityfair.com/news/2021/09/the-only-nft-explainer-you-really-need-from-a-true-believer [7] The novel in 2005 made a TIME list of best 100 novels '. All-TIME 100 novels.' List published in 2005. entertainment.time.com/2005/10/16/all-time-100-novels/slide/snow-crash-1992-by-neal-stephenson/ [8] 'Mark in the metaverse. Facebook's CEO on why the social network is becoming a 'metaverse company.' The Verge. 22 July 2021. theverge.com/22588022/mark-zuckerberg-facebook-ceo-metaverse-interview [9] TIME. 'The metaverse is coming. Nvidia CEO Jensen Huang on the fusion of virtual and physical worlds.' 18 April 2021. time.com/5955412/artificial-intelligence-nvidia-jensen-huang/ [10] NPR. 'Fortnite is letting you relive MLK's 'I have a dream' speech.' 27 August 2021. npr.org/2021/08/27/1031674883/fortnite-mlk-i-have-a-dream-speech-martin-luther-king [11] Matthew Ball. 'The metaverse: What it is, where to find it, who will build it and Fortnite.' 18 January 2020. matthewball.vc/all/themetaverse [12] Satya Nadella, CEO Microsoft. Speech at Microsoft Inspire 2021 gathering. 14 to 15 July 2021. news.microsoft.com/wp-content/uploads/prod/2021/07/Microsoft-Inspire-2021-Satya-Nadella.pdf [13] Epic Games. 'Announcing a $1 billion funding round to support Epic's long-term vision for the metaverse.' 13 April 2021. epicgames.com/site/en-US/news/announcing-a-1-billion-funding-round-to-support-epics-long-term-vision-for-the-metaverse. Epic Games says it is preparing for a metaverse where instead of interactions (and ads) based around 'likes', comments and posts in 'walled gardens' (or just one platform), users will take part in and share experiences across various platforms. In that sense, the Epic Games failed lawsuit against the Apple 'walled garden' is a setback to Epic's version of the metaverse. The Washington Post. 'Epic Games believes the internet is broken. This is their blueprint to fix it.' 28 September 2021. washingtonpost.com/video-games/2021/09/28/epic-fortnite-metaverse-facebook/ [14] Reuters. 'Disney wants to become the happiest place in the metaverse.' 11 November 2021. reuters.com/technology/disney-wants-become-happiest-place-metaverse-2021-11-11/ [15] Statista. 'Average time per day spent by online users on social media in 4th quarter 2020 by territory.' Source for Statista. GlobalWebIndex; Q4 2020; 714,817 respondents; 16-64 years; internet users; Online surveystatista.com/statistics/270229/usage-duration-of-social-networks-by-country/ [16] New Scientist. 'Virtual reality: Meeting founding father Jaron Lanier.' 19 June 2013. newscientist.com/article/mg21829226-000-virtual-reality-meet-founding-father-jaron-lanier/. See also, 'Review: Dawn of the New Everything. A Journey through Virtual Reality by Jaron Lanier.' The Times. 18 November 2017. thetimes.co.uk/article/review-dawn-of-the-new-everything-a-journey-through-virtual-reality-by-jaron-lanier-9vt8tfmbm [17] The Verge. 'Mark Zuckerberg: We want to get a billion people in virtual reality.' 11 October 2017. theverge.com/2017/10/11/16459636/mark-zuckerberg-oculus-rift-connect [18] See oculus.com/ [19] See 'One man's endless hunt for a dopamine rush in virtual reality.' 29 September 2021. nytimes.com/2021/09/29/technology/virtual-reality-fascination.html [20] Forbes. 'PlayStation VR sells five million units since 2016.' 7 January 2020. forbes.com/sites/joeparlock/2020/01/07/playstation-vr-sells-five-million-units-since-2016/ Important Information: This material has been delivered to you by Magellan Asset Management Limited ABN 31 120 593 946 AFS Licence No. 304 301 ('Magellan') and has been prepared for general information purposes only and must not be construed as investment advice or as an investment recommendation. This material does not take into account your investment objectives, financial situation or particular needs. This material does not constitute an offer or inducement to engage in an investment activity nor does it form part of any offer documentation, offer or invitation to purchase, sell or subscribe for interests in any type of investment product or service. You should read and consider any relevant offer documentation applicable to any investment product or service and consider obtaining professional investment advice tailored to your specific circumstances before making any investment decision. A copy of the relevant PDS relating to a Magellan financial product or service may be obtained by calling +61 2 9235 4888 or by visiting www.magellangroup.com.au. Important Information: This material has been delivered to you by Magellan Asset Management Limited ABN 31 120 593 946 AFS Licence No. 304 301 ('Magellan') and has been prepared for general information purposes only and must not be construed as investment advice or as an investment recommendation. This material does not take into account your investment objectives, financial situation or particular needs. This material does not constitute an offer or inducement to engage in an investment activity nor does it form part of any offer documentation, offer or invitation to purchase, sell or subscribe for interests in any type of investment product or service. You should read and consider any relevant offer documentation applicable to any investment product or service and consider obtaining professional investment advice tailored to your specific circumstances before making any investment decision. A copy of the relevant PDS relating to a Magellan financial product or service may be obtained by calling +61 2 9235 4888 or by visiting www.magellangroup.com.au. Past performance is not necessarily indicative of future results and no person guarantees the future performance of any strategy, the amount or timing of any return from it, that asset allocations will be met, that it will be able to be implemented and its investment strategy or that its investment objectives will be achieved. This material may contain 'forward-looking statements'. Actual events or results or the actual performance of a Magellan financial product or service may differ materially from those reflected or contemplated in such forward-looking statements. This material may include data, research and other information from third party sources. Magellan makes no guarantee that such information is accurate, complete or timely and does not provide any warranties regarding results obtained from its use. This information is subject to change at any time and no person has any responsibility to update any of the information provided in this material. Statements contained in this material that are not historical facts are based on current expectations, estimates, projections, opinions and beliefs of Magellan. Such statements involve known and unknown risks, uncertainties and other factors, and undue reliance should not be placed thereon. Any trademarks, logos, and service marks contained herein may be the registered and unregistered trademarks of their respective owners. This material and the information contained within it may not be reproduced, or disclosed, in whole or in part, without the prior written consent of Magellan. |

9 Dec 2021 - Performance Report: Bennelong Kardinia Absolute Return Fund
| Report Date | |
| Manager | |
| Fund Name | |
| Strategy | |
| Latest Return Date | |
| Latest Return | |
| Latest 6 Months | |
| Latest 12 Months | |
| Latest 24 Months (pa) | |
| Annualised Since Inception | |
| Inception Date | |
| FUM (millions) | |
| Fund Overview | There is a slight bias to large cap stocks on the long side of the portfolio, although in a rising market the portfolio will tend to hold smaller caps, including resource stocks, more frequently. On the short side, the portfolio is particularly concentrated, with stock selection limited by both liquidity and the difficulty of borrowing stock in smaller cap companies. Short positions are only taken when there is a high conviction view on the specific stock. The Fund uses derivatives in a limited way, mainly selling short dated covered call options to generate additional income. These typically have less than 30 days to expiry, and are usually 5% to 10% out of the money. ASX SPI futures and index put options can be used to hedge the portfolio's overall net position. The Fund's discretionary investment strategy commences with a macro view of the economy and direction to establish the portfolio's desired market exposure. Following this detailed sector and company research is gathered from knowledge of the individual stocks in the Fund's universe, with widespread use of broker research. Company visits, presentations and discussions with management at CEO and CFO level are used wherever possible to assess management quality across a range of criteria. |
| Manager Comments | The Bennelong Kardinia Absolute Return Fund has a track record of 15 years and 9 months and has outperformed the ASX 200 Total Return Index since inception in May 2006, providing investors with a return of 8.5%, compared with the index's return of 6.53% over the same time period. On a calendar basis the fund has had 2 negative annual returns in the 15 years and 9 months since its inception. Its largest drawdown was -11.71% lasting 2 years and 6 months, occurring between June 2018 and December 2020 when the index fell by a maximum of -26.75%. The Manager has delivered these returns with -6.53% less volatility than the index, contributing to a Sharpe ratio which has fallen below 1 over five times and currently sits at 0.74 since inception. The fund has provided positive monthly returns 87% of the time in rising markets, and 34% of the time when the market was negative, contributing to an up capture ratio since inception of 17% and a down capture ratio of 49%. |
| More Information |

9 Dec 2021 - Web 3.0 Adoption - the incentives are coming!
|
Web 3.0 Adoption - the incentives are coming! Holon Global Investments 30 November 2021 The radical world of play-to-earn. How can a game that doesn't exist be worth $US10 billion? In recent months I have been down yet another crypto rabbit hole, trying to understand the 'play-to-earn' space which, on the surface, can seem bizarre but is actually a revolution in capital formation and Web 3.0 adoption. Crypto-native businesses are starting to use their coin, not just as a means to raise capital, but as an incentive mechanism to create community, build engagement, and provide feedback to products in development. They effectively distribute 'rewards' to early adopters of the products. This has been most successful in the gaming space where users earn rewards for playing a game. 'Play-to-earn' highlights how Web 3.0 companies are utilising behavioral and financial economics to spur on Web 3.0 adoption of products and, in turn, create 'traction' and 'network effects'. What many traditional investors are missing is that these 'rewards' resemble something close to equity, and significant value is being captured by early adopters. A 'Pokemon remake' One example that has caught my eye recently is Illuvium. Their website describes Illuvium as:
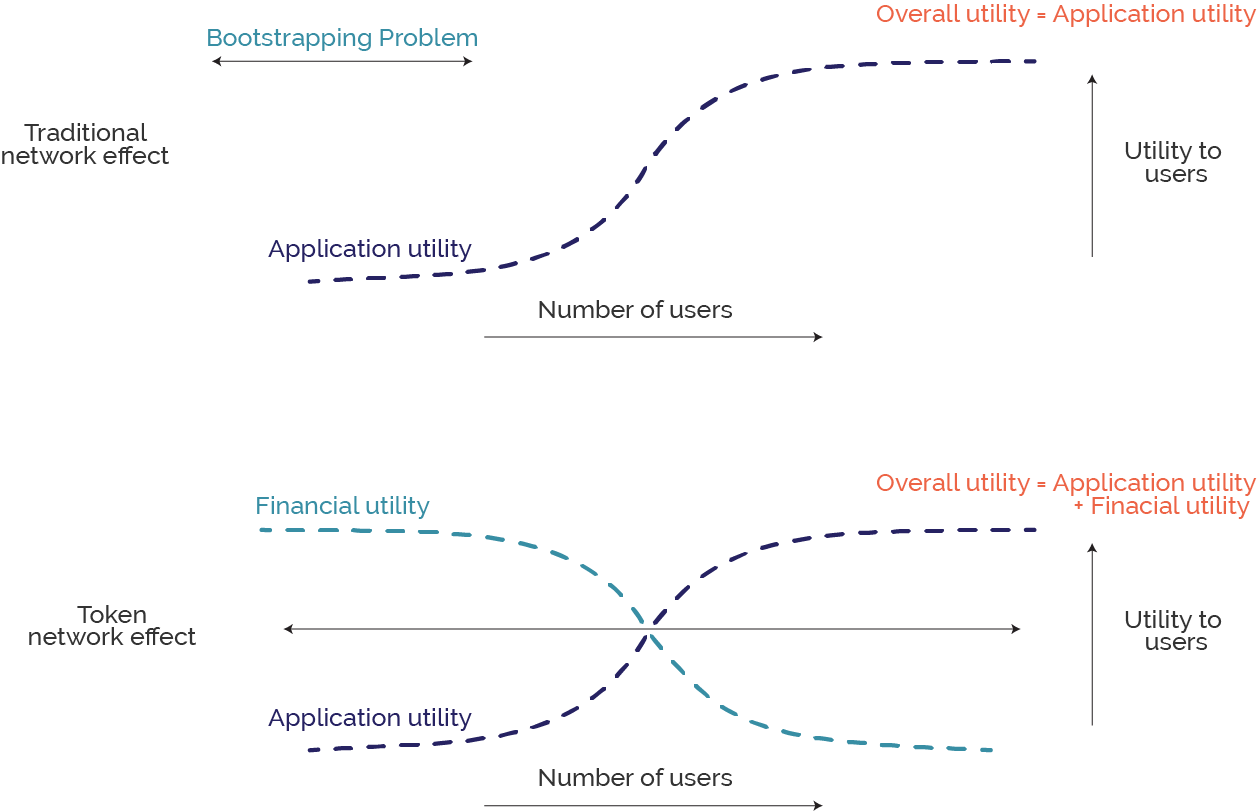
Illuvium's aim is to be the first 'Triple A' rated game on Ethereum. The founders also want the game to run autonomously with holders of ILV (Illuvium's token) governing the project via voting and a council. Ambitious, yes, impossible, no. Typically, in early-stage investments, liquidity is non-existent. Illuvium, however, (amongst many other crypto projects) are incentivizing users to provide liquidity on decentralized exchanges. Users are paid in more ILV for taking on the risk of providing this liquidity. Thus, solving the illiquidity problem up front. The next step for Illuvium is then to incentivize the buying of their native currency ILV. But with no game available (remember this is a start-up) and little funding ($US5m pre-seed) that's a huge challenge. A US$10 billion market cap despite no game Again, the exact mechanics here are somewhat irrelevant, but Illuvium has introduced an in-game currency 'sILV' that users can earn by 'staking' the real currency ILV. 'sILV' gives users the ability to progress through the game quicker. The value to players is they can accelerate their journey in the game (potentially finding the rarest creatures worth a lot of value both in the game and on secondary markets too). This creates demand for ILV on the exchanges. But this has an interesting indirect affect. Illuvium have only released a small percentage of their tokens. That means a minor increase in demand significantly increases the price of the token that unlocks a huge amount of value on their balance sheet. To appreciate this, the current fully diluted market cap of Illuvium is over US$10 billion. Not bad for a game that doesn't exist yet. It really is a revolutionary way of capital formation and spurring on Web 3.0 adoption. The incentives that people are earning are now worth much more as ILV increases in price, and Illuvium can then start to attract real talent in the form of developers and marketers to advance the project. The users at this stage are really just testers that, in turn, de-risks the ambitious vision that they initially had. It also creates a feedback loop that attracts even more investors and users competing for the now more valuable 'play-to-earn" rewards. As a practical example, Illuvium recently released a 'Cinematic game-play trailer' which cost around $US2m. Raising $5m and telling traditional equity investors that you were going to use 40% of funds to release a trailer would be tough (impossible almost). But in Web 3.0, the company formation process is changing, which is enabling these projects to do much more with much less and set their sights on much more ambitious targets. Filecoin, a cloud storage decentralized network has a similarly ambitious vision - to change the way we store and move data across the globe. With a US$250m raise, Filecoin has 'build-to-earn' incentives that total over US$70 billion, which could turn into the trillions as the network develops. The numbers are extraordinary but so too is the capital expenditure required to build out the infrastructure for our data obsessed economy (see Figure 1). Figure 1: Filecoin Capital Expenditure Incentives Early adopters capture the value To many traditional investors this can be difficult to grasp. A game that doesn't exists worth US$10 Billion?? A Cloud network in its infancy having trillions on its balance sheet?? Chris Dixon, a well-known internet entrepreneur summarized the network effect in Figure 2 and how token incentives are solving the Bootstrapping problem. In return, much of the value is caught by early adopters of the product. Figure 2: Network Effect
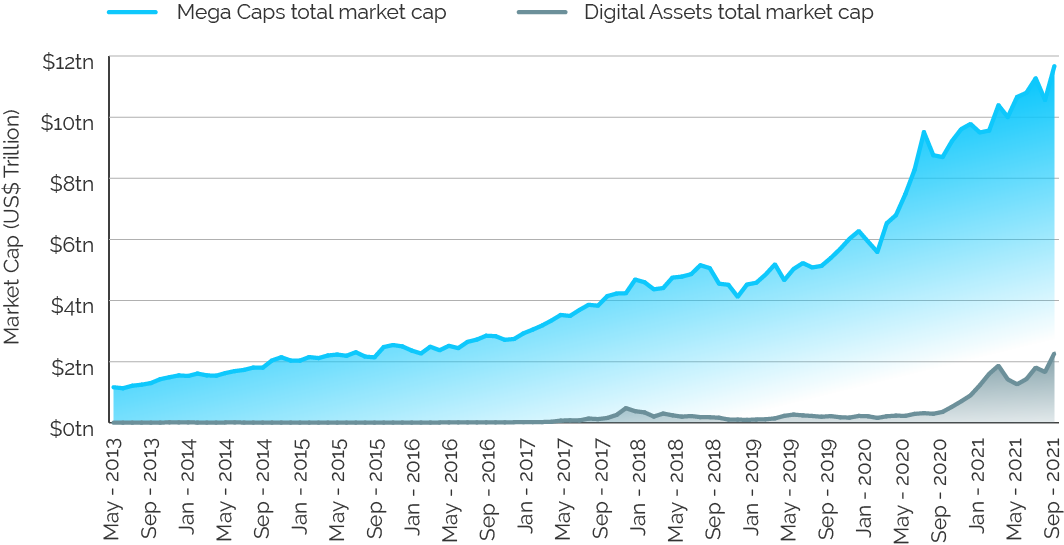
Figure 3 gives some insight to impact this is having for Web 3.0 adoption. Many of the Mega-Caps today (such as Google, Amazon, Microsoft) were formed at the start of the internet, roughly 10-15 years before these digital assets. The growth arc of digital assets is much steeper. Figure 3: Mega Caps v Digital Assets - Total Market Capitalisation
We are at the very start of a hugely transformative period. Web 3.0 is going to come at an incredibly fast speed, and as an investor you need to understand why, which means understanding the incentives involved. Many projects will fail, and that's ok. Not every business in Web 2.0 is successful either, but the ones that get the formula right will drive an immense amount of value, and that will mostly fall to their earliest adopters. My concern is that so few traditional investors will have the ability to access these opportunities because their intermediaries are not set up for this disruptive change. Funds operated by this manager: |
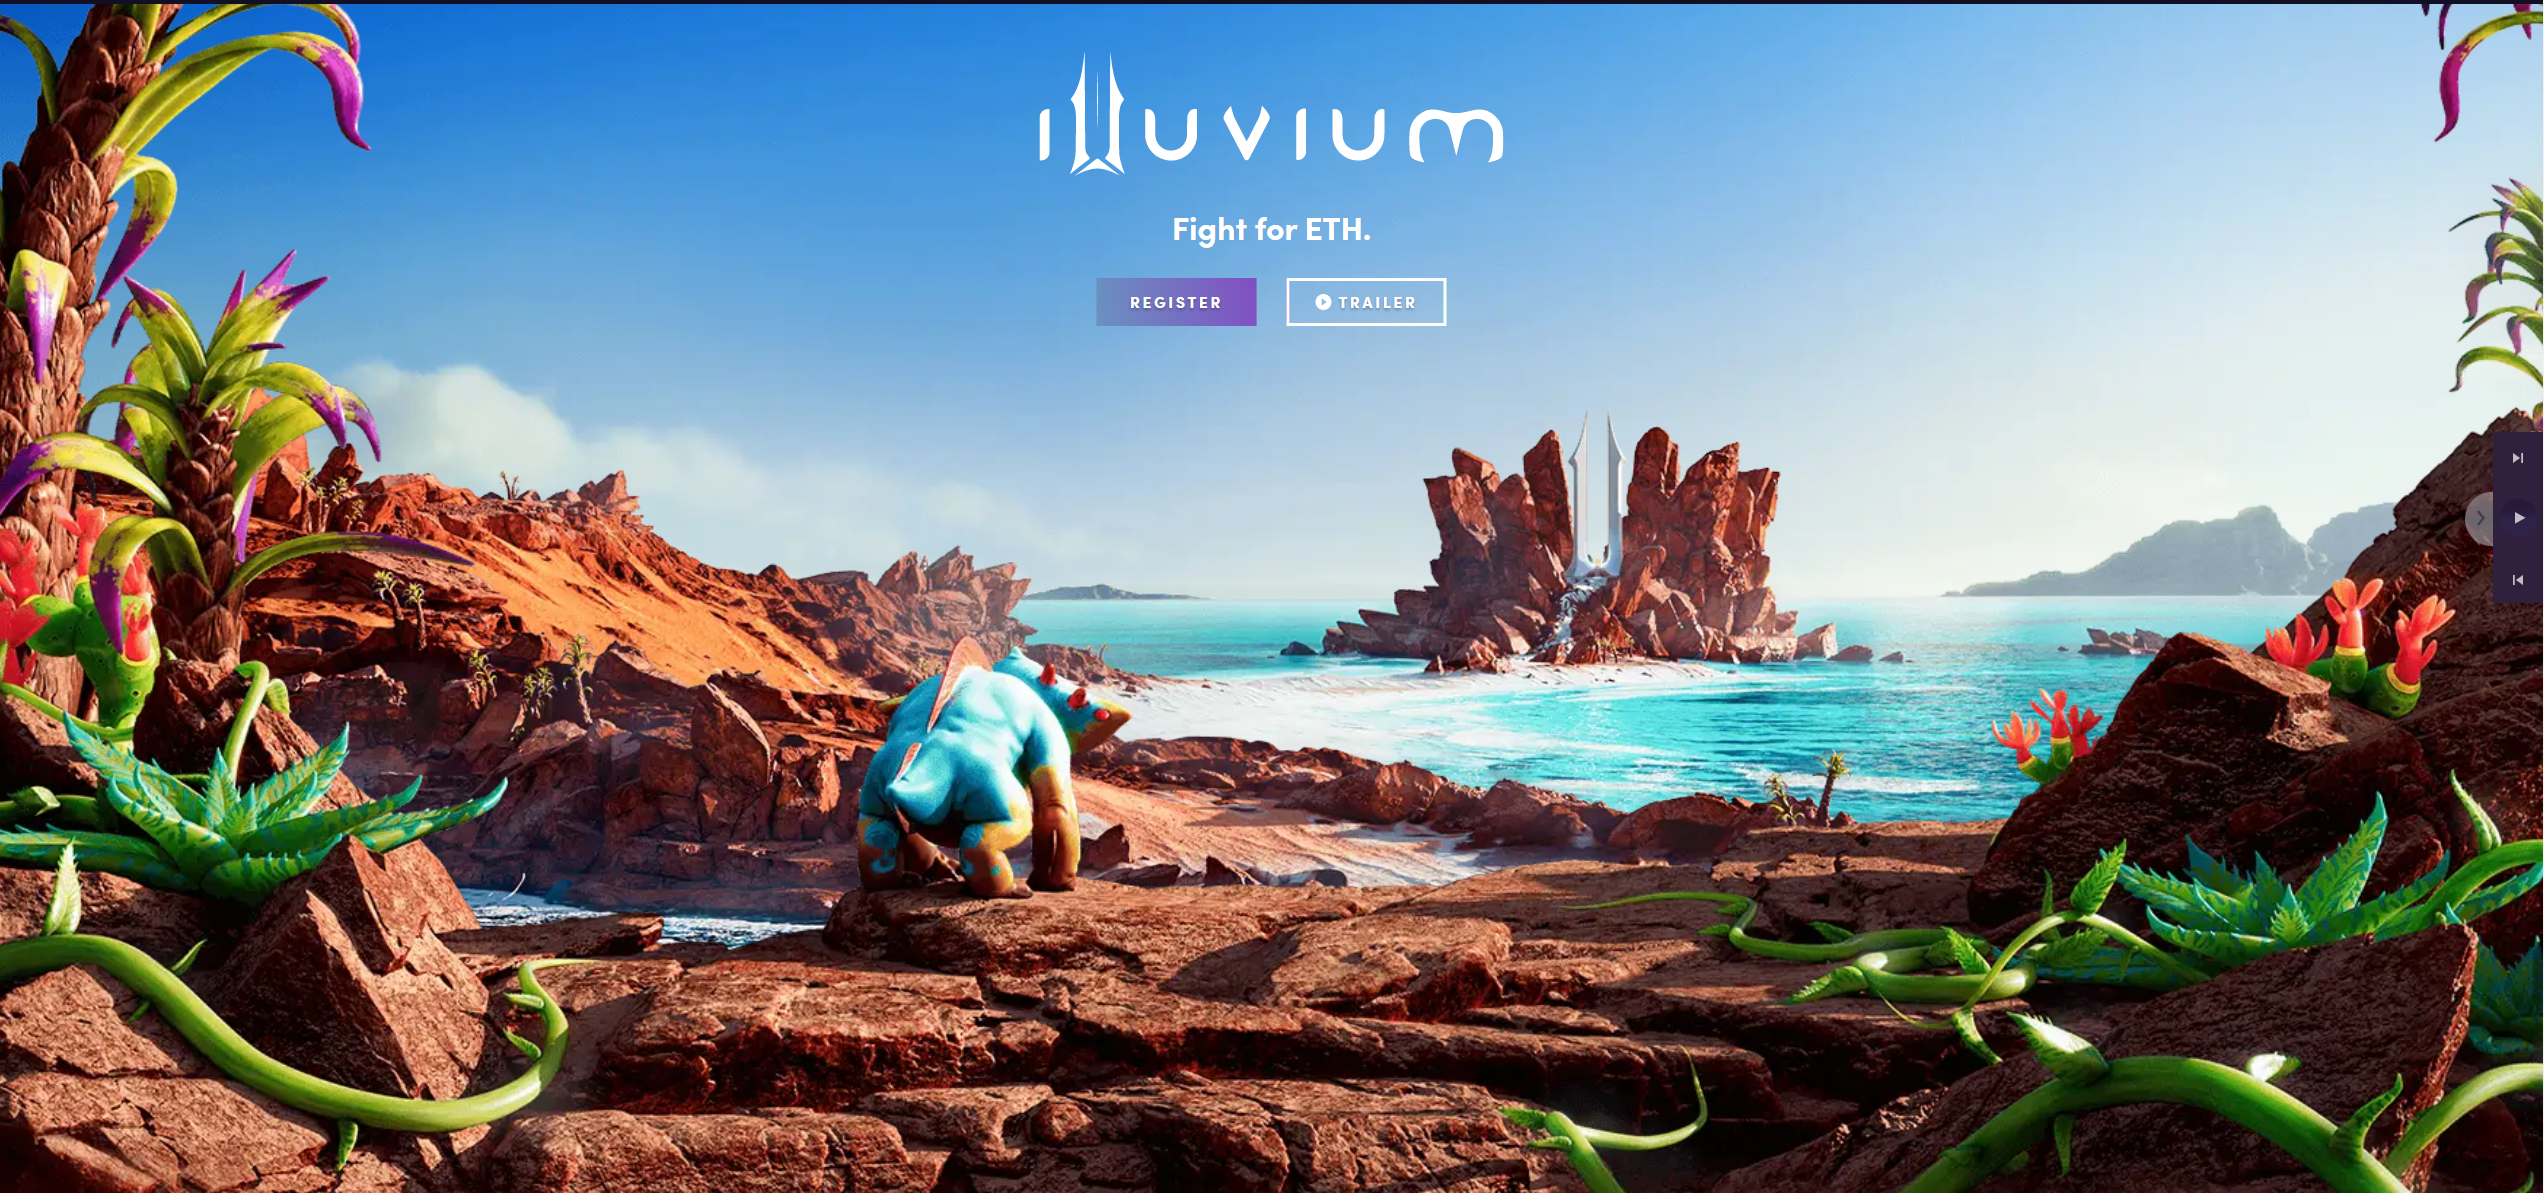 In simpler words, Illuvium is a remake of the incredibly popular 'Pokemon', only with much better graphics and NFTs that enable you to actually own parts of the game, including the creatures.
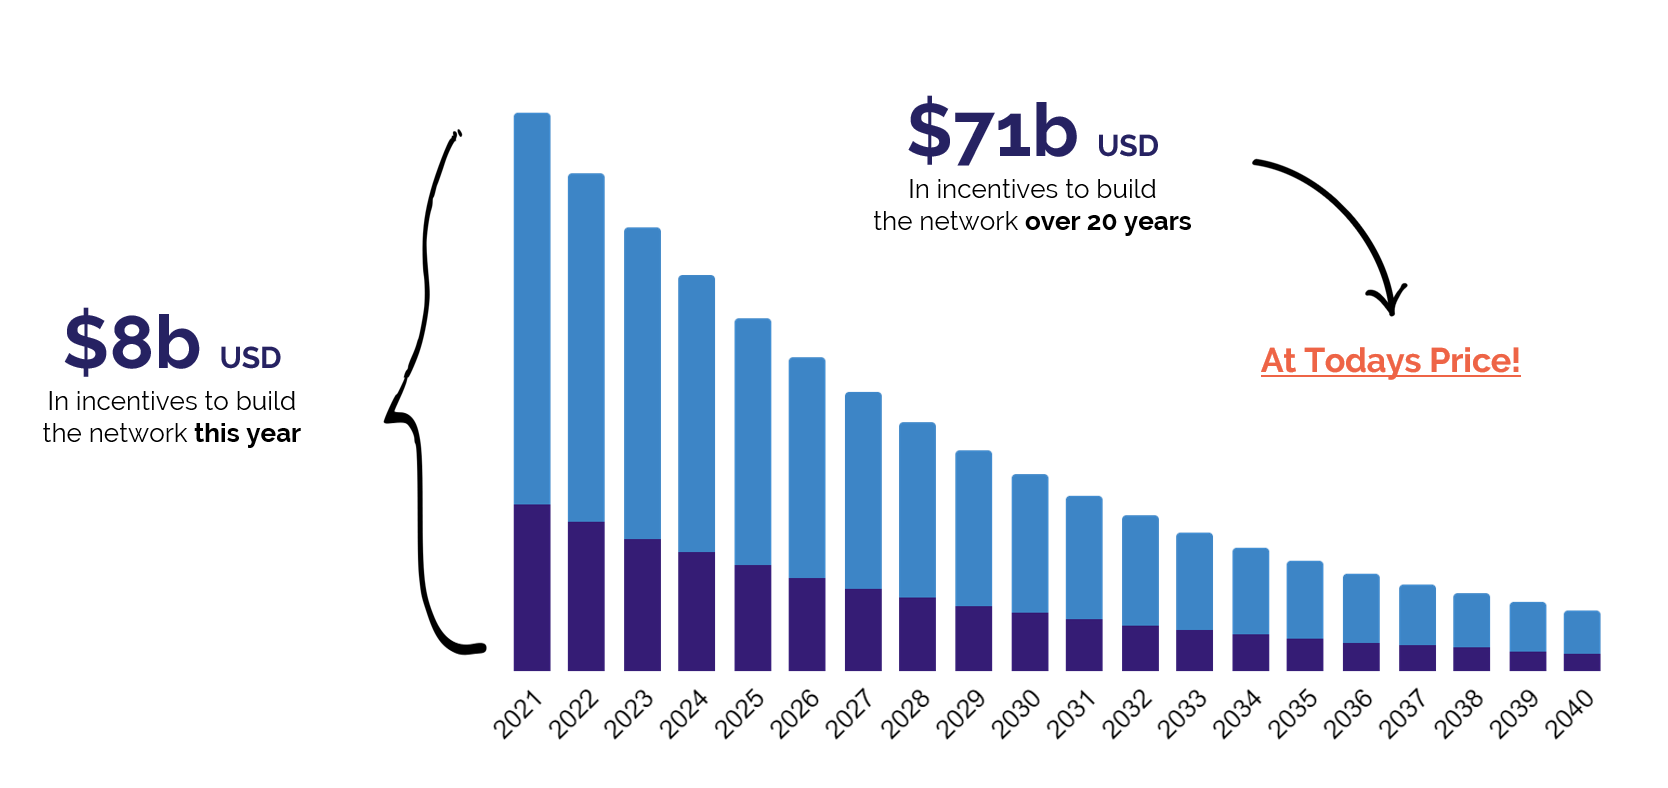

8 Dec 2021 - Performance Report: Bennelong Long Short Equity Fund
| Report Date | |
| Manager | |
| Fund Name | |
| Strategy | |
| Latest Return Date | |
| Latest Return | |
| Latest 6 Months | |
| Latest 12 Months | |
| Latest 24 Months (pa) | |
| Annualised Since Inception | |
| Inception Date | |
| FUM (millions) | |
| Fund Overview | In a typical environment the Fund will hold around 70 stocks comprising 35 pairs. Each pair contains one long and one short position each of which will have been thoroughly researched and are selected from the same market sector. Whilst in an ideal environment each stock's position will make a positive return, it is the relative performance of the pair that is important. As a result the Fund can make positive returns when each stock moves in the same direction provided the long position outperforms the short one in relative terms. However, if neither side of the trade is profitable, strict controls are required to ensure losses are limited. The Fund uses no derivatives and has no currency exposure. The Fund has no hard stop loss limits, instead relying on the small average position size per stock (1.5%) and per pair (3%) to limit exposure. Where practical pairs are always held within the same sector to limit cross sector risk, and positions can be held for months or years. The Bennelong Market Neutral Fund, with same strategy and liquidity is available for retail investors as a Listed Investment Company (LIC) on the ASX. |
| Manager Comments | The Bennelong Long Short Equity Fund has a track record of 20 years and has outperformed the ASX 200 Total Return Index since inception in February 2002, providing investors with a return of 14.2%, compared with the index's return of 8.31% over the same time period. On a calendar basis the fund has had 3 negative annual returns in the 20 years since its inception. Its largest drawdown was -23.77% lasting 14 months, occurring between September 2020 and November 2021 when the index fell by a maximum of -15.05%. The Manager has delivered these returns with -0.34% less volatility than the index, contributing to a Sharpe ratio which has fallen below 1 over five times and currently sits at 0.84 since inception. The fund has provided positive monthly returns 64% of the time in rising markets, and 63% of the time when the market was negative, contributing to an up capture ratio since inception of 6% and a down capture ratio of -144%. |
| More Information |

8 Dec 2021 - Performance Report: 4D Global Infrastructure Fund
| Report Date | |
| Manager | |
| Fund Name | |
| Strategy | |
| Latest Return Date | |
| Latest Return | |
| Latest 6 Months | |
| Latest 12 Months | |
| Latest 24 Months (pa) | |
| Annualised Since Inception | |
| Inception Date | |
| FUM (millions) | |
| Fund Overview | The fund is managed as a single portfolio including regulated utilities in gas, electricity and water, transport infrastructure such as airports, ports, road and rail, as well as communication assets such as the towers and satellite sectors. The portfolio is intended to have exposure to both developed and emerging market opportunities, with country risk assessed internally before any investment is considered. The maximum absolute position of an individual stock is 7% of the fund. |
| Manager Comments | The 4D Global Infrastructure Fund has a track record of 5 years and 9 months and has outperformed the S&P Global Infrastructure TR Index (AUD) since inception in March 2016, providing investors with a return of 9.35%, compared with the index's return of 7.74% over the same time period. On a calendar basis the fund has had 1 negative annual return in the 5 years and 9 months since its inception. Its largest drawdown was -19.77% lasting 1 year and 9 months, occurring between February 2020 and November 2021 when the index fell by a maximum of -24.67%. The Manager has delivered these returns with -0.48% less volatility than the index, contributing to a Sharpe ratio which has fallen below 1 over five times and currently sits at 0.72 since inception. The fund has provided positive monthly returns 95% of the time in rising markets, and 14% of the time when the market was negative, contributing to an up capture ratio since inception of 105% and a down capture ratio of 94%. |
| More Information |