
NEWS

4 Feb 2022 - Y2021 - The Year in Quotes
|
CY2021 - The Year in Quotes Equitable Investors 23 January 2022
It didn't start out this way intentionally but at Equitable Investors we have developed a habit of kicking off each monthly update of the Dragonfly Fund with a quote that resonated or was reflective of that point in time. We find wisdom, common sense and inspiration in many places - not just in the words of the investment greats. From Ron Barron to ron Barassi, the words we drew on for the 12 months of calendar 2021 follow.
January 2021 "Stocks that have a well-recognised brand, or a well recognised story have seen unprecedented buying relative to the rest of the market... this leaves an opportunity for investors that are willing to go the extra mile in researching stocks." ― Fabiana Fedeli, Fundamental Equities Outlook Q1 2021, Robeco February 2021 "We should be careful to get out of an experience only the wisdom that is in it and stop there lest we be like the cat that sits down on a hot stove lid. She will never sit down on a hot stove lid again and that is well but also she will never sit down on a cold one anymore" ― Mark Twain March 2021 "To make money in stocks you must have "the vision to see them, the courage to buy them and the patience to hold them. Patience is the rarest of the three." ― Thomas Phelps, 100 to 1 in the Stock Market April 2021 "The game of life is a lot like football. You have to tackle your problems, block your fears, and score your points when you get the opportunities." ― Lewis Grizzard, Don't Sit Under The Grits Tree With Anyone Else But Me May 2021 "We're guessing at our future opportunity cost... But if we knew interest rates would stay at 1%, we'd change. Our hurdles reflect our estimate of future opportunity costs." ― Charlie Munger June 2021 "There are pockets of what look like appreciable over-valuation and pockets of significant undervaluation... we can find plenty of names to fill our portfolios" ― Bill Miller, Miller Value Partners July 2021 "Those explorations required skepticism and imagination both. Imagination will often carry us to worlds that never were. But without it, we go nowhere. Skepticism enables us to distinguish fancy from fact, to test our speculations." ― Carl Sagan, Cosmos August 2021 "If the Chairman of the Federal Reserve with all the data and tools at his disposal couldn't predict what the 'market' would do, it was unlikely others could either. Which made us focus on investing in well managed, competitively advantaged, growth businesses...not the 'stock market' " ― Baron Funds founder Ron Baron September 2021 "There are two ways you can get yourself revved up - fear of failure and love of success. Personally, I like both things to be working in you, the same as you can win a game at one end of the ground and save it at the other." ― Melbourne Football Club legend Ron Barassi. October 2021 "Many people believe that investors must make the macro decision to be either bullish or bearish. Our preference is to be agnostic, objectively finding absolute bargains... we are neither bullish nor bearish. We are value-ish." ― Baupost Group founder Seth Klarman November 2021 "Far more money has been lost by investors preparing for corrections, or trying to anticipate corrections, than has been lost in corrections themselves... In trying to time the market to sidestep the bears people often miss out on the chance to run with the bulls." ― former American fund manager Peter Lynch December 2021 "Most market commentary is focused on... 'expiring knowledge'. This is the headline news that fills our screens today, which in five and 10-years' time we will look back on and realise didn't actually mean anything from a long-term investment perceptive." ― Paul Black, WCM Investment Management Funds operated by this manager: |


4 Feb 2022 - Infrastructure Strategy Update
|
Infrastructure Strategy Update Magellan Asset Management January 2022 Portfolio Manager Ofer Karliner, outlines why listed infrastructure and utilities stocks rallied in the fourth quarter, the likely recovery in airport assets, why high carbon scores can be a misleading guide to ESG risks for infrastructure stocks, and why, even if interest rates rise, the infrastructure portfolios still comes with diversification, inflation protection, capital growth and yield benefits if the universe is defined correctly. |
|
Funds operated by this manager: Magellan Global Fund (Hedged), Magellan Global Fund (Open Class Units) ASX:MGOC, Magellan High Conviction Fund, Magellan Infrastructure Fund, Magellan Infrastructure Fund (Unhedged), MFG Core Infrastructure Fund |

4 Feb 2022 - 2022 Outlook: Finding Attractive Income and Lower Duration
|
2022 Outlook: Finding Attractive Income and Lower Duration (Adviser & Wholesale Investors Only) Ares Australia Management 21 December 2021 In the current market environment, investors are faced with the challenge of finding attractive current income solutions that offer protection from rising interest rate risk, particularly as many traditional fixed income strategies (proxy: Bloomberg Barclays Global Agg) have suffered negative monthly returns in recent months. Meanwhile, the potential for bouts of volatility is increasing amid rising inflation concerns. To solve for this conundrum, we seek to unearth investment solutions offering higher yields and diversification for Australian investors within the defensive part of their portfolios, and what we view as the more senior, high quality segments of the corporate debt and alternative credit markets; we call it the "sweet spot" of credit. This encompasses a $5.7 trillion1 opportunity set across U.S. and European loans, corporate bonds, and alternative credit markets. Importantly, we believe a dynamic, flexible approach to investing in the "sweet spot" of credit offers:
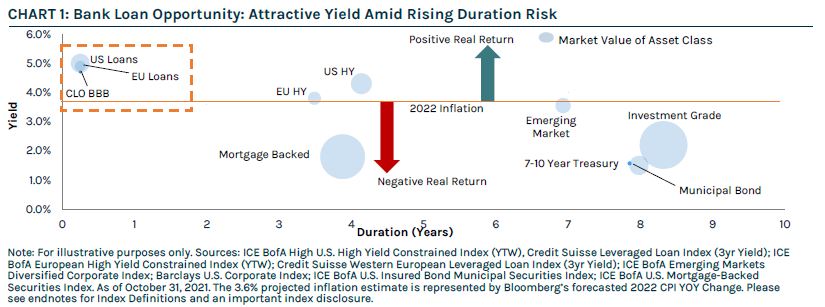
To illustrate the challengses that traditional fixed income investors are facing today, as well as the relative value opportunities available in the corporate debt and alternative credit markets, Chart 1 plots the current yield against interest rate duration for various fixed income asset classes. The size of the bubbles represents the market value of each asset class.
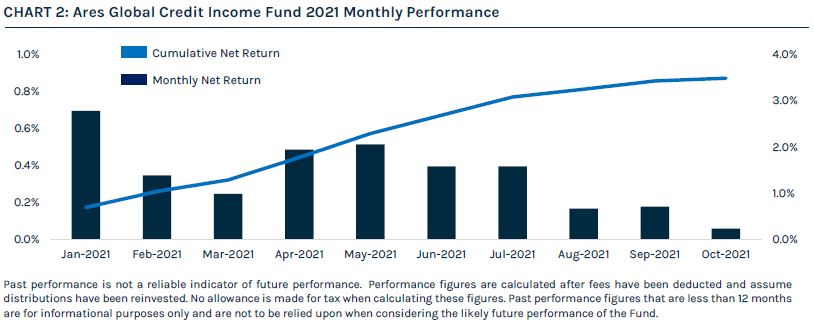
With the outlook of a low default and higher rate environment ahead, we believe certain higher beta, floating rate instruments, specifically bank loans and CLO debt securities, screen attractive from a relative value perspective as they provide high levels of current income and low duration of less than one year. In a rising rate environment, the coupon of floating rate assets adjusts to shifts in short-term interest rates, and as a result, these assets exhibit lower price volatility relative to fixed rated securities. Looking forward, while we anticipate increased price volatility and dispersion in the credit markets as interest rates and inflation remain at the forefront of policy decision making, we view bank loans and CLO debt securities as attractive allocations within fixed income as we expect retail and institutional demand to remain robust. Additionally, we believe valuations will be supported by strong fundamentals and improving credit metrics, low default expectations and robust capital markets. Across our multi-asset credit portfolios, including the Ares Global Credit Income Fund ("AGCIF"), we seek to find the most attractive relative value opportunities in the "sweet spot" of credit in order to deliver higher yields with optimal downside protection and lower volatility. Specific to AGCIF, performance has benefited from tactical asset allocation and credit selection, as illustrated by its annualized since inception net return of 9.2%.2 In addition to weathering varied market environments, we believe AGCIF is particularly well suited to serve a growing appetite for stable incoming-producing strategies among Australian investors as it targets a per annum distribution of 3%-4%. Further, the current ex-ante volatility of AGCIF averages approximately 0.5×2 the volatility of the broader bank loan and high yield bond universe, illustrating our keen focus on downside protection and volatility management. Active allocation has proven paramount in successfully navigating the volatile market environment during 2020 and remains critical to unlocking value, particularly as market conditions evolve heading into the end of 2021 and early 2022. Informed by quantitative analysis and fundamental research, our demonstrated ability to express relative value across the credit markets continues to drive strong and stable monthly performance year-to-date, as illustrated in Chart 2.
In summary, as investors seek attractive income solutions in today's market environment, many may struggle to determine how best to position their credit exposure in order to maximize yield and mitigate risk. By accessing the "sweet spot" of credit, comprised of corporate debt and alternative credit asset classes, we believe investors can overcome these challenges. At Ares, our differentiated approach to capitalizing on the best risk-adjusted return opportunities across the investable universe is rooted in the scale and integration of our Global Liquid and Alternative Credit strategies, which allows us to fully leverage extensive research capabilities, proprietary technologies and longstanding relationships. Written By Teiki Benveniste, Head of Ares Australia Management |
|
Funds operated by this manager: Ares Diversified Credit Fund, Ares Global Credit Income Fund |

3 Feb 2022 - Megatrend in focus: Silver Economy
|
Megatrend in focus: Silver Economy Insync Fund Managers September 2021 Broad trends are quite often easy to identify but what is much harder to do is identify specific industries and companies that are going to economically benefit from these trends and deliver compound annual returns for shareholders over the long term. Genomics or heart disease? A key insight from Insync's work on the ageing population is the projected rate of growth in the 70-75 age bracket. This is the fastest growing five-year age bracket for all people over the age of 55 for the next 15 years and beyond. The proportion of people of this age that develop heart related issues are astronomical.
The heart is a highly focused organ. It has just one job to do, and it does it supremely well. It beats. Slightly more than once every second; that's 100,000 times a day and as many as three and a half billion times in a lifetime. It rhythmically pulses to push blood through your body and recycle it. And these aren't gentle thrusts, they are jolts powerful enough to send blood spurting up to three meters if the aorta is severed.
In comparison to surgical procedures, TAVR has a higher survival rate (99%), lower rate of stroke, bleeding, and other complications. General anaesthesia is not necessary in the procedure and most patients leave after just an overnight stay. This provides a significant cost saving as hospital surgery, anaesthesia and costs of stay are significant burdens to healthcare systems.
Like many new and exciting technologies, it has taken time. Over 15 years in fact, for the market to start adopting TAVR to a level where the companies pioneering the technology become highly profitable and industry leaders.
Many healthcare and innovation investors have focused on genomics and gene editing. After all, it's emerging and exciting- the possibilities are immense. Funds operated by this manager: Insync Global Capital Aware Fund, Insync Global Quality Equity Fund |
2 Feb 2022 - How high can government debt-to-GDP ratios soar?
|
How high can government debt-to-GDP ratios soar? Magellan Asset Management January 2022 The 'IMF crisis' is judged the worst event to have hit South Korea since the civil war of 1950-53. The rest of the world knows this financial upheaval as the 'Asia crisis' of 1997. The mismatch is because South Koreans, perhaps ungratefully, focus on the damage after the International Monetary Fund bailed out a country tormented by a currency-turned-banking crisis.[1] The then-record IMF package of US$58 billion dollars was laced with conditions. One was austerity. As government support shrank, South Korea's economy shrivelled 5.1% in 1998 while the jobless rate sprang to 7.0% from 2.1% pre-crisis (1996).[2] The contraction, however, was fleeting. South Korea's economy rebounded in 1999 (expanding 11.9%) and grew every year until the covid-19 pandemic struck in 2020. The jobless rate fell to 3.3% by 2002 and has been 3.something% ever since. Yet the crisis scarred South Koreans. Even though (at 10% of GDP in 1997) public borrowing provided no fuel for the upheaval, one legacy was a consensus that Seoul must not let gross government debt exceed 40% of output.[3] No longer. The government of President Moon Jae-in in August announced a budget for 2022 that vowed to use fiscal stimulus to counter the damage of the pandemic and, more broadly, fight poverty and inequality. Government spending is forecast to expand 8.3% in 2022. Public debt is expected to climb to 50.2% of GDP by next year and reach 59% by 2025, from 36% of output when Moon took office in 2017.[4] And why not let government borrowing rip? Does anyone care that government debt-to-GDP ratios (however imperfectly measured) are higher than seemed possible because interest rates are so low? US government debt is now at 103% of GDP.[5] Eurozone public debt is at a near-record 98.3% of output (where the record is 100.0%). France (114%), Greece (207%) Spain (123%), Italy (156%) and Portugal (135%) make a mockery of the suspended legal limit of 60%; even zero-deficit-by-law-pandemic-excepted Germany (70%) exceeds the legal ceiling.[6] While Australia's federal debt is only headed to 50% of GDP by 2025,[7] Japan's public debt stands at an astonishing 257% of GDP. Public debt in emerging markets extends to a record 64% of output. Brazil (91%), China (69%) and India (91%) exceed the average as do Latin American countries overall (73%). The IMF estimates 'general' government debt now reaches a record 99% of global output, from 83% in 2016.[8] An overarching question, especially when governments are relying on fiscal policy to fight this pandemic and linked economic crisis, is: At what level might public debt become disruptive? A debt crisis would erupt if investors assessed any country were unable to meet its debt repayments. They would baulk at buying, even holding, its bonds. Bond yields would soar, adding to the debt burden, while the country's currency would plunge, which is damaging if debts are denominated in foreign currencies. History is replete with examples of when excessive debt triggered a crisis, from an inflationary economic collapse to endless stagnation ('Japanification'). The role excessive debt played in the fall of the Ottoman and British empires shows it comes with global political implications. So, too, does China's 'debt-trap diplomacy' (that echoes US meddling in Latin America) where Beijing gains sway over emerging countries by giving them loans they can't repay. Governments have three standard ways to tackle their debt burdens. (A fourth would be asset sales, a fifth, conquest and a sixth, reparations.) The first conventional cure is to raise taxes and reduce spending. The UK in September became the first major country to raise taxes to cover covid-19 debt when it lifted payroll taxes.[9] More countries will follow. The handbrake here is that austerity is often politically fraught and can undermine economies so much it might backfire - such an outcome occurs if an economic contraction worsens debt ratios. A second, and the most appealing, option is to ensure economies flourish in a way that erodes real debt burdens over time - this is how the winners reduced their bills after World War II. The formula is to ensure nominal output (GDP unadjusted for inflation) grows at a higher rate than the average interest rate on public debt - a historic norm.[10] A variation on this recipe is that debts will be manageable if inflation-adjusted interest repayments stay below 2% of GDP for the foreseeable future.[11] Over the pandemic, these formulas were met because interest rates were around record lows partly due to central-bank asset purchases.[12] A repeat of the post-World War II drawdown - Washington's debt fell from a record 106.1% of GDP in 1946 to 23% of output in 1974[13] - will be hard because back then pent-up demand, low regulation, favourable demographics and free trade drove economies, huge multi-decade-long advantages that no longer prevail. Still, within this option, governments can choose to allow some inflation and supress interest rates. The benefit of this approach is that rising nominal GDP growth offers governments tax windfalls via higher nominal business profits and by pushing individuals into higher tax brackets. Post-war governments practised 'financial repression' to prevent market forces setting the price of money. But capital controls, fixed-exchange rates, curbed bank lending and ceilings on interest rates would entail a U-turn from the liberalised bent of the past four decades. Low rates would only encourage companies and consumers to add to their record debt loads that come primed with risks too. Permitting inflation is tricky. Officials might lose control of prices if they print too much money and 'debase the coinage' because that comes with economic and political problems.[14] Interest rates would rise if inflation were to accelerate in a durable way, which hampers economies and adds to repayment burdens. Governments would be tempted to pressure central banks not to raise rates, as US presidents Lyndon Johnson and Richard Nixon did to help pay for the Vietnam war. But that would demolish central-bank independence to fight inflation, perhaps the economic policy most responsible for recent prosperity. The other option is to default (and any 'restructuring' is technically a default). When it comes to advanced countries, Japan's debt ratio shows countries with national currencies can rely on their central banks to stave off default for a long time. But, while no defaults in such advanced countries are imminent (now that a fight over the US debt ceiling has been settled for another 12 months), their governments can't boost debt forever. Pressure will mount for authorities to control debt ratios to stop ratings downgrades, perhaps even engage in accounting tricks. Central banks could do this by cancelling the government debt they have bought under quantitative-easing programs.[15] Treasury departments could print trillion-dollar coins.[16] Eurozone governments with high debt ratios are more vulnerable to default because they lack their own currencies. Yet any default could bring down the European Monetary System. More crises around Greece, Italy and perhaps eventually France and Spain that threaten mayhem are likely, especially if bond yields rise after the European Central Bank stops its asset buying. Emerging countries, which are inherently less stable economically and politically, are most likely to default. The candidates are many - the IMF in December estimated that 60% of low-income countries are at "high risk or already in debt distress" compared with 30% in 2015.[17] Emerging countries that have borrowed in foreign currency (a diminishing percentage) and ones that have borrowed from foreigners rather than locals are the most at risk. For indebted advanced and emerging countries, a world of record government debt could soon enough be a realm of hard choices and one of sporadic crises. As the debt status quo appears unsustainable, any rise in US interest rates will signal trouble ahead. To be clear, government debt proved its worth during the pandemic and there's nothing risky with it per se especially when governments borrow in local currency from locals. Sovereign bonds are a useful financial asset that institutions hold for regulatory reasons. Debt allows governments to spread the cost of capital goods across time. A desire to sell debt forces countries to be creditworthy. Debt is a Keynesian tool for managing the economy. The flaw here, however, is that few governments post budget surpluses and debt must be repaid sometime. As Japan shows, debt-to-GDP ratios can climb far higher than thought possible without any obvious damage to an economy. It's true too that few indebted governments are struggling to sell debt at low rates. But, at some point, rising debt would trigger steeper borrowing costs and puncture the complacency that public debts are manageable because interest rates are low. History shows that public debt ushers in its nemesis; higher interest rates. That reckoning one indeterminant day likely means a harsher, poorer, perhaps crisis-prone future awaits. The likely trouble spots On November 30, Federal Reserve Chair Jerome Powell said the central bank's asset-buying program might end "a few months earlier" than its scheduled finish in mid-2022 and that it was "probably a good time to retire that word" [transitory] when describing faster inflation.[18] A report two weeks later showed US consumer prices rose 6.8% in the 12 months to November, the most since 1982. On January 5, by when the Fed had halved its pandemic asset buying to US$60 billion a month, minutes from the Fed's policy-setting meeting showed the central bank was thinking of raising the US cash rate "sooner or at a faster pace" than expected.[19] In Europe on January 7, a report showed eurozone inflation reached 5% in 2021. This fresh record high for the euro area flags the end of the European Central Bank's ultra-loose monetary policy that includes ample purchases of government debt. If the ECB trims, even slashes, its bond purchases, the eurozone's indebted countries will have lost their 'lender of last resort', a term that describes the emergency role that governments can play in countries with bespoke currencies and central banks. By acting as a buyer of its own debt in the absence of other buyers, governments can ensure they won't default on their obligations - though they generally can't avoid an economic crisis as severe as if they had reneged on their repayments. When the ECB reduces, even ends, its asset buying, global bond investors are likely to reprice eurozone sovereign debts according to a country's theoretical ability to repay. 'Lo spread' as the Italians dub the premium on Italian government debt over German bunds, to cite just one example, could well rise to troubling levels. The euro's lack of a supportive fiscal, banking and political union could inevitably lead to more debt crises and bailouts aka those of the 2010s that cast doubt on the single currency's viability. Whatever is happening in the eurozone, emerging markets are likely to more threatened by what the Fed does to global interest rates and what that might mean for the value of the US dollar. A worry is that in 2019 the IMF and World Bank assessed the world's emerging countries were already "at high risk of or already in debt distress" at the end of 2019.[20] Now average gross government debt in emerging markets is up by almost 10 percentage points since 2019 (with large variations around that average).[21] Emerging countries were vulnerable to a financial crisis pre-pandemic because many turned (once again) to borrowing after the global financial crisis. The debts of the 111 low- and middle-income countries more than doubled from US$600 billion in 2008 to US$1.3 trillion by 2018. Over the 10 years, interest plus principal repayments jumped from US$47 billion to US $117 billion.[22] Some worried that the sporadic debt holidays of 2020 - a reneging on debt repayments - could undermine trust in emerging countries and boost risk premiums on their bonds. But, even if continued, they are unlikely to be enough to prevent more developing countries defaulting - Zambia in November 2020 became the first country to default post covid-19.[23] The worry is that emerging countries are inherently riskier investments. They typically have unstable political systems and poor institutions, ones that lack capable and trustworthy bureaucracies. Governments struggle to raise adequate tax revenues, which is why they turn to borrowing. Public finances are often murky. Rule of law is sporadic. The judiciary lacks independence. The media is hobbled. Many rulers have usurped power or have gamed the democratic process to cement their rule. Their subjects identify more with tribal, religious, ethnic or cultural groups than with countries created by colonial powers that lack national unity. The poor institutions, murky politics and tribal allegiances allow corruption to thrive. Economic risks include that emerging countries often rely on a few primary exports. They are thus vulnerable to a drop in the prices of the commodities that earn their foreign exchange. Many are net food importers and their local produce is vulnerable to harsh weather (climate change). While emerging governments these days borrow more in local currency, they are still reliant to a large extent on foreign investors buying their bonds. Default risks are heightened if the investments are short term, thereby requiring constant debt renewal at inauspicious times. It's true that emerging countries, which typically posted higher growth rates than advanced ones, have taken steps to boost their financial stability that averted financial catastrophes at the start of the pandemic. They have built up foreign reserves in recent times to protect their currency regimes. Their central banks are prepared to engage in unconventional steps such as quantitative easing to protect government debt. In March and April last year, for instance, central banks of 14 emerging countries including those of India, Indonesia and Mexico announced bond-buying programs.[24] But many emerging countries have been hard hit by covid-19 in terms of deaths and lost income, especially from absent tourists. Policymakers are aware emerging countries are at risk, especially that their debts tie their fate to rich world monetary policies.[25] Yet the world lacks a global rules-based system for managing such default shocks, something the policymakers at the IMF and UN have investigated without solving.[26] If a government defaults now, only the parties involved sort out an agreement under New York or English law that may involve write-offs, loan extensions, grace periods and rate reductions, even if the negotiations are supervised by the IMF, which is conflicted if it's a creditor. Such an ad-hoc system (compared with US court-overseen corporate or municipal defaults) favours developed over emerging countries and rarely resets a country's financial position onto a sustainable path. The typical result is a country doomed to sporadic crises and economic devastation. Greece's torment of the 2010s, when it underwent three bailouts, serves as a prime example of how a country becomes an investor pariah. Argentina's nine defaults since 1827 offers another.[27] But not industrialised and OECD-belonging South Korea, even if the people there still wince at the acronym, IMF. Written By Michael Collins, Investment Specialist |
|
Funds operated by this manager: Magellan Global Fund (Hedged), Magellan Global Fund (Open Class Units) ASX:MGOC, Magellan High Conviction Fund, Magellan Infrastructure Fund, Magellan Infrastructure Fund (Unhedged), MFG Core Infrastructure Fund [1] See 'The 1997-98 Korean financial crisis: causes, policy response and lessons.' Speech by Kim Kihwan, Chair of the Seoul Finance Forum, International Advisor to Goldman Sachs and Chair of the Korea National Committee for the Pacific Economic Cooperation Council, at the High-Level Seminar on Crisis Prevention in Emerging Markets organised by the IMF and the government of Singapore. 2006. imf.org/external/np/seminars/eng/2006/cpem/pdf/kihwan.pdf [2] IMF figures for Korea's economy from the World Economic Outlook Database. October 2021. The IMF's definition of gross debt consists of all liabilities that require payment or payments of interest to a creditor at some future point. [3] IMF estimates, the fairest international comparison, even if lagged, place Korean general government at just above 40% since 2015 and score it at a peak of 42% of GDP in 2019. [4] Reuters. 'South Korea drafts aggressive spending plan for 2022, taking government debt to 50% of GDP.' 31 August 2021. reuters.com/world/asia-pacific/skorea-drafts-aggressive-spending-plan-2022-taking-debt-50-gdp-2021-08-31/ [5] Congressional Budget Office. 'An update to the budget and economic outlook: 2021 to 2031.' 1 July 2021. cbo.gov/publication/57218. Within 10 years, half Washington's forecasted budget deficit is expected to go on debt repayments. See Congressional Budget Office. Presentation. 'An overview of the 2021 long-term budget outlook.' 20 May 2021. cbo.gov/publication/57189 [6] Figures as at 30 June 2021, where the eurozone debt record was set on 31 March 2021. Eurostat release. 'Government debt down to 98.3% of GDP in euro area.' 22 October 2021. ec.europa.eu/eurostat/documents/2995521/11563335/2-22102021-AP-EN.pdf/4bc91cb6-b073-d8c8-349d-18aa2bcd2b91 [7] Parliament of Australia. Budget review 2021-22. 'Commonwealth debt.' Net debt is projected to reach 41% of output by 2025. aph.gov.au/About_Parliament/Parliamentary_Departments/Parliamentary_Library/pubs/rp/BudgetReview202122/CommonwealthDebt [8] IMF 'Fiscal monitor.' October 2021. See Table 1.2 'General government debt, 2016-26.' Chapter 1. Page 9. Record for emerging markets can be confirmed from the World Economic Outlook Database. October 2021 (op cit). imf.org/en/Publications/FM/Issues/2021/10/13/fiscal-monitor-october-2021 [9] BBC. 'Boris Johnson outlines new 1.25% health and social care tax to pay for reforms.' 7 September 2021. bbc.com/news/uk-politics-58476632 [10] See Olivier Blanchard. 'Public debt and low interest rates.' Working paper 19-4. February 2019. piie.com/publications/working-papers/public-debt-and-low-interest-rates. He responds to criticism of the paper here: 'Why critics of a more relaxed attitude on public debt are wrong.' 15 July 2019. piie.com/blogs/realtime-economic-issues-watch/why-critics-more-relaxed-attitude-public-debt-are-wrong [11] See Jason Furman and Lawrence Summers. 'A reconsideration of fiscal policy in the era of low interest rates.' Discussion draft. 30 November 2020. brookings.edu/wp-content/uploads/2020/11/furman-summers-fiscal-reconsideration-discussion-draft.pdf [12] IMF. 'Fiscal monitor.' October 2021. Chapter 2. 'Strengthening the credibility of public finances.' Page 17. imf.org/en/Publications/FM/Issues/2021/10/13/fiscal-monitor-october-2021 [13] Congressional Budget Office. 'Federal debt: A primer.' See 'Data underlying figures.' 12 March 2020. [14] Higher prices impede economies through 'menu' or mark-up costs, the 'shoe leather' cost as shoppers search for lower prices, relative price distortions and tax distortions against savings income and 'bracket creep' on wages. Inflation redistributes wealth from creditors to debtors, from people of fixed incomes to those on flexible (indexed) incomes, from consumers to producers. Profiteers tend to flourish along with populists. [15] See Mark Dowding. 'BlueBay CIO: It's time to think about debt cancellation.' 4 January 2021. ft.com/content/dffca01a-173a-4d68-bc68-9af9045e712e [16] See ABC News (US). 'Is minting a $1 trillion platinum coin the answer to the debt limit crisis?' 8 October 2021. abcnews.go.com/Politics/minting-trillion-platinum-coin-answer-debt-limit-crisis/story [17] IMF Blog. 'The G20 common framework for debt treatments must be stepped up.' 2 December 2021. blogs.imf.org/2021/12/02/the-g20-common-framework-for-debt-treatments-must-be-stepped-up/ [18] Bloomberg News. 'Powell weighs earlier end to bond tapering amid hot inflation.' 30 November 2021. bloomberg.com/news/articles/2021-11-30/powell-says-appopriate-to-weigh-earlier-end-to-bond-buy-tapering?sref=ORbm2mFs [19] Federal Reserve. 'Minutes of the Federal Open Market Committee. 14 to 15 December 2021.' 5 January 2022. federalreserve.gov/monetarypolicy/fomcminutes20211215.htm [20] International Development Association, IMF. 'The evolution of public debt vulnerabilities in lower income countries.' 2 January 2020. Page 2. documents1.worldbank.org/curated/en/695971579921244762/pdf/The-Evolution-of-Public-Debt-Vulnerabilities-in-Lower-Income-Economies.pdf [21] IMFBlog. 'Emerging economies must prepare for Fed policy tightening.' 10 January 2022. blogs.imf.org/2022/01/10/emerging-economies-must-prepare-for-fed-policy-tightening/ [22] Centre for Economic Policy Research. 'Averting catastrophic debt crises in developing country extraordinary challenges calls for extraordinary measures.' CEPR Policy Insight No 104. July 2020. cepr.org/active/publications/policy_insights/viewpi.php?pino=104 [23] Geopolitical Monitor. 'Zambia becomes first post-covid debt default.' 17 November 2020. geopoliticalmonitor.com/zambia-becomes-first-post-covid-debt-default/. Most sovereign bond contracts do not include automatic force majeure protection that allows contracts to be broken due to unforeseen circumstances such as a pandemic. [24] Adam Tooze. 'Shutdown. How covid shook the world's economy.' Allen Lane. 2021. Page 164. [25] To reduce the risk, many partial solutions are offered to avoid steep defaults. US economist Joseph Stiglitz, for instance, argues for mechanisms such as 'voluntary sovereign-debt buybacks' that proved effective in Latin America in the 1990s and during the Greek crises of the 2010s. "They have the advantage of avoiding the harsh terms that typically come with debt swaps," Stiglitz argues. A buyback program under IMF oversight would aim to reduce debt burdens by securing significant discounts on the face value of sovereign bonds and by minimising exposure to risky private creditors, Stiglitz says. Such programs could advance health, climate and other goals by requiring that beneficiary governments spend the money that otherwise would have gone to debt service on creating public goods. See Centre for Economic Policy Research. Op cit. [26] See IMFBlog. 'Time is ripe for innovation in the world of sovereign debt restructuring.' 19 November 2020. blogs.imf.org/2020/11/19/time-is-ripe-for-innovation-in-the-world-of-sovereign-debt-restructuring/. See also United Nations. 'The commission of experts of the president of the UN General Assembly on reforms of the international monetary and financial system.' 2009. un.org/en/ga/president/63/pdf/calendar/20090325-economiccrisis-commission.pdf [27] Bloomberg. 'One country, nine defaults: Argentina is caught in a vicious cycle.' 11 September 2019. bloomberg.com/news/photo-essays/2019-09-11/one-country-eight-defaults-the-argentine-debacles Important Information: This material has been delivered to you by Magellan Asset Management Limited ABN 31 120 593 946 AFS Licence No. 304 301 ('Magellan') and has been prepared for general information purposes only and must not be construed as investment advice or as an investment recommendation. This material does not take into account your investment objectives, financial situation or particular needs. This material does not constitute an offer or inducement to engage in an investment activity nor does it form part of any offer documentation, offer or invitation to purchase, sell or subscribe for interests in any type of investment product or service. You should read and consider any relevant offer documentation applicable to any investment product or service and consider obtaining professional investment advice tailored to your specific circumstances before making any investment decision. A copy of the relevant PDS relating to a Magellan financial product or service may be obtained by calling +61 2 9235 4888 or by visiting www.magellangroup.com.au. Important Information: This material has been delivered to you by Magellan Asset Management Limited ABN 31 120 593 946 AFS Licence No. 304 301 ('Magellan') and has been prepared for general information purposes only and must not be construed as investment advice or as an investment recommendation. This material does not take into account your investment objectives, financial situation or particular needs. This material does not constitute an offer or inducement to engage in an investment activity nor does it form part of any offer documentation, offer or invitation to purchase, sell or subscribe for interests in any type of investment product or service. You should read and consider any relevant offer documentation applicable to any investment product or service and consider obtaining professional investment advice tailored to your specific circumstances before making any investment decision. A copy of the relevant PDS relating to a Magellan financial product or service may be obtained by calling +61 2 9235 4888 or by visiting www.magellangroup.com.au. Past performance is not necessarily indicative of future results and no person guarantees the future performance of any strategy, the amount or timing of any return from it, that asset allocations will be met, that it will be able to be implemented and its investment strategy or that its investment objectives will be achieved. This material may contain 'forward-looking statements'. Actual events or results or the actual performance of a Magellan financial product or service may differ materially from those reflected or contemplated in such forward-looking statements. This material may include data, research and other information from third party sources. Magellan makes no guarantee that such information is accurate, complete or timely and does not provide any warranties regarding results obtained from its use. This information is subject to change at any time and no person has any responsibility to update any of the information provided in this material. Statements contained in this material that are not historical facts are based on current expectations, estimates, projections, opinions and beliefs of Magellan. Such statements involve known and unknown risks, uncertainties and other factors, and undue reliance should not be placed thereon. Any trademarks, logos, and service marks contained herein may be the registered and unregistered trademarks of their respective owners. This material and the information contained within it may not be reproduced, or disclosed, in whole or in part, without the prior written consent of Magellan. |

1 Feb 2022 - Why I think 2022 will be a very good year for investors
|
Why I think 2022 will be a very good year for investors Montgomery Investment Management 05 January 2022 A year ago, I wrote an article in The Australian which set out the factors I thought would make it a very good year for equities. So far, the local market has behaved as expected - despite all the turmoil in the world - with the All Ordinaries up 13.6 per cent for the 12 months to 31 December 2021. Looking ahead, I think markets will continue to reward investors, particularly those who invest in quality businesses. Significant price moves are always determined by the magnitude of surprise. The bigger the surprise, the bigger the move. And so, in the absence of a black swan - something completely unexpected - market returns will be determined by earnings growth. And, completing the idea, the best returns will come from those companies whose earnings grow faster than currently anticipated. For those who believe the market will crash, it is worth remembering such events are typically triggered by the unexpected, the black swan. Those who profited greatly from the Global Financial Crisis were so few and far between a book was written about them. The logic on which they established their trades at the time of the crash was not widely known. When the idea a large cohort of subprime borrowers might be unable to make their first loan repayment was published, it was not widely embraced as a market catalyst. Generally, it won't be what we already know that brings on a correction. For now, we can probably rule out a correction from inflation or the current Omicron strain of COVID-19 because there are as many adherents of these ideas as there are detractors. Most of the headlines warning inflation isn't transitory cite manufacturers and retailers who state emphatically prices aren't coming down. But that isn't tantamount to accelerating inflation. It just means there will be no deflation. If US inflation this year is seven per cent but next year 6.5 per cent, the retailers and the manufacturers will be right - prices aren't going down. It is also true however that price increases are decelerating and that's called Disinflation. Disinflation, when it coincides with economic growth, is historically very good for equities, especially growth equities. Innovative companies and those with pricing power, which tend to be those with sustainable competitive advantages do best in a disinflationary economic expansion. Read any of our documentation and you will find we have always preferred businesses with sustainable economic advantages because it is these companies that produce attractive returns on their equity. Supply chain bottlenecks have impacted almost every corner of commerce and while these bottlenecks remain, inflation will be elevated. Our channel checks of impacted businesses, which include wholesalers, hospitality and retailers, digital, healthcare, IT and advertising, suggest the bottlenecks are lingering. And while that is true it isn't tantamount to further acceleration in the inflation rate. With respect to the inflation discussion, I currently believe only a surprise acceleration would be negative for the market in aggregate. Even fears of such an acceleration won't cause a crash because those fears have persisted for a year now. And don't forget inflation has surged without crashing the market. Following the virus, I believe, is more imperative than following inflation. A new definition for fully-vaccinated is emerging - three doses. On that definition, about one per cent of the world is fully vaccinated, including me. Of course, that means plenty of opportunity for variants to emerge. Understandably, Main Street is worried a variant emerges, able to undermine the current crop of vaccines. Trading at near record highs, market prices suggest such an outcome is not anticipated, so such a development could be an unmitigated disaster. As investors we do have to keep a close eye on the progress of COVID-19. Transmissibility appears to be increasing with each variant. The original variant had a basic R number of about three, followed by Alpha, estimated to have an R0 of 4-5 and Delta, with an R0 of 6-8. Omicron appears to be even higher. Measles has an R0 which has been estimated to be as high as 18 and is therefore one of the most infectious human-to-human diseases. COVID-19 may yet have a long way to evolve. Such developments aren't being widely discussed, so it is these developments, investors should be tracking closely. But of course, through every crisis the highest quality companies, by definition, have fallen less and then rallied first and fastest afterwards. I suggest the same pattern will emerge during and after the next crisis. Take a look at the Buy Now Pay Later (BNPL) sector. We have warned investors about this space since 2018. Describing the players as nothing more than factoring businesses we pointed to three things that investors were missing or deliberately ignoring:
Since we published those many warnings, Afterpay is now down about 49 percent from its 2021 highs and the rest of the field has fallen a minimum of 70 percent from their highs. Investing in quality, avoiding the rubbish and not jumping at the shadows that are already a part of the investment landscape are the keys to navigating markets and it will be no different in 2022. There is the ever-present risk of a 10-15 percent correction but in the absence of a COVID-19 Black Swan, I think investors have little to worry about in 2022. Indeed, if disinflation also emerges, we may just find markets record another strong year. And longer term (sooner if international borders open to migrant workers), I currently expect we will return to structurally lower wages growth and therefore structurally lower inflation and interest rates. All very positive for markets. Written By Roger Montgomery Funds operated by this manager: Montgomery (Private) Fund, Montgomery Small Companies Fund, The Montgomery Fund |

31 Jan 2022 - Performance Report: Laureola Australia Feeder Fund
| Report Date | |
| Manager | |
| Fund Name | |
| Strategy | |
| Latest Return Date | |
| Latest Return | |
| Latest 6 Months | |
| Latest 12 Months | |
| Latest 24 Months (pa) | |
| Annualised Since Inception | |
| Inception Date | |
| FUM (millions) | |
| Fund Overview | Life Settlements are resold life insurance policies and can be thought of as a form of finance extended to an individual backed by the person's life insurance policy. This financing is repaid upon maturity by collecting the death benefit from the insurance company. Risk mitigation measures implemented by Laureola include science-driven due diligence of policies, active monitoring of insured through a vertically integrated operation, and investor aligned fund design. |
| Manager Comments | The Laureola Master Fund has a track record of 8 years and 9 months and has consistently outperformed the Bloomberg AusBond Composite 0+ Yr Index since inception in May 2013, providing investors with a return of 15.12%, compared with the index's return of 3.71% over the same time period. On a calendar basis the fund has never had a negative annual return in the 8 years and 9 months since its inception. Its largest drawdown was -4.9% lasting 10 months, occurring between December 2018 and October 2019. The Manager has delivered higher returns but with higher volatility than the index, resulting in a Sharpe ratio which has never fallen below 1 and currently sits at 2.42 since inception. The fund has provided positive monthly returns 97% of the time in rising markets, and 100% of the time when the market was negative, contributing to an up capture ratio since inception of 160% and a down capture ratio of -258%. |
| More Information |
31 Jan 2022 - Fund Review: Insync Global Capital Aware Fund December 2021
INSYNC GLOBAL CAPITAL AWARE FUND
Attached is our most recently updated Fund Review on the Insync Global Capital Aware Fund.
We would like to highlight the following:
- The Global Capital Aware Fund invests in a concentrated portfolio of 15-30 stocks, targeting exceptional, large cap global companies with a strong focus on dividend growth and downside protection.
- Portfolio selection is driven by a core strategy of investing in companies with sustainable growth in dividends, high returns on capital, positive free cash flows and strong balance sheets.
- Emphasis on limiting downside risk is through extensive company research, the ability to hold cash and long protective index put options.
For further details on the Fund, please do not hesitate to contact us.

31 Jan 2022 - Fund Review: Bennelong Twenty20 Australian Equities Fund December 2021
BENNELONG TWENTY20 AUSTRALIAN EQUITIES FUND
Attached is our most recently updated Fund Review on the Bennelong Twenty20 Australian Equities Fund.
- The Bennelong Twenty20 Australian Equities Fund invests in ASX listed stocks, combining an indexed position in the Top 20 stocks with an actively managed portfolio of stocks outside the Top 20. Construction of the ex-top 20 portfolio is fundamental, bottom-up, core investment style, biased to quality stocks, with a structured risk management approach.
- Mark East, the Fund's Chief Investment Officer, and Keith Kwang, Director of Quantitative Research have over 50 years combined market experience. Bennelong Funds Management (BFM) provides the investment manager, Bennelong Australian Equity Partners (BAEP) with infrastructure, operational, compliance and distribution services.
For further details on the Fund, please do not hesitate to contact us.
31 Jan 2022 - Running a life settlements fund
|
Running a life settlements fund Laureola Advisors January 2022 Like any fund manager a life settlements fund has a team of specialists and an asset to analyse and purchase to maximise return. It must be understood that the market is tiny where only 3,200 life insurance policies came onto the market last year in the USA. Given the surrender rate of several hundred thousand each year, it is a small number. A lot of people don't often know what a valuable asset they have paid for over many years and simply let them close down. People buy insurance to protect a family or a mortgage debt in the event of untimely death but once the family has grown up and left home and the house paid for, the need for insurance has gone. Typically the insured will contact the insurance company and just accept the contractual surrender value. Some will instead speak to their agent and learn that there is a chance of a far greater cash sum by selling the policy to an investor. In this instance the agent will contact a Licensed Broker whose job it is to represent the seller. He will prepare a file which will include all the policy details and arrange for the insured to have a medical examination the results of which will be provided to one (or more) of the actuarial firms that provide a Life Expectancy (LE) for the individual where the LE is a number usually given in months. It is worth making the point that the LE is not the month in which the insured is expected to die but rather the midpoint on a probability distribution curve where of 1,000 people of the same age and gender and with the same health issues, 500 are expected to die before the LE and 500 after. The file is then sent to Licensed Providers in the U.S. who are the only people legally able to buy an insurance policy from an insured and who represent the investors who are typically managers; an auction process follows. The managers have a great deal of certainty around many of the metrics of the asset; the death benefit is known; the premium costs are known and the credit risk is immaterial; the only thing that is not known is the maturity date. Managers do have the LE which has been provided by the actuarial firms that service the life settlement market and can have access to the medical records but most simply rely upon the LE. It then remains for the manager to choose what discount rate to apply to the cashflows (given the assumed LE) and to make a bid for the policy on that basis. The market usually trades policies where the purchase price assumes a projected internal rate of return (IRR) of between 12% and 14% (though there is wide dispersion around this range) and on this basis the purchase price offered is usually around four times more than the contractual surrender value offered by the insurance company. Most middle-class Americans do not have sufficient assets to fund a comfortable retirement, let alone pay for all the medical and care costs that might be anticipated. Selling their life insurance contract, rather than surrendering it to the insurance company, in many cases makes a very significant difference to the quality of their lives going forward. If the LEs were right and were in fact the mid-point of the mortality curve then the manager could rely upon the law of large numbers, buy lots of policies and expect gross IRRs across the portfolio to be 12% to 14%. The asset is very expensive to track and fund costs are correspondingly high so management fees and fund costs will reduce this gross return by 4% or 5% leaving a net-to-investor return in this situation of 7% to 10%. Most managers and investors do rely upon the accuracy of the LE and the law of large numbers. However, if instead of 500 dying before the LE and 500 after what happens is that only 450 die before and 550 die after, then the LEs from which the policies were purchased and the portfolio was valued are wrong and where the gross projected IRR was 12% to 14%, the gross actual IRR turns out to be 8% to 10%, with a corresponding net-toinvestor return of 3% to 6%. It is obvious that you can test the accuracy of LEs historically, but how can you be sure if forward-looking LEs are accurate? Consider this: With a probability distribution curve over a large population, for any given LE it is possible to predict how many deaths the portfolio would experience each year with a high level of statistical confidence. So, even though the LE has not yet been reached, deaths should already be occurring and the number can be compared with those expected. If the actual number of deaths is (statistically significantly) less than expected, the LE is too short and should be pushed out to fit the early years' experience. History has shown that the LEs provided by the actuarial firms have been and continue to be too short and consequently investor expectations have not been met. If a manager is able to construct a portfolio where half the insureds die before the LE and half afterwards then the gross projected IRRs are preserved and this is the focus of the Laureola investment approach. The six actuarial firms that provide LEs to the market have strengths and weakness across different illnesses and clusters of illnesses. This fact is known qualitatively by all the participants in the life settlement market, including the Licensed Brokers who first bring the policy to the market. It should be no surprise that the Brokers choose the shortest LE available because this pushes the price (and their commission) up. Laureola's four-person investment team spent two years analysing the strengths and weaknesses of the LE providers and has a much better understanding quantitively of how short or long they are with respect to various health conditions. Additionally, Laureola has a medical and scientific advisory panel which reviews the LE in the light of current research. Areas of expertise of the panel include heart disease, circulatory disease and cancer - illnesses which account for the death of two thirds of American citizens. For example the heart specialist (who is working on the leading edge of new treatments for heart disease and has several patents for medical devices) might advise the investment team that there are treatments being developed which might prolong the life of a particular insured with heart or circulatory problems beyond current estimates, in other words that he/she is more likely on average to live beyond the given LE than die before; this would be a reason not to buy this policy. Or in the case of a cancer patient, the Chief Scientific Officer might advise the investment team that a particular insured with a particular from of cancer with particular features and at a particular stage is more likely on average to die before the given LE which would be a reason to consider buying the policy. It is not enough just to buy cheap policies (as measured by the discount rate) because the real value is extracted from this asset class by choosing policies which mature before the LE; all the value of a cheap policy is lost if the insured lives too long past his/her LE. The added value of the Laureola investment team is its focus on the mortality of every single policy in the portfolio. Once a policy has been purchased and is held within the portfolio, it needs to be understood that the health of the insured might worsen or improve over time, affecting its value within the portfolio. Changes in the health of the insureds is critical information for an investment team focussed on the mortality of every policy. Most managers outsource what is loosely referred to as "tracking" to third parties where the information sought is when there has been a death. Laureola carries out the tracking function internally with a team dedicated to forming relationships with the insureds. In the case where the health of an insured has improved, for example by surviving cancer, the team will quickly learn about it and although the improvement in health and life expectancy is to be celebrated, the mortality of the policy has worsened from Laureola's standpoint and the policy has become an underperforming asset. In these circumstances, the investment team is likely to consider selling the policy to another manager. Policies are valued very conservatively within the portfolio and Laureola's experience is that in those circumstances where they have sold policies they have done so at a price higher than the prices marked on the book, thus making cash profits on the sale. Laureola Advisors is an established boutique manager in the life settlement space with a 9-year track record (and only 2 negative months). Over 80% of Laureola's published returns are realised gains, i.e. profits from death benefits or policy sales. Returns which are derived from mortality secure the non-correlation sought by many investors. It takes a 12-person team to run Laureola's life settlements operation because the qualitative input requires time and expertise alongside the quantitative analysis to maximise returns. Written By John Swallow, Director of Investor Relations Funds operated by this manager: |