NEWS

14 Aug 2025 - Sustainable equities outlook: AI's transformative role in an evolving global economy
|
Sustainable equities outlook: AI's transformative role in an evolving global economy Janus Henderson Investors August 2025 Portfolio Manager Hamish Chamberlayne explores how, in a world marked by geopolitical upheaval, artificial intelligence (AI) is transforming traditional economic forces, presenting both opportunities and challenges. In today's world, characterised by heightened confusion and unpredictability, geopolitical dynamics are increasingly overshadowing traditional economic forces. Nations worldwide grapple with declining workforce participation, ageing demographics, unproductive government expenditure, and substantial fiscal deficits. Yet, within this turbulent landscape the secular drivers of sustainable investing remain intact. Secular investment trends around electrification, renewable energy, digitalisation, AI, and reshoring are progressing uninterrupted Last year, investment in the green transition reached unprecedented levels, surpassing US$2 trillion for the first time.1 The majority of this funding was directed towards established technologies such as renewable energy, energy storage solutions, smart grids and electric vehicles (EVs). Despite the recent stagnation of US climate initiatives, Europe and China are intensifying their clean energy and broader sustainability efforts. Global EV sales this year are forecast to grow by 25% (22 million) compared to 2024, with China accounting for almost two thirds, followed by Europe (17%).2 Even in the US, EV sales are set to grow by 7% this year despite the Trump administration's withdrawal of federal support. Meanwhile, President Trump's 'Big Beautiful Bill' will provide significant government funding, grants and tax incentives for companies investing in the US. Reshoring manufacturing and developing supply chain resilience in critical minerals are set to underpin a prolonged investment cycle, which is further fuelled by the gigantic levels of investment going towards AI infrastructure. The large tech companies dubbed the 'Magnificent 7' are spending in excess of half a trillion dollars3 annually in the race for AI supremacy. All of this investment is resource and labour intensive and we see sustained growth in demand for power and electrification infrastructure to support it. The role of AI in decarbonisation These high levels of investment provoke questions about environmental sustainability. The build out of all this AI and electrification infrastructure is also carbon intensive and we are paying close attention to the fact that carbon emissions are not going in the right direction. Although we are concerned by this uptick in emissions, we are optimistic that AI will ultimately play a beneficial role in decarbonisation efforts through advancements in innovation and productivity; and we remain confident that the growing demand for energy will be met with increased investments in clean energy solutions. At Janus Henderson we have a proprietary climate transition analysis tool, and we are maintaining close engagement dialogue with our investee companies regarding their decarbonisation pathways. Thus far, we are pleased to report that we have seen no evidence from the companies we invest in that their corporate sustainability initiatives are slowing. In fact, we see that companies worldwide keep setting net-zero targets and pouring capital into efficiency, waste reduction and supply-chain resiliency, providing durable foundations for our sustainable investment themes. Running hot - a fiery economy ahead? Coincident with these high levels of investment, government deficits are expected to remain large, and this is supportive of corporate profitability and asset prices. When combined with easing monetary policy, and pro-growth changes to banking regulation, we believe this is a positive backdrop for global equity markets. Sustainable fundamentalsOur team continues to concentrate on companies positioned to benefit from these enduring sustainability trends. For example, we favour sectors such as industrials and information technology - areas replete with innovators solving efficiency and climate challenges. Companies within electrical equipment, professional services, software, renewables, automotive technology and infrastructure are exposed to the secular themes of electrification, digital services, AI and decarbonisation. These companies are capitalising on booming demand and are exactly the kind of "picks-and-shovels" providers enabling this digital, electric and green future that the world is transitioning towards. We believe it is important to seek out high-quality businesses with strong free cash flow and durable growth. This discipline tempers volatility during market shocks. It echoes lessons from 2020, when companies with robust financials and sustainable moats (competitive advantage that helps protect a company's profitability) proved far more resilient. By "staying on the right side of disruption" - i.e. investing in firms driving change rather than those at risk from it - we believe investors can better weather turbulence and capture superior growth over time. This means being incessantly forward-looking in approach. Our thesis is grounded in the principles of durability allied with innovation - as Peter Drucker, the Austrian American author and consultant who helped develop modern management theory, reminds us:
|
|
Funds operated by this manager: Janus Henderson Australian Fixed Interest Fund , Janus Henderson Conservative Fixed Interest Fund , Janus Henderson Diversified Credit Fund , Janus Henderson Global Natural Resources Fund , Janus Henderson Tactical Income Fund , Janus Henderson Australian Fixed Interest Fund - Institutional , Janus Henderson Conservative Fixed Interest Fund - Institutional , Janus Henderson Cash Fund - Institutional , Janus Henderson Global Multi-Strategy Fund , Janus Henderson Global Sustainable Equity Fund , Janus Henderson Sustainable Credit Fund 1Source: International Energy Agency, 'World Energy Investment 2025'. 2Source: BloombergNEF, 'Long-Term Electric Vehicle Outlook 2025', 18 June 2025. 3Source: Financial Times, 'What'll happen if we spend nearly $3tn on data centres no one needs?', 30 July 2025 Deficit: A government deficit occurs when expenses exceed revenues (or taxation). Equity: A security representing ownership, typically listed on a stock exchange. 'Equities' as an asset class means investments in shares, as opposed to, for instance, bonds. To have 'equity' in a company means to hold shares in that company and therefore have part ownership. Free cash flow: the amount of cash a company has left after paying operating expenses and capital expenditure. Fiscal/Fiscal policy: Describes government policy relating to setting tax rates and spending levels. Fiscal policy is separate from monetary policy, which relates to control of interest rates and the money supply and is typically set by a central bank. Magnificent 7: A group of seven dominant tech companies - Alphabet, Amazon, Apple, Meta, Microsoft, Nvidia and Tesla - that have helped drive strong returns in the US stock market in recent years. Net zero: A target of achieving a balance between greenhouse gases emitted into the atmosphere and the amount removed from it. Greenhouse gases are those that contribute to climate change. Secular: In economics, this refers to trends that are long term and sustained, distinct from short-term seasonal variations or the business cycle (expansion and Volatility: The rate and extent to which the price of a portfolio, security or index moves up or down. References made to individual securities do not constitute a recommendation to buy, sell or hold any security, investment strategy or market sector, and should not be assumed to be profitable. All opinions and estimates in this information are subject to change without notice and are the views of the author at the time of publication. Janus Henderson is not under any obligation to update this information to the extent that it is or becomes out of date or incorrect. The information herein shall not in any way constitute advice or an invitation to invest. It is solely for information purposes and subject to change without notice. This information does not purport to be a comprehensive statement or description of any markets or securities referred to within. Any references to individual securities do not constitute a securities recommendation. Past performance is not indicative of future performance. The value of an investment and the income from it can fall as well as rise and you may not get back the amount originally invested. Whilst Janus Henderson believe that the information is correct at the date of publication, no warranty or representation is given to this effect and no responsibility can be accepted by Janus Henderson to any end users for any action taken on the basis of this information. |

13 Aug 2025 - Performance Report: Bennelong Emerging Companies Fund
[Current Manager Report if available]

13 Aug 2025 - Performance Report: Airlie Australian Share Fund
[Current Manager Report if available]

13 Aug 2025 - Performance Report: Seed Funds Management Hybrid Income Fund
[Current Manager Report if available]

13 Aug 2025 - 10k Words |August 2025
|
10k Words Equitable Investors Aug 2025 Apparently, Confucius did not say "One Picture is Worth Ten Thousand Words" after all. It was an advertisement in a 1920s trade journal for the use of images in ads on the sides of streetcars... There's a healthy spread between the volatility investors are pricing in for small caps relative to large caps but high yield ("junk") spreads are near historical lows. Sticking with the small-big spread, the price/book chart is smiling back at you. Valuations for high growth companies have shot away from the pack, giving the US market an edge over Australian multiples - but with both above fair value according to Morningstar. ASX large caps have seen more upgrades than downgrades in the week leading into reporting season. We divert to look at the split of assets between generations and the affordability of housing; stablecoins becoming relevant players in the US treasuries market; China's declining population of workers; and finally volatility for "Dr Copper". Spread between VIX (S&P 500 implied volatility) and Russell 2000 VIX (small cap implied volatility) 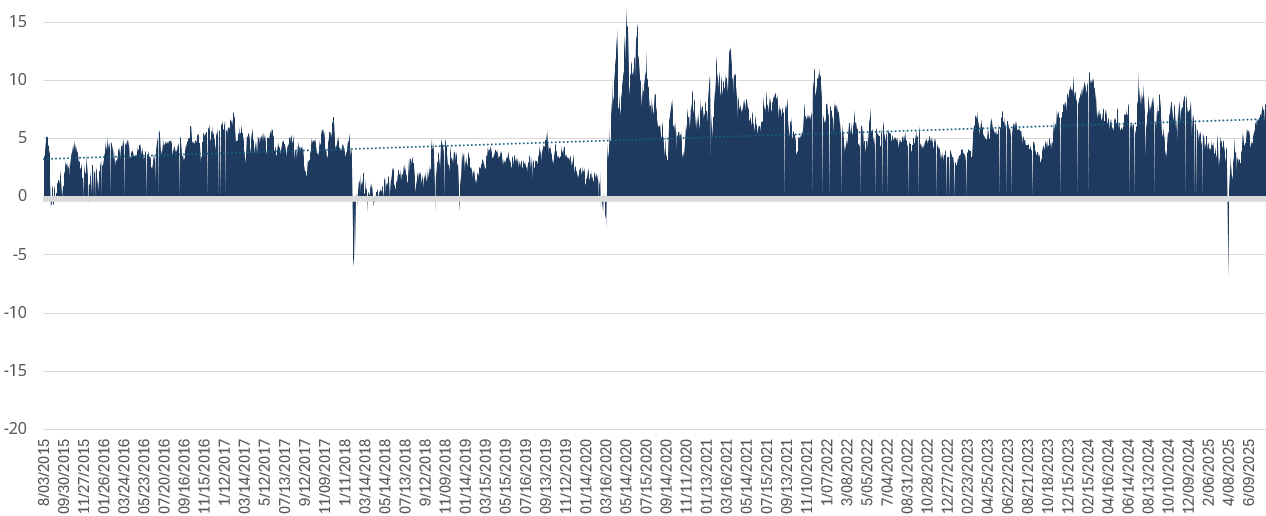
Source: Equitable Investors ICE BofA US High Yield Index Option-Adjusted Spread 
Source: FRED (Federal Reserve of St Louis) Premium in US large caps' price/boom multiples is the widest in 25 years 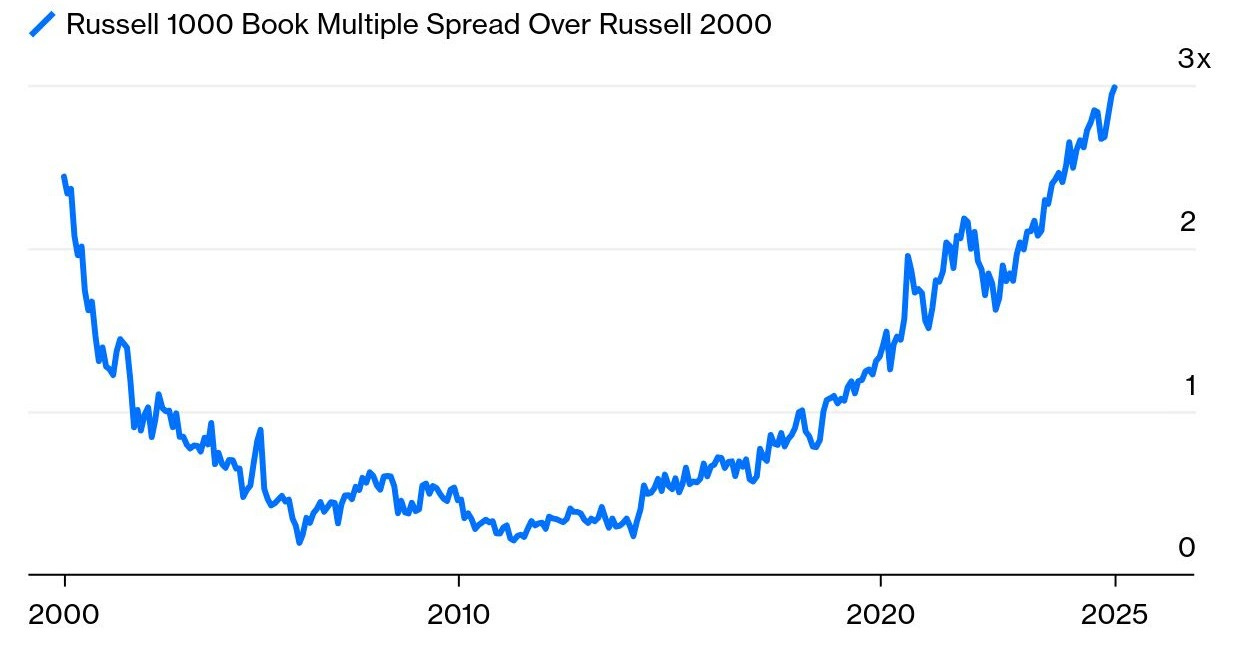
Source: Bloomberg Recent multiple expansion in "high growth" (>25% YoY growth) companies 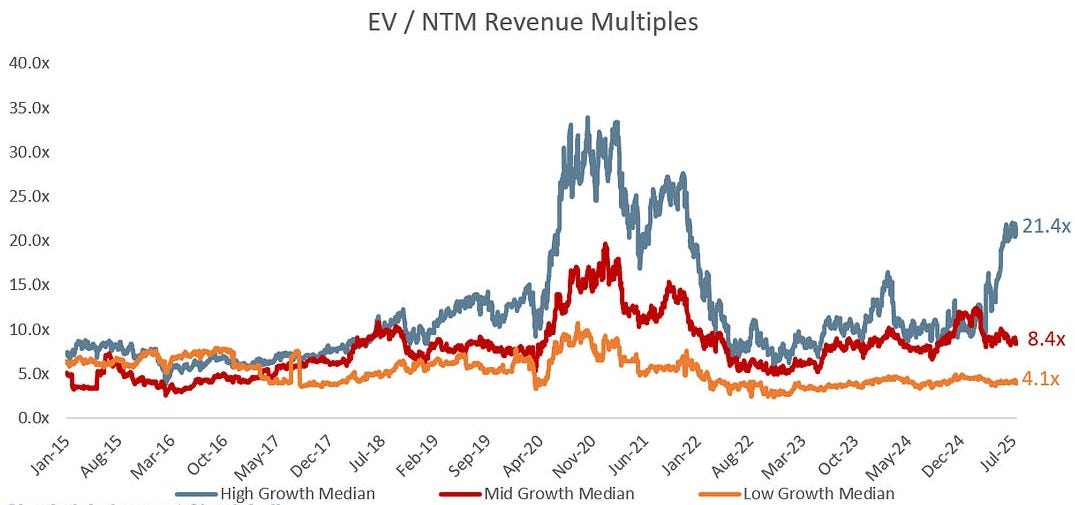
Source: Altimeter via Clinton Capital Forward P/E - US v Australia 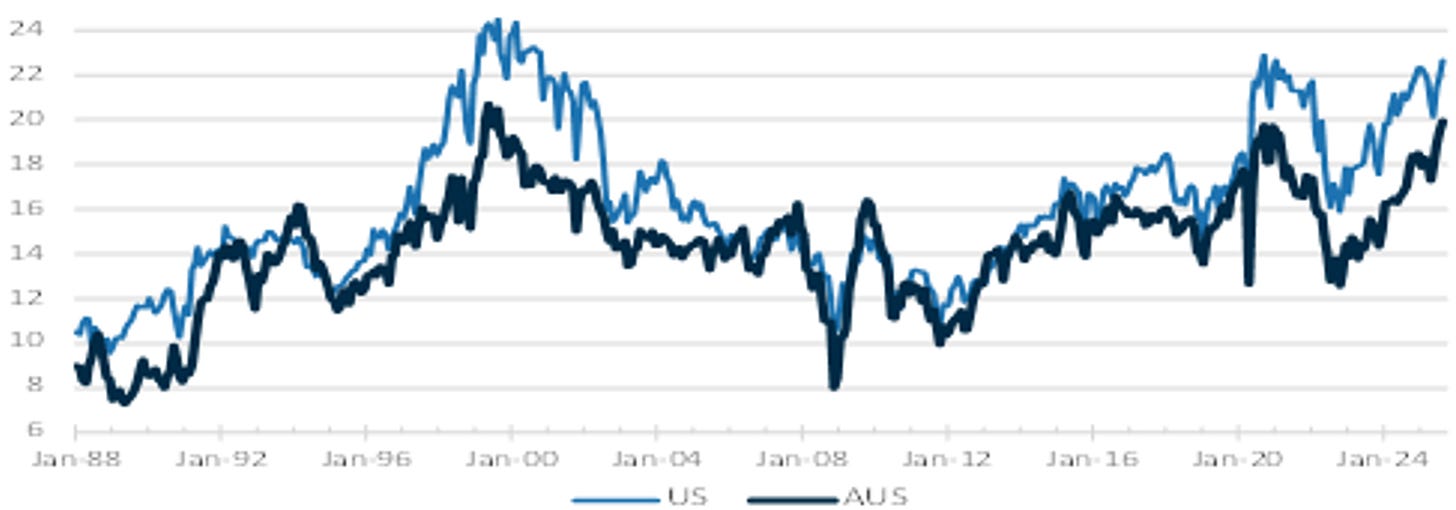
Source: Ord Minnett Australian market trading above Morningstar's bottom-up fair value estimate 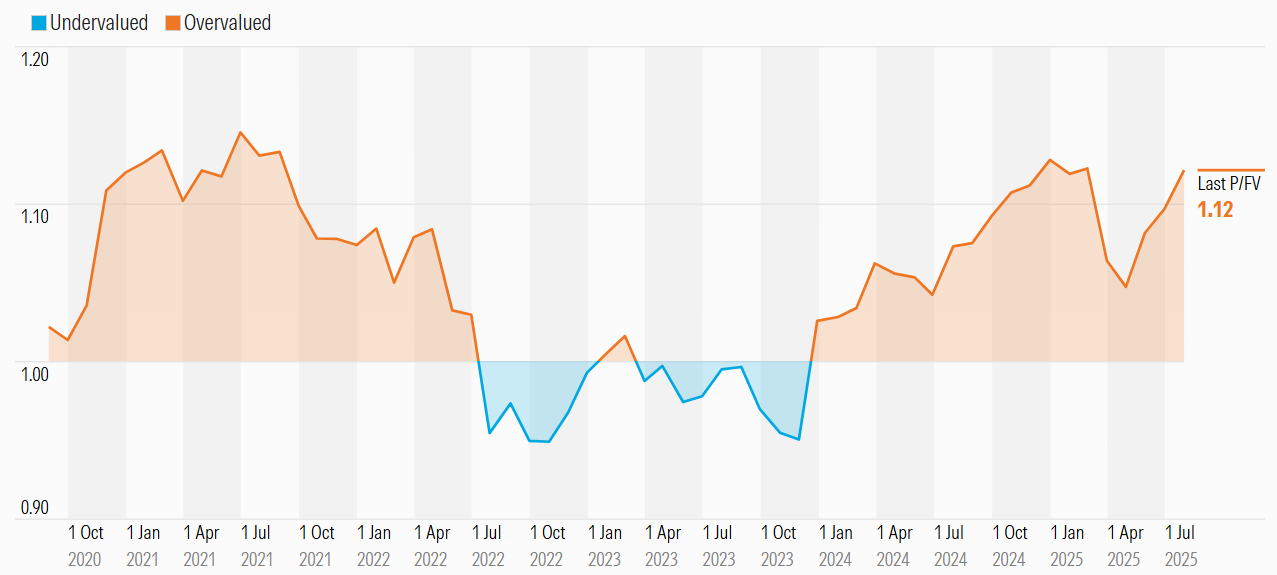
Source: Morningstar US market has also return to a premium v bottom-up fair value 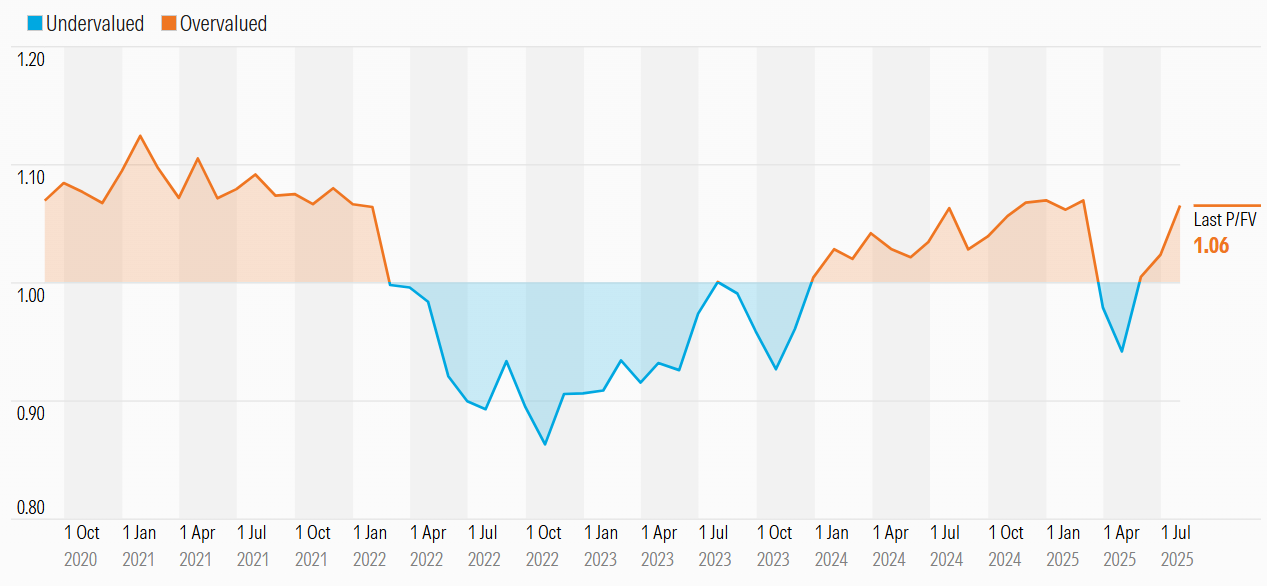
Source: Morningstar More consensus upgrades than downgrades for ASX large caps over week leading into August reporting season 
Source: Equitable Investors Share of US household assets owned by those aged 55 and above 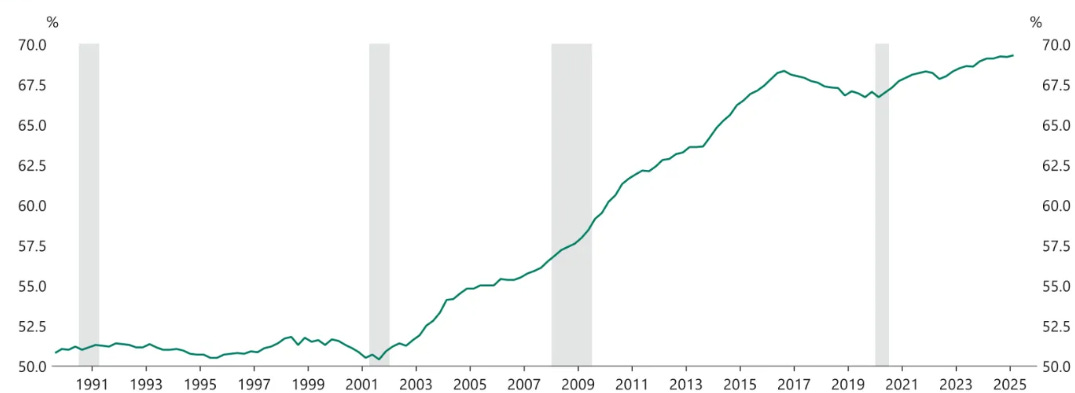
Source: Apollo Global Management Distribution of Australian household net worth by age group 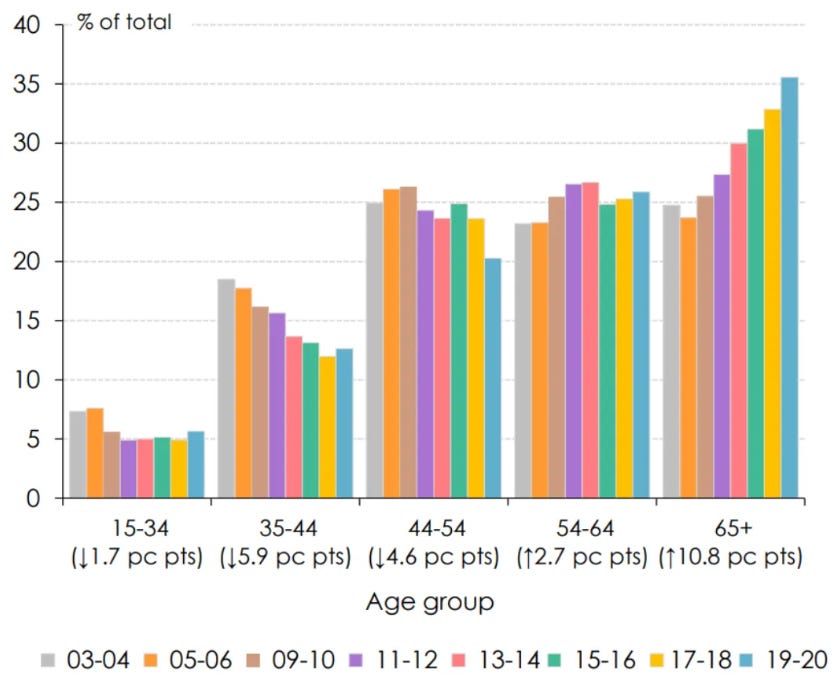
Source: Saul Eslake House price to income ratios 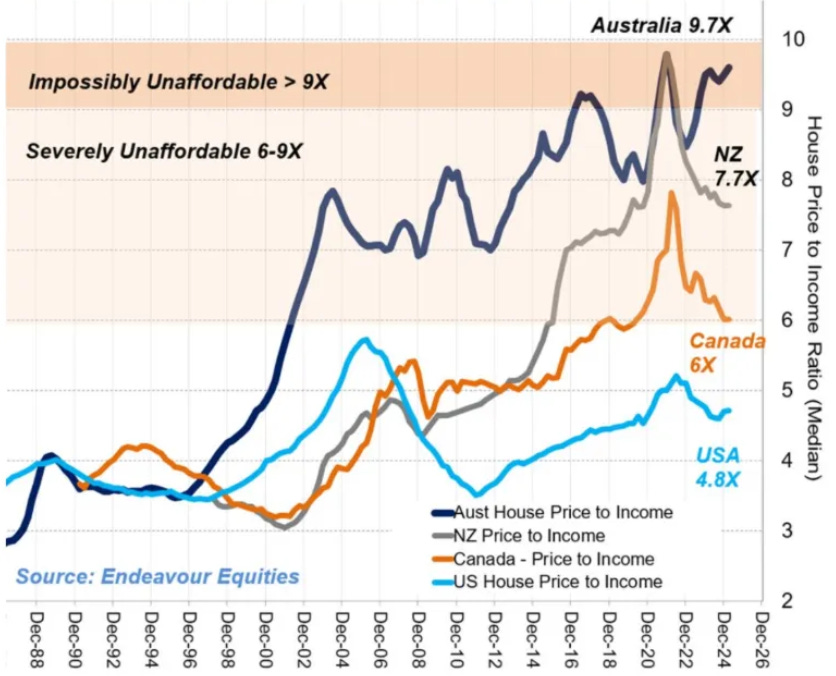
Source: Endeavour Equities Stablecoins the 18th largest external holder of US Treasuries 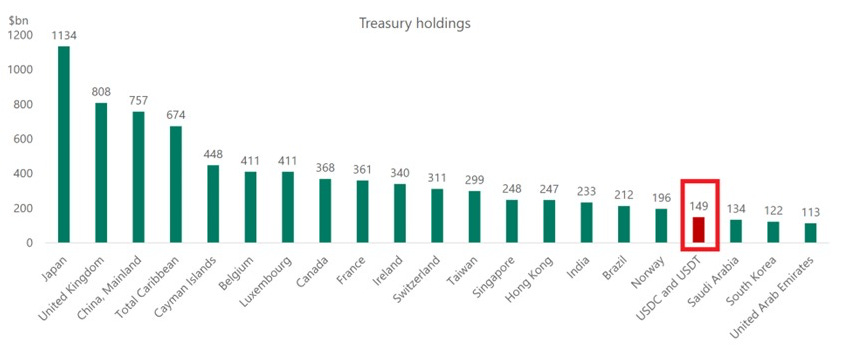
Source: The Kobeissi Letter China's working-age population expected to decline dramatically 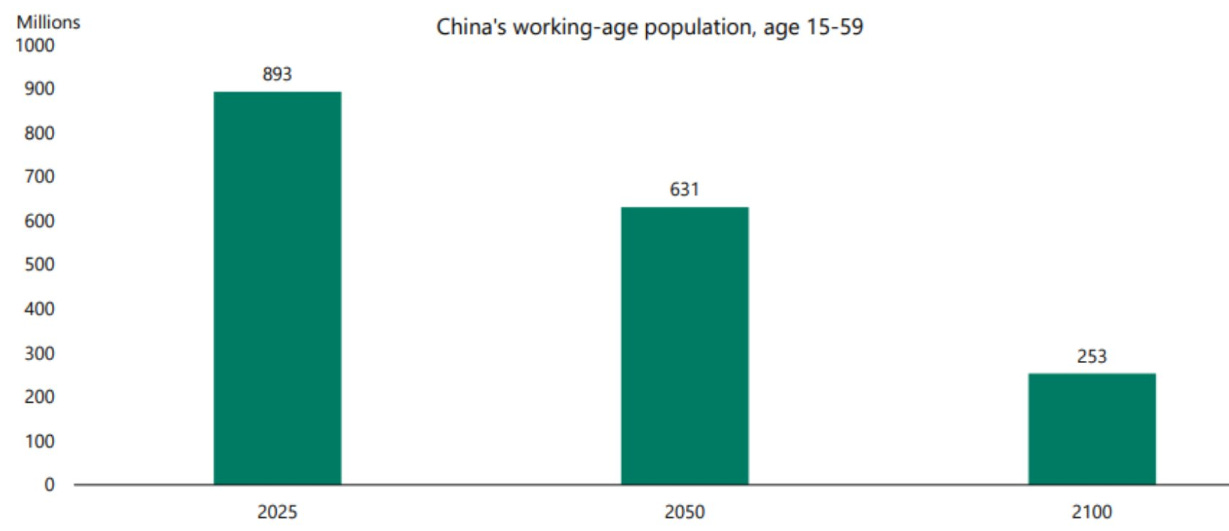
Source: Apollo via Forager Dr Copper has turned volatile - daily price changes 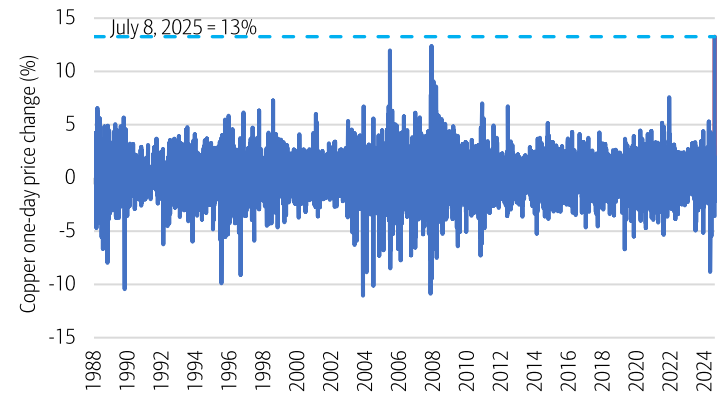
Source: BoAML August 2025 Edition Funds operated by this manager: Equitable Investors Dragonfly Fund Disclaimer Past performance is not a reliable indicator of future performance. Fund returns are quoted net of all fees, expenses and accrued performance fees. Delivery of this report to a recipient should not be relied on as a representation that there has been no change since the preparation date in the affairs or financial condition of the Fund or the Trustee; or that the information contained in this report remains accurate or complete at any time after the preparation date. Equitable Investors Pty Ltd (EI) does not guarantee or make any representation or warranty as to the accuracy or completeness of the information in this report. To the extent permitted by law, EI disclaims all liability that may otherwise arise due to any information in this report being inaccurate or information being omitted. This report does not take into account the particular investment objectives, financial situation and needs of potential investors. Before making a decision to invest in the Fund the recipient should obtain professional advice. This report does not purport to contain all the information that the recipient may require to evaluate a possible investment in the Fund. The recipient should conduct their own independent analysis of the Fund and refer to the current Information Memorandum, which is available from EI. |

12 Aug 2025 - Australian Secure Capital Fund - Market Update
|
Australian Secure Capital Fund - Market Update Australian Secure Capital Fund July 2025
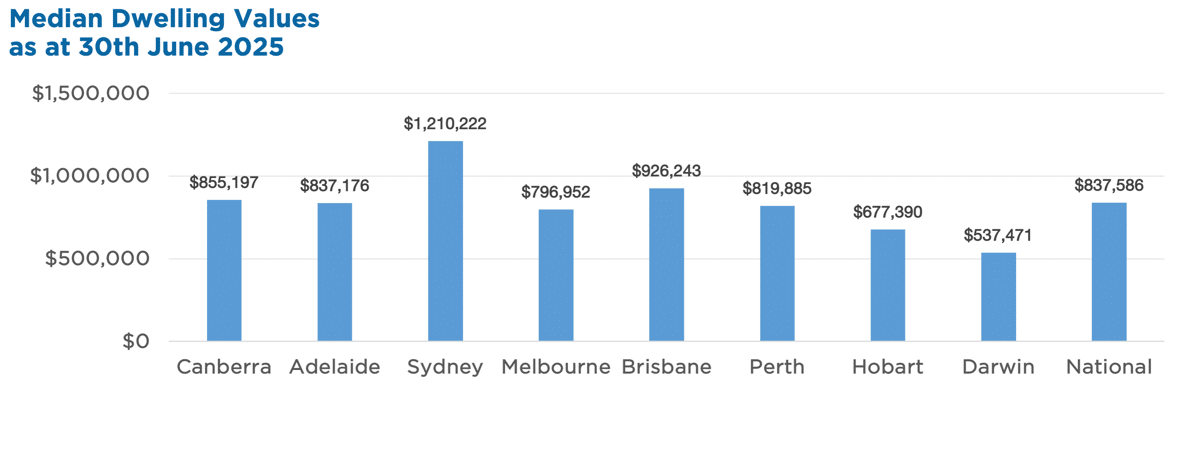
Australian housing values rose 0.6% in June, marking five straight months of growth. The June quarter saw a 1.4% national increase, with gains across most capital cities - driven by falling interest rates and low advertised stock. Key highlights:
Despite affordability constraints and economic uncertainty, tight supply and easing rates continue to support modest value growth across Australian markets. Property Values as at 30th of June 2025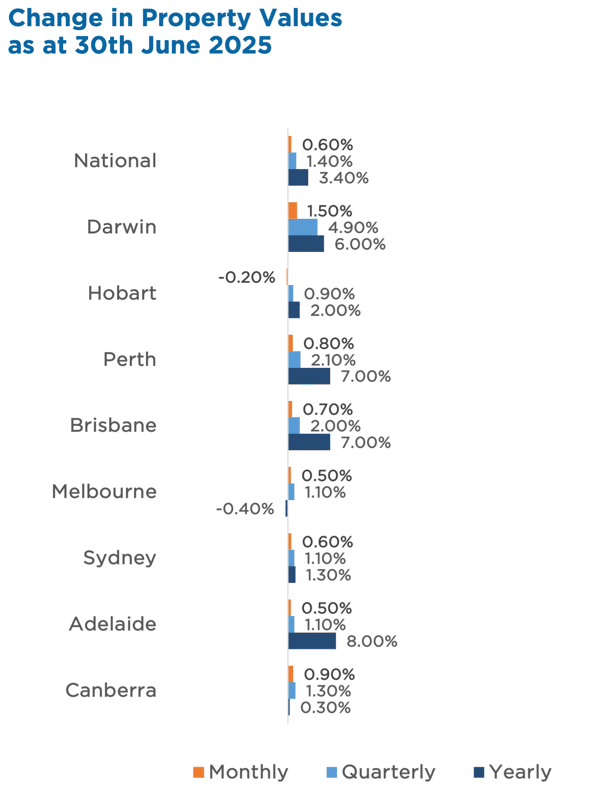 Median Dwelling Values
|

11 Aug 2025 - Performance Report: Bennelong Twenty20 Australian Equities Fund
[Current Manager Report if available]

11 Aug 2025 - 5 Things Investors Get Wrong About Trend-Following
|
5 Things Investors Get Wrong About Trend-Following East Coast Capital Management August 2025 5 Things Some Investors Get Wrong About Trend-Following - And Why It's Worth Rethinking Portfolio Resilience Trend-following has been a cornerstone strategy for many sophisticated allocators over decades. Yet it remains surprisingly underrepresented in the portfolios of high-net-worth individuals and family offices. Why? Because common misconceptions often overshadow its proven benefits. Below are five of the most frequent misunderstandings we hear from advisers and investors, and why it's worth taking a fresh look.
It's a refrain that pops up regularly: "Trend-following is dead." History tells a different story. During major market dislocations - such as 2008, 2014, 2020, and 2022 -- trend-following strategies have often been among the best performers. The key is understanding that trend-following is cyclical, not broken. It thrives in volatile or directional markets, i.e. precisely when traditional portfolios, heavily reliant on equities and bonds, struggle.
This is a common oversimplification. Trend-following isn't about hype, news, or hot sectors. It's about price confirmation. Systematic, rules-based models scan global markets daily, adjusting exposures based solely on observable price trends. This removes emotion and narrative bias from the equation, resulting in a disciplined process rather than a speculative bet.
Uncorrelated doesn't mean reckless. In fact, professional trend-following programs explicitly target and manage volatility. More importantly, trend-following tends to be "long volatility", meaning it often gains when traditional assets fall sharply. This provides essential ballast in downturns, preserving capital when it matters most.
That was the perception decades ago, but today's trend-following strategies are far more diversified. They trade across equities, fixed income, currencies, and commodities, spanning global liquid markets. These aren't directional commodity bets; they are dynamic, macro-driven strategies that adapt to evolving market regimes.
Some treat trend-following as purely tactical or opportunistic. The data challenges this view. Over full market cycles, trend-following has delivered consistent positive returns, low correlation to traditional assets, and strong risk-adjusted performance -- especially in equity crises. This makes it a powerful core diversifier for multi-asset portfolios focused on resilience. Conclusion At ECCM, we view trend-following not as speculation, but as a portfolio stabiliser. It requires no forecasting or macro calls, just a robust, repeatable process to adapt as markets shift. For investors seeking durable, long-term capital growth with reduced drawdowns, trend-following deserves serious consideration. Funds operated by this manager: |

8 Aug 2025 - Expert analysis on what the RBA will do next Tuesday, August 12
|
Expert analysis on what the RBA will do next Tuesday, August 12 FundMonitors.com August 2025 |
|
Chris Gosselin, CEO of FundMonitors.com, speaks with Nicholas Chaplin, Director and Portfolio Manager at Seed Funds Management, and Renny Ellis, Director & Head of Portfolio Management at Arculus Funds Management, ahead of the RBA's August board meeting. Both accurately predicted July's decision to hold rates and weigh in on whether a cut is likely this time. They discuss key economic indicators--including unemployment, inflation, fiscal stimulus, and consumer sentiment--arguing that while conditions justify holding steady, political pressure may force the RBA's hand. The conversation also touches on global influences, particularly rising inflation risks in the US driven by tariffs and currency movements. Both managers share their outlook for the remainder of the year, expecting at most one further rate cut, and outline how they're positioning portfolios amid uncertainty in rates, credit markets, and global economic trends. |

8 Aug 2025 - Hedge Clippings | 08 August 2025
|
|
|
|
Hedge Clippings | 08 August 2025 The RBA meets next Tuesday, and following the June quarter's "trimmed mean"CPI number of 2.7%, Governor Michele Bullock and her board will be under pressure to reduce rates from the current 3.85%. Expectations from economists and the market for a cut are high, although that didn't stop the RBA from sitting on its hands in July, leading to widespread disbelief, disappointment and criticism from economists, mortgage holders, and the media. For followers of Hedge Clippings, there might not have been the same level of surprise following our interview with Nick Chaplin from Seed Funds Management, and Renny Ellis from Arculus Funds Management prior to the July meeting and decision. Both unanimously agreed that the RBA should hold rates then, so we reconvened earlier today to get their current take on next week's decision and the current economic outlook both here and the US. While not 100% in agreement on all points this time around, both Nick and Renny were of the view that not only was the July decision the correct one, but neither were convinced of the need to move next week from the RBA's "slow and steady"and look-through-the-numbers approach. In particular, Renny noted the six-to-nine-month lag between the initial easing in February, and the end of government support or rebates on energy bills. Both were also unconvinced that the slight uptick in unemployment to 4.3% (seasonally adjusted) was sufficient to cause alarm, and certainly don't hold the view of some bank economists, including the CBA, that a further two, or even three, rate cuts to the 3% region are scheduled by early next year. That said, while the CPI and unemployment numbers might say hold, the politics and the media pressure will be intense! You can watch the video here. In the US, the pressure on Fed Chair Jerome Powell to cut rates continues following the weaker-than-expected July employment numbers, and downward revisions to those previously announced. A slowdown in the US economy, at the same time as a tariff-induced increase in inflation, will create further uncertainty both in the US and Australia. Meanwhile Albo has scotched any expectations of changes to economic or taxation policy at or as a result of the upcoming 3-day Economic Summit scheduled for 19th of August, giving as his reason that he will only legislate tax changes during this term based on commitments made leading up to the last election. If there's to be no change, what's the benefit of the summit - unless it is to set in place changes post the 2028 election? Changes to the GST are a long-overdue necessity (along with a revamping of the tax system as a whole that it would enable) but are a political minefield for whichever government is left to introduce them. Maybe it is time for some rare bipartisan support? Instead we have a proposal to tax unrealised capital gains in superannuation. While it may initially only affect those with super balances over $3 million, watch out, it's the thin end of the wedge. When governments (of all persuasions) get the taste of a new source of income, they rarely lose it. Remember that Federal income tax was first introduced in Australia in 1915 as a temporary measure to help fund the war effort in the First World War. Video Expert analysis on what the RBA will do next Tuesday, August 12 | FundMonitors News | Insights The enemy within | Canopy Investors Pivot, don't panic: America's next act | Magellan Asset Management News & Views: One final round of rail consolidation? | 4D Infrastructure
Webinar Recording How to get the most from Fundmonitors.com July 2025 Performance News |
|
|
If you'd like to receive Hedge Clippings direct to your inbox each Friday |

