


NEWS

12 Apr 2022 - The Rate Debate - Episode 26
|
The Rate Debate - Episode 26 Yarra Capital Management 06 April 2022 How high and how fast can rates go? The RBA expects to see economic data that will drive them to hike interest rates earlier than expected. Markets have already jumped the gun and priced future hikes into bond prices. Is the economy as strong as central banks believe, and will interest rates go up as aggressively as the market suggests? Tune in to hear Darren and Chris discuss this in episode 26 of The Rate Debate. |
|
Funds operated by this manager: Yarra Australian Equities Fund, Yarra Emerging Leaders Fund, Yarra Enhanced Income Fund, Yarra Income Plus Fund |

11 Apr 2022 - Performance Report: DS Capital Growth Fund
| Report Date | |
| Manager | |
| Fund Name | |
| Strategy | |
| Latest Return Date | |
| Latest Return | |
| Latest 6 Months | |
| Latest 12 Months | |
| Latest 24 Months (pa) | |
| Annualised Since Inception | |
| Inception Date | |
| FUM (millions) | |
| Fund Overview | The investment team looks for industrial businesses that are simple to understand, generally avoiding large caps, pure mining, biotech and start-ups. They also look for: - Access to management; - Businesses with a competitive edge; - Profitable companies with good margins, organic growth prospects, strong market position and a track record of healthy dividend growth; - Sectors with structural advantage and barriers to entry; - 15% p.a. pre-tax compound return on each holding; and - A history of stable and predictable cash flows that DS Capital can understand and value. |
| Manager Comments | The DS Capital Growth Fund has a track record of 9 years and 3 months and has outperformed the ASX 200 Total Return Index since inception in January 2013, providing investors with an annualised return of 14.92% compared with the index's return of 9.78% over the same period. On a calendar year basis, the fund has only experienced a negative annual return once in the 9 years and 3 months since its inception. Over the past 12 months, the fund's largest drawdown was -10.71% vs the index's -6.35%, and since inception in January 2013 the fund's largest drawdown was -22.53% vs the index's maximum drawdown over the same period of -26.75%. The fund's maximum drawdown began in February 2020 and lasted 6 months, reaching its lowest point during March 2020. The fund had completely recovered its losses by August 2020. The Manager has delivered these returns with 2.1% less volatility than the index, contributing to a Sharpe ratio which has fallen below 1 four times over the past five years and which currently sits at 1.15 since inception. The fund has provided positive monthly returns 89% of the time in rising markets and 36% of the time during periods of market decline, contributing to an up-capture ratio since inception of 66% and a down-capture ratio of 51%. |
| More Information |

11 Apr 2022 - Global stocks provide clues to accelerating inflation
|
Global stocks provide clues to accelerating inflation Janus Henderson Investors April 2022 Key Takeaways
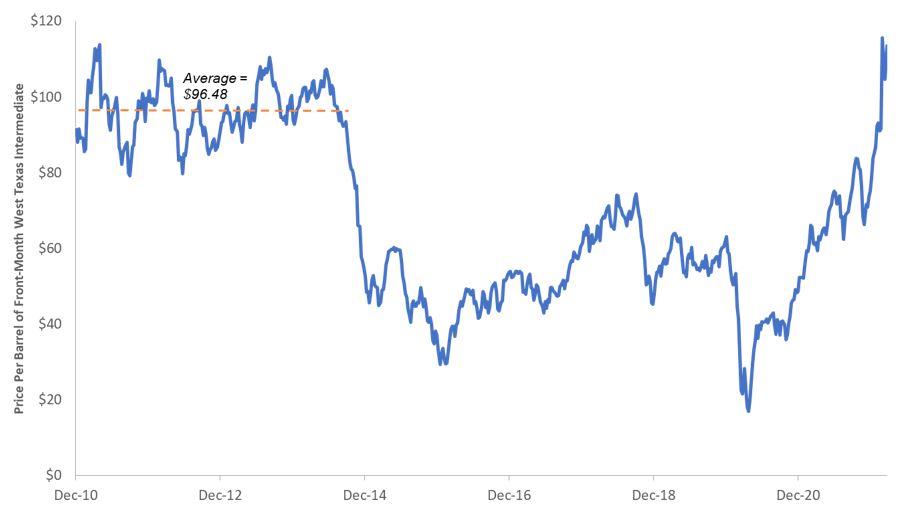
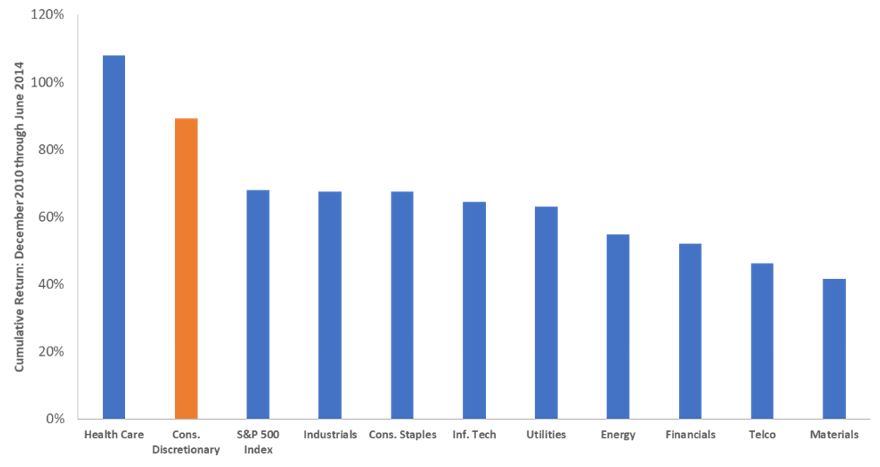
Accelerating inflation has rightly caught the attention of policy makers and investors alike. Expectations that rising prices would cool during the latter half of 2021 proved misplaced as annual US inflation, as measured by the Consumer Price Index, rose 7.9% in February. The core reading, which strips out volatile food and energy, climbed 6.4%. Both are multi-decade highs. The risk that a rapid rise in prices poses to the US - and global - economy is perhaps best illustrated by how quickly the Federal Reserve (Fed) has pivoted toward overtly hawkish policy, with the US central bank now forecasting the equivalent of seven 25 basis point (bps) rate hikes this year. The blunt instrument of higher policy rates is not the only factor that gets a vote in the future trajectory of prices. An economic maxim is 'the cure for higher prices is higher prices'. In more conventional parlance, economists refer to this phenomenon as demand destruction, the notion that prices can rise by such a degree that consumer behaviour is altered, thus removing a catalyst for any additional step up in inflation. A contemporaneous Google search will show that demand destruction is top of mind for market participants these days, especially with respect to the jarring rise in energy prices. An anecdotal gauge for measuring the potential for demand destruction is signals from equity markets. Not only do investors vote with their sell orders on sectors that may be at risk of slowing earnings growth, but also some management teams revise forward guidance based on their expectations for customers' tolerance of higher prices. What are these signals presently telling us about the possibility of pinched consumers cutting back on purchases? They have not reached that point - yet. While acknowledging that inflation has already entered consumers' psyches, several factors lead us to believe that prices still have some room to run before shoppers' behaviour is altered to the degree that it itself becomes a headwind to growth. Household balance sheets remain strong, and historical precedent indicates that current prices at the pump and other rapidly rising costs can be tolerated - albeit begrudgingly - by consumers. Still, the degree to which prices have risen and the fact that two-thirds of US economic activity is based on consumption means the situation merits monitoring, especially given the glaring inaccuracy of recent inflation forecasts. Make up your mindConventional wisdom was that early 2021 inflationary pressure was due to the low base effects of 2020 lockdowns and would eventually roll off. More recently, the pandemic has also been cited as the cause of inflation due to supply disruptions in key industrial inputs - among them semiconductors and labour. Possibly hoping to be forgotten by policymakers has been the material effects of $4.8 trillion of liquidity that the Fed has injected into the economy since the onset of the pandemic. While extraordinary support was merited during the depth of economic lockdowns, we were concerned that the magnitude of this stimulus would result in the unintended consequence of inflation and that the lagging nature - typically over a year - of these initiatives would mean attempts to rein in accelerating prices would prove a day late and more than a dollar short. All these inflationary ingredients were present even before Russia's incursion into Ukraine sent prices on certain energy and materials products on a near vertical trajectory. Regardless of the cause, elevated inflation is here, and it is up to equities investors to figure out how to navigate this environment. Coincidentally, data on both the sector and individual company level can provide important clues about how inflation is evolving and how consumers are reacting to these developments. A likely suspectEnergy prices' contribution to inflation cannot be ignored. They rose 25.6% compared to February 2021 and are a main driver of overall inflationary pressure. How much more consumers can bear elevated energy costs depends upon both their duration and the degree to which they keep climbing. With respect to duration, the absence of Russian products in global markets does not bode well. When reviewing company-level plans for capital expenditure, there are virtually no short-cycle projects that can be quickly brought online to meet existing demand. Consumers have weathered worse without being compelled to alter consumption patterns. Energy consumption in the US tends to be inelastic, meaning consumers are relatively insensitive to rising prices. Between 2011 and the July 2014, crude as measured by West Texas Intermediate, averaged nearly $100 per barrel. If consumers had felt the need to compensate for higher gasoline prices by scrimping elsewhere, the most likely target would have been discretionary purchases. Yet during this period, the consumer discretionary sector outperformed the broader S&P 500® Index and was the stock market's second-best-performing sector. Price per barrel of West Texas Intermediate Crude
Source: Bloomberg, as of 25 March 2022. Cumulative total return by S&P 500 sector: January 2011-June 2014
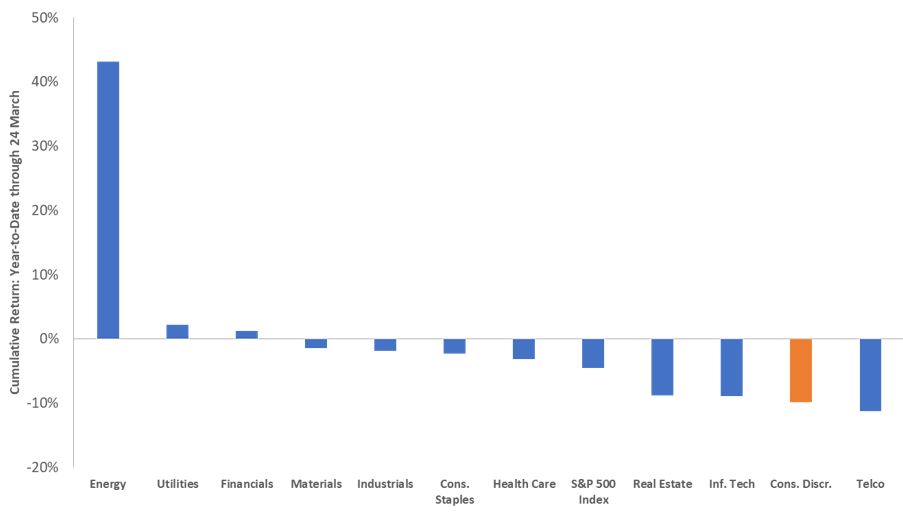
Cumulative total return by S&P 500 sector: year-to-date 2022
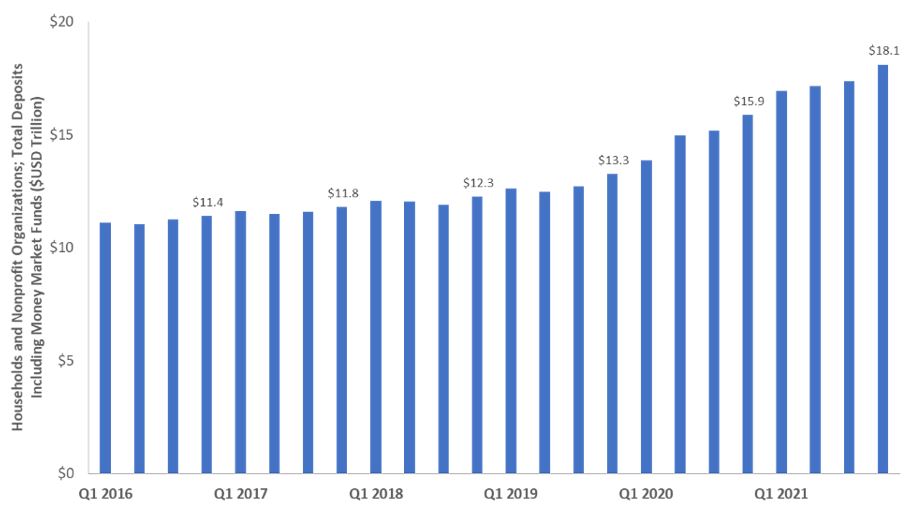
Although the ultimate duration of this period of elevated energy prices remains unknown, prices for crude and refined products are lower than the 2011-2014 period in real (inflation-adjusted) terms. Looking forward, there is no magic number as to when demand destruction kicks in. Often mentioned are $150 per barrel of crude and a $5.00 national average at the pump. The reality is, however, that prices are drifting higher and at some point, consumers may be forced to prioritise expenditures. Exacerbating the situation is that lower-income households will be most acutely affected by sustained higher energy prices as a greater percentage of their monthly outlays are allocated toward energy. A similar dynamic is facing emerging market consumers. In Europe, households and businesses are receiving a secondary gut punch in the form of higher utility costs given their greater reliance upon Russian energy exports. The takeaway for investors is that discretionary sectors that cater to these cohorts may be most exposed to forced changes in consumer behaviour. In a sign that energy demand remains steady, the margins - or cracks - for refiners between their crude input costs and the revenues derived from end products have thus far held up. Should demand falter, we would expect to see refiner margins narrow. Rainy day fundsAnother factor that leads us to believe that the economy is not yet at risk of seeing a curtailment in consumption is the robust health of household finances. Although consumers' monthly savings rates have recently slid as the most generous period of fiscal stimulus is behind us, the cumulative effects of these extraordinary programs have left consumer balance sheets at historic levels. As of the fourth quarter 2021, cumulative household savings have reached a record $18 trillion. This cushion has, thus far, enabled households to weather the current bout of inflation. Household and nonprofits' savings
An indicator that peak stimulus has passed is the recent deceleration of retail sales in an array of categories. To compensate for the upheaval caused by pandemic-related shutdowns, we looked at two-year growth rates to gauge which segments have experienced the most deceleration. As of December, this rate for retail sales ex automobiles and gasoline was 18.9%, well below November's 22.6%. There is some noise in these data, as holiday purchases were likely pulled forward to the October/November period, thus meaning the post-holiday figures may have only fallen back to longer-term trends. Furthermore, there are only so many things consumers can buy, and we are not alone in believing that at some point, purchases will shift from the goods that buoyed retail over the past two years toward services such as travel and entertainment. Any potential dip in sales of goods over the next few months may reflect, in part, this transition rather than solely alarmed consumers snapping their wallets shut. Two-year US retail sales growth rates
Still, some retail data points flash signs of caution. Deceleration has been particularly notable in department stores, electronics and appliance stores and non-store retailers. The path does not appear any easier as the hurdle - as measured by two-year comparables - for upcoming months is considerably higher across many retail segments in contrast to those of last autumn. A canary in the coal mineTo-be-determined is whether the sequential slowdown in these categories is the result of pulled-forward purchases or inflation beginning to bite. Should the latter be what's unfolding, one would expect consumers to first cut back on nonessential purchases. And this is largely how the market is interpreting it. Year-to-date, through March 24, the consumer discretionary sector has returned -9.8%, well below the -6.0% of the S&P 500 Index. Yet, we believe it is too early to draw firm conclusions that lower prospects for discretionary stocks are directly tied to rising inflation. Other contributing factors are also likely at play. Entering the year, the sector's forward price-earnings (P/E) ratio sat well above its long-term average and was exposed to the risk of multiple compression in the face of rising interest rates (its full-year P/E ratio fell by as much as 24% before slightly rebounding). Also, categories that include goods might see earnings and multiple pressure, although that may be offset, to a degree, by strength in experiences-related sectors. The takeaway for investors is that a cocktail of inflation, rising rates and multiple compression represents a risk to consumer-related stocks - and equities markets more broadly - until the ultimate cadence and ending point of monetary tightening are established. As previously stated, in the 2011 through mid-2014 period of high oil prices, consumer discretionary was the second-best-performing sector. There have been periods of inflation-induced demand destruction, namely the late 1970s and the years preceding the Global Financial Crisis, but notably, consumers' finances were nowhere near as healthy as they are at present and the US economy was substantially more energy intensive, meaning consumers and businesses were much more vulnerable to an uptick in oil prices. Based on our conversations with management teams, we have been able to tease out some potential risks and opportunities within the retail sector, should inflation remain elevated. Given the ability of higher-income consumers to absorb elevated food and energy prices, we believe that companies catering to this market segment are better positioned to sustain margins. The same holds true for companies with pricing power, meaning they can pass along higher input costs to customers. We are more circumspect on companies exposed to low-end wage inflation. Physical retailers already face staffing challenges, and absent any meaningful growth in the labour force, we foresee the bidding war for workers to continue. Part and parcel with stimulus checks is the pulling forward of certain purchases. Retailers focusing on durable goods such as appliances, as well as other home-centric categories, may be vulnerable to revenue air pockets caused by this phenomenon. Lastly, higher transportation costs have the potential to exacerbate lingering supply chain disruptions as retailers have come to rely upon higher priced alternatives - such as air freight - to get products to market. Should this trend continue, current estimates for discretionary sector operating margins could prove too optimistic. Looking forwardNearly 8% headline inflation has forced the Fed to react. Given the delayed effect of rate hikes - along with still very low levels - the point at which tighter policy begins to constrict growth is likely some ways off. Yet the tempering effects of demand destruction likely remain relatively farther on the horizon as well. An unprecedentedly level of consumer savings will likely enable households to tolerate a relatively extended period of higher prices. The question is how long will this stand. Supply disruptions, wage pressures, fiscal largesse and commodities upheaval have all contributed to the inflationary backdrop. Corralling these forces stands to be tall task and investors should be prepared for how a sustained period of elevated prices will reverberate through equity markets. Consumer Price Index (CPI) is an unmanaged index representing the rate of inflation of the U.S. consumer prices as determined by the U.S. Department of Labor Statistics.
This information is issued by Janus Henderson Investors (Australia) Institutional Funds Management Limited ABN 16 165 119 531, AFSL 444266 (Janus Henderson). The funds referred to within are issued by Janus Henderson Investors (Australia) Funds Management Limited ABN 43 164 177 244, AFSL 444268. The value of an investment and the income from it can fall as well as rise and you may not get back the amount originally invested. Past performance is not indicative of future performance. Prospective investors should not rely on this information and should make their own enquiries and evaluations they consider to be appropriate to determine the suitability of any investment (including regarding their investment objectives, financial situation, and particular needs) and should seek all necessary financial, legal, tax and investment advice. This information is not intended to be nor should it be construed as advice. This information is not a recommendation to sell or purchase any investment. This information does not purport to be a comprehensive statement or description of any markets or securities referred to within. Any references to individual securities do not constitute a securities recommendation. This information does not form part of any contract for the sale or purchase of any investment. Any investment application will be made solely on the basis of the information contained in the relevant fund's PDS (including all relevant covering documents), which may contain investment restrictions. This information is intended as a summary only and (if applicable) potential investors must read the relevant fund's PDS before investing available at www.janushenderson.com/australia. Target Market Determinations for funds issued by Janus Henderson Investors (Australia) Funds Management Limited are available here: www.janushenderson.com/TMD. Whilst Janus Henderson believe that the information is correct at the date of this document, no warranty or representation is given to this effect and no responsibility can be accepted by Janus Henderson to any end users for any action taken on the basis of this information. All opinions and estimates in this information are subject to change without notice and are the views of the author at the time of publication. Janus Henderson is not under any obligation to update this information to the extent that it is or becomes out of date or incorrect. |
|
Funds operated by this manager: Janus Henderson Australian Fixed Interest Fund, Janus Henderson Australian Fixed Interest Fund - Institutional, Janus Henderson Cash Fund - Institutional, Janus Henderson Conservative Fixed Interest Fund, Janus Henderson Conservative Fixed Interest Fund - Institutional, Janus Henderson Diversified Credit Fund, Janus Henderson Global Equity Income Fund, Janus Henderson Global Multi-Strategy Fund, Janus Henderson Global Natural Resources Fund, Janus Henderson Tactical Income Fund |
 Source: Bloomberg, as of 25 March 2022.
 Source: Bloomberg
 Source: Federal Reserve, as of 31 December 2022.
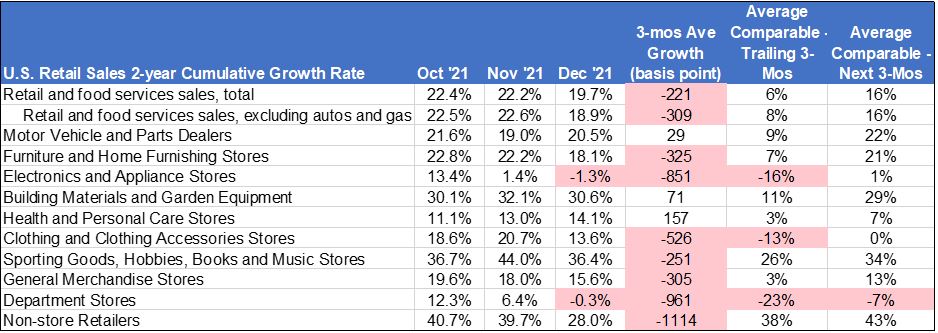 Source: U.S. Census Bureau, as of 31 December 2022.
8 Apr 2022 - Hedge Clippings |08 April 2022
|
|
|
|
Hedge Clippings | Friday, 08 April 2022
The longer the war in Ukraine continues, so the stakes are rising. Initially expected to be a quick and easy victory, six weeks later it seems an early resolution is unlikely. The Ukrainian's brave, gritty and effective defense, and the Russian's misguided tactics and leadership, have been a revelation to most, as have the horrors of war as Russian atrocities come to light. While the Ukrainians are fighting for their country and their lives, their allies and supporters cannot afford to let them lose. Meanwhile Putin, having miscalculated badly, also can't afford - or at least be seen - to lose. Presumably his face-saving solution is a partial win by occupying and annexing Donetsk and Luhansk (now claimed to be the original intention) to add to Crimea, which was previously annexed in 2014. Even if Russia prevails and actually wins the war, Ukrainians are unlikely to simply submit. A military win would merely be the start of a long, bloody and painful occupation of Ukraine, until the occupying Russian forces eventually withdrew, as they previously did after almost 10 years in Afghanistan. Even in that circumstance, we assume that Europe, the US, and the rest of the civilised countries of the world would continue to isolate Russia economically and culturally. A "partial" victory - even assuming it came to pass - might help to save face for Putin, but whatever the outcome, it is unlikely to end the economic sanctions currently and increasingly being imposed on Russia and its economy. If anything, one assumes (or hopes) the pressure will increase. The problem is that those same sanctions are in turn impacting the nations imposing them, particularly in Europe where they're paying the price for their dependence on Russian energy and resources. In the meantime, Australia's resources sector has been a beneficiary, as evidenced by March returns from funds with appropriate exposure such as Paragon (+23.69%) and Argonaut (+11.6%). Meanwhile the global economy, already facing headwinds from inflation, increasing interest rates, and a potential slow down in China, leads us to ponder the chances of a global recession, and ask the question: "Are equity markets appropriately pricing in the risk?" News & Insights New Funds on FundMonitors.com Quarterly Update & Outlook Webinar (1-Apr) | Laureola Advisors 10k Words - March Edition | Equitable Investors Volatility, Uncertainty, and War | Laureola Advisors Another era of quantitative tightening beckons | Magellan Asset Management |
|
|
March 2022 Performance News AIM Global High Conviction Fund Argonaut Natural Resources Fund Bennelong Kardinia Absolute Return Fund |
|
|
If you'd like to receive Hedge Clippings direct to your inbox each Friday
|

8 Apr 2022 - Performance Report: Argonaut Natural Resources Fund
| Report Date | |
| Manager | |
| Fund Name | |
| Strategy | |
| Latest Return Date | |
| Latest Return | |
| Latest 6 Months | |
| Latest 12 Months | |
| Latest 24 Months (pa) | |
| Annualised Since Inception | |
| Inception Date | |
| FUM (millions) | |
| Fund Overview | At times, ANRF may consider holding higher levels of cash (max 30%) if valuations are full and it is difficult to find attractive investment opportunities. The Fund does not borrow for investment or any other purposes, but it may short sell securities as part of its portfolio protection strategies. |
| Manager Comments | The Argonaut Natural Resources Fund has a track record of 2 years and 3 months and therefore comparison over all market conditions and against its peers is limited. However, the fund has outperformed the ASX 200 Total Return Index since inception in January 2020, providing investors with an annualised return of 61.35% compared with the index's return of 9.06% over the same period. On a calendar year basis, the fund hasn't experienced any negative annual returns in the 2 years and 3 months since its inception. Over the past 12 months, the fund's largest drawdown was -3.38% vs the index's -6.35%, and since inception in January 2020 the fund's largest drawdown was -14.61% vs the index's maximum drawdown over the same period of -26.75%. The fund's maximum drawdown began in February 2020 and lasted 3 months, reaching its lowest point during March 2020. The fund had completely recovered its losses by May 2020. The Manager has delivered these returns with 1.4% more volatility than the index, contributing to a Sharpe ratio for performance over the past 12 months of 4.57 and for performance since inception of 2.41. The fund has provided positive monthly returns 80% of the time in rising markets and 57% of the time during periods of market decline, contributing to an up-capture ratio since inception of 201% and a down-capture ratio of -16%. |
| More Information |

8 Apr 2022 - The French presidential election
|
The French presidential election abrdn April 2022 It's election time in France, as the nation heads to the polls on 10 April. There will then be a runoff between the top two candidates on 24 April. So, how do we think the election will play out? And what could it mean for investors? A quick recap Unlike other European states, the French president is the main figure in the nation's political system. He/she holds executive and legislative powers, including the appointment of a prime minister that reflects the parliamentary majority. The president therefore drives the policymaking agenda. He/she is also the head of national defence and diplomacy. Where do we stand? Ahead of April's vote, President Macron enjoyed a comfortable lead in both the first- and second-round polls. His handling of the Russia-Ukraine crisis has bolstered his standing in the eyes of many voters. Further, the 2022 elections are taking place against a very different economic and political backdrop than previous campaigns. France has experienced one of the strongest recoveries from the Covid-19 pandemic and is no longer regarded as one of the 'sick men' of Europe. Angela Merkel's retirement has left Macron as Europe's senior statesperson. As a result, he enjoys stronger support at this stage of the campaign than his two predecessors. Nonetheless, support for populist candidates is once again robust. Veteran far-right leader Marine Le Pen remains Macron's main challenger. Her Euroscepticism has moderated since 2017 as she attempts to appeal to the political centre. Le Pen's tone is less incendiary than in previous campaigns. Meanwhile, higher inflation is eroding workers' purchasing power. She and others are evoking the spectre of 'green inflation' to scare-up votes. This is putting the efficacy of France's climate strategy at the heart of the electoral debate. That said, the political spectrum is more fragmented than ever. The candidacy of Eric Zemmour could potentially fracture the far-right vote. As a candidate, he combines controversial stances on immigration with liberal (but vague) economic policies. Unlike Le Pen, he seems to recognise the unsustainability of the French pension system. At the same time, he is even keener to pick a fight with the EU on legal sovereignty. At the opposite end of the political spectrum, Jean-Luc Mélenchon represents a different type of economic danger. As an avowed socialist, he wants to increase tax on overtime work, raise marginal tax rates and re-regulate labour markets. Each of these would undermine progress to improve the competitiveness of the French economy. Nonetheless, Mélenchon's campaign has picked up considerable momentum in recent weeks. The result - a market perspective In the event France elects a far-right candidate, assets would likely come under pressure. We would expect to see a widening of French sovereign bond spreads and underperformance of domestically-oriented French equity and credit securities. However, given populists' retreat from hardline Eurosceptic views, the fallout would likely be less extreme than if it had occurred in 2017, or what we saw after the 2018 Italian elections. The largest risk is less the outright victory of an extreme candidate, but rather a more fragmented parliament following regional elections in June. A second-term centrist government is likely to have to compromise with parties of both the left and right over economic, energy, and European policy. This has the potential to lead to policy stasis. By contrast, markets would welcome the re-election of Macron. His victory would imply policy continuity and further progress on the reform agenda. We could possibly see further EU integration and a renewed attempt to tackle pension reforms. Further, Macron is an advocate for more investment in green and nuclear technologies. However, he will be wary of raising fuel or carbon taxes for fear of reviving the Gilets Jaunes movement. Pension reform will be the hardest issue to tackle. Macron wants to increase the retirement age from 62 to 65. Many will find that hard to swallow. It could also revive the social tensions that plagued the first years of his presidency. The largest risk is less the outright win of an extreme candidate, but rather a more fragmented parliament following regional elections in June. Who will win? At the time of writing, Macron remained in the driving seat. By our numbers, he will likely face Le Pen in the second round of voting, despite Mélenchon's recent surge. Thereafter, we expect Macron will retain the presidency, albeit on a tighter margin than we thought a month ago. Indeed, two polls published on 28 March showed Le Pen narrowing the gap by three points. If they faced each other in the final round, an Ifop-Fiducial group indicated Macron would win by just 53% versus Len Pen's 47%. One potential risk to this scenario is historically low voter turnout following a race overshadowed by the Russia-Ukraine crisis. That said, there's little consensus as to which candidates would suffer most from more voters staying at home. All in all, it promises to be an interesting week ahead. We'll bring you our latest analysis once the final votes are counted. Author: Alexandra Popa, Macro ESG Research, Abrdn Research Institute |
|
Funds operated by this manager: Aberdeen Standard Actively Hedged International Equities Fund, Aberdeen Standard Asian Opportunities Fund, Aberdeen Standard Australian Small Companies Fund, Aberdeen Standard Emerging Opportunities Fund, Aberdeen Standard Ex-20 Australian Equities Fund (Class A), Aberdeen Standard Focused Sustainable Australian Equity Fund, Aberdeen Standard Fully Hedged International Equities Fund, Aberdeen Standard Global Absolute Return Strategies Fund, Aberdeen Standard Global Corporate Bond Fund, Aberdeen Standard International Equity Fund , Aberdeen Standard Life Absolute Return Global Bond Strategies Fund, Aberdeen Standard Multi Asset Real Return Fund, Aberdeen Standard Multi-Asset Income Fund |
7 Apr 2022 - Performance Report: AIM Global High Conviction Fund
| Report Date | |
| Manager | |
| Fund Name | |
| Strategy | |
| Latest Return Date | |
| Latest Return | |
| Latest 6 Months | |
| Latest 12 Months | |
| Latest 24 Months (pa) | |
| Annualised Since Inception | |
| Inception Date | |
| FUM (millions) | |
| Fund Overview | AIM are 'business-first' rather than 'security-first' investors, and see themselves as part owners of the businesses they invest in. AIM look for the following characteristics in the businesses they want to own: - Strong competitive advantages that enable consistently high returns on capital throughout an economic cycle, combined with the ability to reinvest surplus capital at high marginal returns. - A proven ability to generate and grow cash flows, rather than accounting based earnings. - A strong balance sheet and sensible capital structure to reduce the risk of failure when the economic cycle ends or an unexpected crisis occurs. - Honest and shareholder-aligned management teams that understand the principles behind value creation and have a proven track record of capital allocation. They look to buy businesses that meet these criteria at attractive valuations, and then intend to hold them for long periods of time. AIM intend to own between 15 and 25 businesses at any given point. They do not seek to generate returns by constantly having to trade in and out of businesses. Instead, they believe the Fund's long-term return will approximate the underlying economics of the businesses they own. They are bottom-up, fundamental investors. They are cognizant of macro-economic conditions and geo-political risks, however, they do not construct the Fund to take advantage of such events. AIM intend for the portfolio to be between 90% and 100% invested in equities. AIM do not engage in shorting, nor do they use leverage to enhance returns. The Fund's investable universe is global, and AIM look for businesses that have a market capitalisation of at least $7.5bn to guarantee sufficient liquidity to investors. |
| Manager Comments | The AIM Global High Conviction Fund has a track record of 2 years and 9 months and therefore comparison over all market conditions and against its peers is limited. However, the fund has outperformed the Global Equity Index since inception in July 2019, providing investors with an annualised return of 13.23% compared with the index's return of 10.89% over the same period. On a calendar year basis, the fund hasn't experienced any negative annual returns in the 2 years and 9 months since its inception. Over the past 12 months, the fund's largest drawdown was -11.11% vs the index's -8.41%, and since inception in July 2019 the fund's largest drawdown was -11.11% vs the index's maximum drawdown over the same period of -13.19%. The fund's maximum drawdown began in January 2022 and has lasted 2 months, reaching its lowest point during March 2022. During this period, the index's maximum drawdown was -8.41%. The Manager has delivered these returns with 0.67% more volatility than the index, contributing to a Sharpe ratio for performance over the past 12 months of 1 and for performance since inception of 1.1. The fund has provided positive monthly returns 90% of the time in rising markets and 0% of the time during periods of market decline, contributing to an up-capture ratio since inception of 112% and a down-capture ratio of 98%. |
| More Information |

7 Apr 2022 - The Rise of the Contactless Economy
|
The Rise of the Contactless Economy Insync Fund Managers March 2022 Fingertip readers and facial recognition used to be something we only saw in Hollywood movies, now they are staples in our economy. The way we purchase has dramatically adjusted to the new normal. Covid-19 has created an unprecedented global change in how we pay for things. There has been a profound and permanent change in behaviour in Australia and many parts of the world. Payment apps are easy to use, they offer improved security and the work from home offers balance, since Covid means more time to browse from home via laptops and phones.
Insync's Portfolio Manager, John Lobb tells us more on the The Rise of the Contactless Economy Megatrend: Funds operated by this manager: Insync Global Capital Aware Fund, Insync Global Quality Equity Fund |

7 Apr 2022 - Anna Hong: Debt, disruption and demographics determine where bonds go next
|
Anna Hong: Debt, disruption and demographics determine where bonds go next Pendal 25 March 2022 |
|
AUSTRALIAN 10-year bonds yields are at a four-year high. Where will they go from here? To answer that we need to ask another question: what level of interest rates can the Australian economy withstand? We think a neutral cash rate of 1.5% to 2% is bearable. But 3% will be an overshoot that strains the Australian economy. Under those conditions, the Australian Government 10-year bond yield becomes interesting at current levels around 2.75%. Why? Because the global trajectory of three key factors — debt, disruption and demographics — hasn't changed despite recent events, especially in developed economies. DemographicsEven though headline population growth is positive, it's largely driven by net migration which has been impacted by Covid. Australia's fertility rate is below the replacement rate and life expectancy is on the rise. This means we have an ageing population. Adding higher interest rates to that mix will significantly impact GDP growth.
Disruption Technology has transformed every facet of our lives and it's not about to stop. With continued technological progress we can expect goods prices to move downwards as we reap the rewards of manufacturing and logistical efficiencies. (Once the current supply-shock eases of course.) This means that while inflation is a now-problem, it will not be a long-run issue which central banks need to tackle with never-ending rate hikes. DebtFinally, consider the debt overhang. As a nation we continue to indulge in our favourite activity - buying property. The Australian household debt picture is nuanced, however. We're one of the most indebted nations in the world, but we're also rather good at things like pre-payment, so we can get ahead of the debt mountain. This pragmatism will lead to many households tweaking spending decisions as interest rates rise. At a time when disposable income has already been hit by oil prices, the RBA will be cautious about adding further strain. The dynamics of Debt, Disruption, Demographics means that the most probable outcome is a neutral cash rate of around 2%. Rates higher than that will lead to curtailing of GDP growth, straining the Australian economy. This may be welcomed in restraining inflation in the near-term but not in the medium-term. Portfolio ImplicationsWith current Australian Government (ACGB) 10-year bond yields at 2.75%, aggressive rate hikes are almost fully priced in. Cash sitting on the sidelines will find value here as the Reserve Bank continues to delay rate hikes. Economists' consensus has the first hike occurring in August — therefore investors may need to wait until late 2023 for cash returns to exceed 1.5%. The risk versus reward makes this an attractive option for balanced portfolios. Bonds are still a defensive instrument, given forward uncertainties, especially in the geopolitical space. Investors will need them in their portfolios. Any investor currently underweight bonds should be looking to get back to neutral. We think the next three-to-six months may bring levels which are attractive for investors looking to go overweight bonds. Written By Anna Hong, Assistant Portfolio Manager |
|
Funds operated by this manager: Pendal Total Return Fund |
|
This information has been prepared by Pendal Fund Services Limited (PFSL) ABN 13 161 249 332, AFSL No 431426 and is current as at December 8, 2021. PFSL is the responsible entity and issuer of units in the Pendal Multi-Asset Target Return Fund (Fund) ARSN: 623 987 968. A product disclosure statement (PDS) is available for the Fund and can be obtained by calling 1300 346 821 or visiting www.pendalgroup.com. The Target Market Determination (TMD) for the Fund is available at www.pendalgroup.com/ddo. You should obtain and consider the PDS and the TMD before deciding whether to acquire, continue to hold or dispose of units in the Fund. An investment in the Fund or any of the funds referred to in this web page is subject to investment risk, including possible delays in repayment of withdrawal proceeds and loss of income and principal invested. This information is for general purposes only, should not be considered as a comprehensive statement on any matter and should not be relied upon as such. It has been prepared without taking into account any recipient's personal objectives, financial situation or needs. Because of this, recipients should, before acting on this information, consider its appropriateness having regard to their individual objectives, financial situation and needs. This information is not to be regarded as a securities recommendation. The information may contain material provided by third parties, is given in good faith and has been derived from sources believed to be accurate as at its issue date. While such material is published with necessary permission, and while all reasonable care has been taken to ensure that the information is complete and correct, to the maximum extent permitted by law neither PFSL nor any company in the Pendal group accepts any responsibility or liability for the accuracy or completeness of this information. Performance figures are calculated in accordance with the Financial Services Council (FSC) standards. Performance data (post-fee) assumes reinvestment of distributions and is calculated using exit prices, net of management costs. Performance data (pre-fee) is calculated by adding back management costs to the post-fee performance. Past performance is not a reliable indicator of future performance. Any projections are predictive only and should not be relied upon when making an investment decision or recommendation. Whilst we have used every effort to ensure that the assumptions on which the projections are based are reasonable, the projections may be based on incorrect assumptions or may not take into account known or unknown risks and uncertainties. The actual results may differ materially from these projections. For more information, please call Customer Relations on 1300 346 821 8am to 6pm (Sydney time) or visit our website www.pendalgroup.com |


6 Apr 2022 - Paragon - Quarterly Update & Outlook Webinar (1-Apr)
|
Webinar recording: Quarterly Update & Outlook Webinar (1-Apr)
|
