NEWS

18 May 2022 - The forgotten asset class set to outperform in 2022
|
The forgotten asset class set to outperform in 2022 Yarra Capital Management 05 May 2022
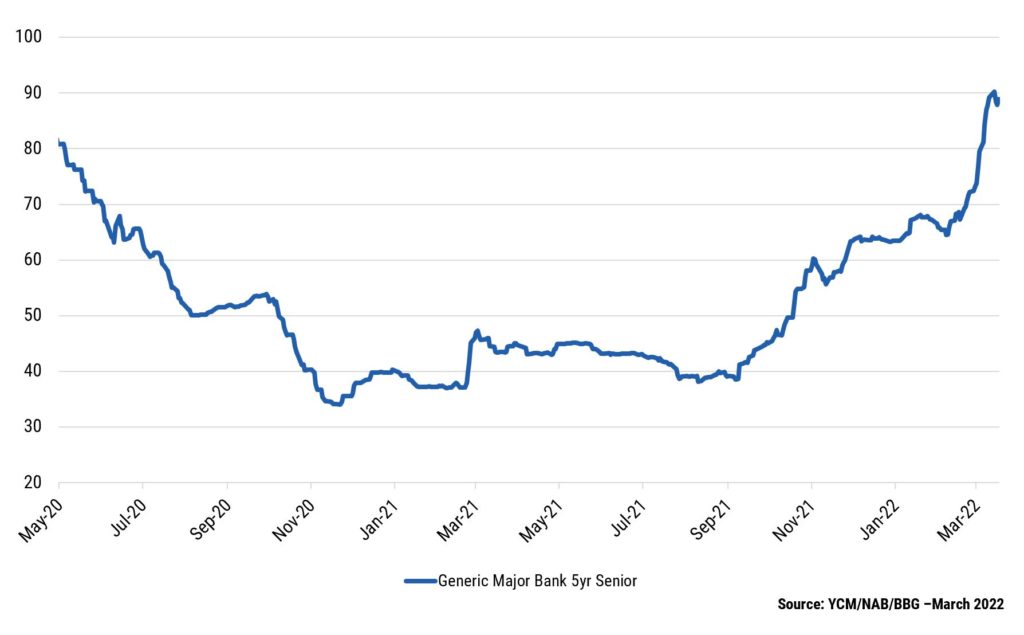
Against a backdrop of economic and geopolitical uncertainty, rising inflation and rate hikes, Australian investors are searching for investments that can benefit from these evolving market conditions. With credit spreads at attractive levels, now might be the opportune time to have exposure to hybrids and credit. With minimal returns on cash continuing to underpin strong demand for hybrid securities, we anticipate demand for yield to remain robust throughout 2022, resulting in strong returns over the year for this asset class. The upside of rising interest ratesRising inflation, above average GDP growth and the unwinding of quantitative easing (QE) in 2022 has seen financial markets reprice interest rate expectations. The rising rate environment will push the outright return on hybrid securities higher, without having a material impact on spreads given the strong economic backdrop. Given most hybrids are floating rate, investors will benefit via higher income from these rising short-term rates. Strong balance sheets you can bank onAustralian banks are the largest issuers of hybrids domestically and their balance sheets are in fantastic shape, with capital ratios at historical high levels. COVID-19 provided Australian banks with access to cheap funding via the Term Funding Facility (TFF), which provided them with a degree of funding certainty and lower funding costs. Following the withdrawal of the TFF in 2021, new bank issuance is coming to market at attractive credit margins, providing the ideal environment for active credit managers to identify the most positive risk adjusted opportunities. For instance, bank senior credit margins are significantly off their TFF lows, which is leading to an attractive re-pricing across all bank capital issuance (refer to Chart 1). Overvalued growth sectors are likely to lead an equity market sell off similar to 2000 - 02, but are unlikely to impact credit market returns. Chart 1: Bank senior credit margins - Well-Off their TFF 2021 lows
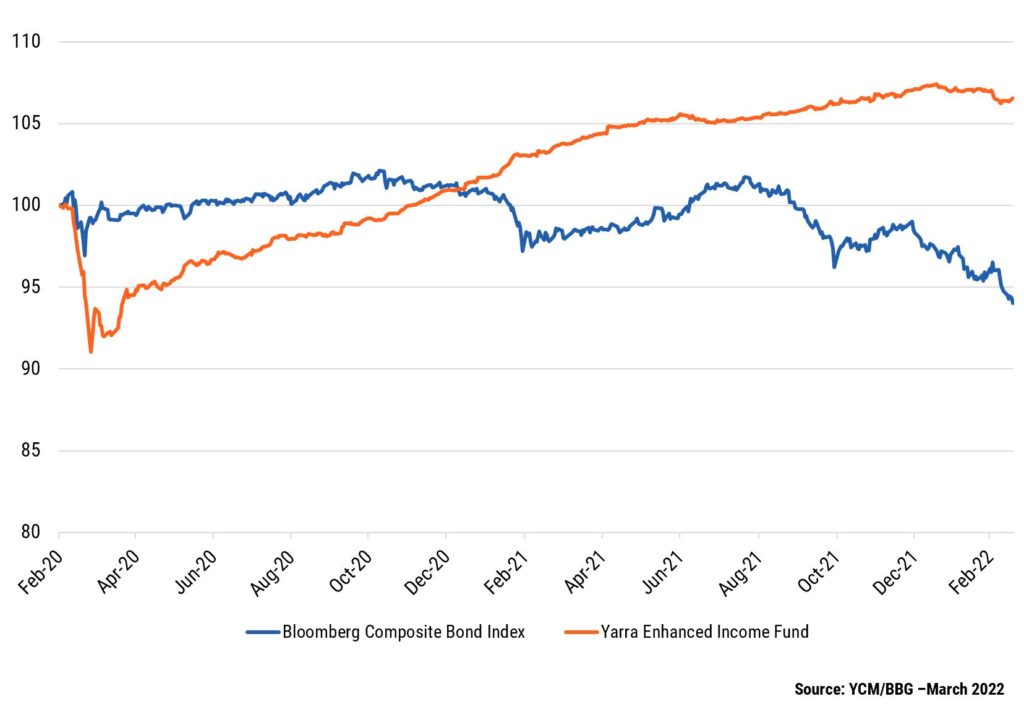
The higher the carry (running yield of an investment), the greater the protection it offers investors from adverse movements in credit margins. The carry for the Yarra Enhanced Income Fund is currently sitting at ~3.0% above cash. Based on an average portfolio maturity of ~3 years, we'd need to see an extreme 1.0% move wider in credit margins to wipe-out the carry. However, given the robust economic backdrop in 2022, we expect credit margins to remain relatively stable throughout, adding to floating rate credit's income generating credentials. This benign outlook is in contrast to the capital losses currently being observed in traditional fixed income due to the reset in interest rates and real yields. Usually, a rise in real yields will impact the value of everything long interest rate duration, from traditional fixed income to most equities. That's not the case with floating rate credit, since its short duration offers protection to portfolio valuations from rising interest rates. This is observable in EIF's outperformance compared to traditional fixed income (Bloomberg Composite Index) since February 2020 (see Chart 2). Chart 2: Floating rate credit with carry continues to outperform fixed rate with little carry
Making the gradeIn a world that seems to be getting riskier by the minute, investment grade hybrids look to be a safe haven for investors. Here's why:
Getting exposure to hybrids and creditBeing able to access fixed rate securities for floating rate portfolios remains a key competitive advantage for Yarra's clients. The Yarra Enhanced Income Fund invests in high yielding, floating rate credit and hybrid securities to deliver better returns than traditional cash management and fixed income investments. |
|
Funds operated by this manager: Yarra Australian Equities Fund, Yarra Emerging Leaders Fund, Yarra Enhanced Income Fund, Yarra Income Plus Fund |


17 May 2022 - Performance Report: Glenmore Australian Equities Fund
| Report Date | |
| Manager | |
| Fund Name | |
| Strategy | |
| Latest Return Date | |
| Latest Return | |
| Latest 6 Months | |
| Latest 12 Months | |
| Latest 24 Months (pa) | |
| Annualised Since Inception | |
| Inception Date | |
| FUM (millions) | |
| Fund Overview | The main driver of identifying potential investments will be bottom up company analysis, however macro-economic conditions will be considered as part of the investment thesis for each stock. |
| Manager Comments | The Glenmore Australian Equities Fund has a track record of 4 years and 11 months and therefore comparison over all market conditions and against its peers is limited. However, the fund has outperformed the ASX 200 Total Return Index since inception in June 2017, providing investors with an annualised return of 25.4% compared with the index's return of 9.58% over the same period. On a calendar year basis, the fund hasn't experienced any negative annual returns in the 4 years and 11 months since its inception. Over the past 12 months, the fund's largest drawdown was -8.65% vs the index's -6.35%, and since inception in June 2017 the fund's largest drawdown was -36.91% vs the index's maximum drawdown over the same period of -26.75%. The fund's maximum drawdown began in October 2019 and lasted 1 year and 1 month, reaching its lowest point during March 2020. The fund had completely recovered its losses by November 2020. The Manager has delivered these returns with 7.18% more volatility than the index, contributing to a Sharpe ratio which has only fallen below 1 once over the past four years and which currently sits at 1.13 since inception. The fund has provided positive monthly returns 90% of the time in rising markets and 42% of the time during periods of market decline, contributing to an up-capture ratio since inception of 232% and a down-capture ratio of 96%. |
| More Information |

17 May 2022 - Performance Report: Insync Global Capital Aware Fund
| Report Date | |
| Manager | |
| Fund Name | |
| Strategy | |
| Latest Return Date | |
| Latest Return | |
| Latest 6 Months | |
| Latest 12 Months | |
| Latest 24 Months (pa) | |
| Annualised Since Inception | |
| Inception Date | |
| FUM (millions) | |
| Fund Overview | Insync invests in a concentrated portfolio of high quality companies that possess long 'runways' of future growth benefitting from Megatrends. Megatrends are multiyear structural and disruptive changes that transform the way we live our daily lives and result from a convergence of different underlying trends including innovation, politics, demographics, social attitudes and lifestyles. They provide important tailwinds to individual stocks and sectors, that reside within them. Insync believe this delivers exponential earnings growth ahead of market expectations. The fund uses Put Options to help buffer the depth and duration that sharp, severe negative market impacts would otherwide have on the value of the fund during these events. Insync screens the universe of 40,000 listed global companies to just 150 that it views as superior. This includes profitability, balance sheet performance, shareholder focus and valuations. 20-40 companies are then chosen for the portfolio. These reflect the best outcomes from further analysis using a proprietary DCF valuation, implied growth modelling, and free cash flow yield; alongside management, competitor, and industry scrutiny. The Fund may hold some cash (maximum of 5%), derivatives, currency contracts for hedging purposes, and American and/or Global Depository Receipts. It is however, for all intents and purposes, a 'long-only' fund, remaining fully invested irrespective of market cycles. |
| Manager Comments | The Insync Global Capital Aware Fund has a track record of 12 years and 7 months and has underperformed the Global Equity Index since inception in October 2009, providing investors with an annualised return of 10.33% compared with the index's return of 10.9% over the same period. On a calendar year basis, the fund has experienced a negative annual return on 2 occasions in the 12 years and 7 months since its inception. Over the past 12 months, the fund's largest drawdown was -22.2% vs the index's -10.7%, and since inception in October 2009 the fund's largest drawdown was -22.2% vs the index's maximum drawdown over the same period of -13.59%. The fund's maximum drawdown began in January 2022 and has lasted 3 months, reaching its lowest point during April 2022. During this period, the index's maximum drawdown was -10.7%. The Manager has delivered these returns with 0.83% more volatility than the index, contributing to a Sharpe ratio which has fallen below 1 five times over the past five years and which currently sits at 0.75 since inception. The fund has provided positive monthly returns 81% of the time in rising markets and 22% of the time during periods of market decline, contributing to an up-capture ratio since inception of 59% and a down-capture ratio of 80%. |
| More Information |

17 May 2022 - Performance Report: Bennelong Australian Equities Fund
| Report Date | |
| Manager | |
| Fund Name | |
| Strategy | |
| Latest Return Date | |
| Latest Return | |
| Latest 6 Months | |
| Latest 12 Months | |
| Latest 24 Months (pa) | |
| Annualised Since Inception | |
| Inception Date | |
| FUM (millions) | |
| Fund Overview | |
| Manager Comments | The Bennelong Australian Equities Fund has a track record of 13 years and 3 months and has outperformed the ASX 200 Total Return Index since inception in February 2009, providing investors with an annualised return of 13.46% compared with the index's return of 10.37% over the same period. On a calendar year basis, the fund has only experienced a negative annual return once in the 13 years and 3 months since its inception. Over the past 12 months, the fund's largest drawdown was -17.91% vs the index's -6.35%, and since inception in February 2009 the fund's largest drawdown was -24.32% vs the index's maximum drawdown over the same period of -26.75%. The fund's maximum drawdown began in February 2020 and lasted 6 months, reaching its lowest point during March 2020. The fund had completely recovered its losses by August 2020. The Manager has delivered these returns with 1.32% more volatility than the index, contributing to a Sharpe ratio which has fallen below 1 four times over the past five years and which currently sits at 0.79 since inception. The fund has provided positive monthly returns 91% of the time in rising markets and 18% of the time during periods of market decline, contributing to an up-capture ratio since inception of 129% and a down-capture ratio of 97%. |
| More Information |
17 May 2022 - What have rubber bands got to do with successful stock selection?
|
What have rubber bands got to do with successful stock selection? Insync Fund Managers April 2022 Lifting of pandemic restrictions has generated an overly enthusiastic view that economically sensitive companies will rebound quickly across many business sectors. Insync deliberately has no exposure to stocks of this ilk. We favour companies that are not only are some of the most profitable companies in the world but are also expected to consistently grow their earnings at high rates regardless of how the global economy performs. As the earnings growth across our portfolio continues to compound at high-rates, the gap grows ever wider between their stock price and their valuations (currently circa 50%+ below valuations). In these shorter periods of relative underperformance, a tension permeates in markets. This creates ideal conditions for entry as a sudden 'snap-back' in stock prices can occur very quickly. Snap backs are triggered by a change in market conditions, an event or simply the market recognizing the big disparities between the companies promising to deliver to the ones actually delivering. We liken it to an elastic band. The more you stretch it (the widening of the gap between valuation and share price), the greater the likelihood of a rapid 'snap-back'. Whilst it's impossible to time exactly when the snap back will occur, when it does do so, it delivers strong outperformance to those stocks with the real underlying earnings and profits to support a sustainable uptick in their price. At the same time, the reverse occurs for those presently leading this latest bout of exuberant price growth. We like value but we are not value Investors. We recently had an extensive meeting with a fund researcher where we took him through our valuation approach. One of his key conclusions was that Insync is a 'value investor'. Whilst we would not describe ourselves as value investors based on conventional metrics (just buying companies based on low Price/Earnings ratios), an important part of Insync's process includes building a high degree of confidence in understanding the worth of a company's future cashflows beyond its present state. To make money involves finding companies where the value we see is significantly greater than the price we have to pay. The current investor exuberance around chasing returns in hyped up sectors has the Insync portfolio of quality growth companies trading at circa 50% below our assessed valuations. A question to ponder is this..... Would you buy into highly profitable businesses if you could buy them at such a large discount? And after doing all your investigations and crunching the numbers, its forward earnings were compounding strongly. Or would you buy a very richly valued popular business whose forward looking numbers don't support its price but everyone was enthusiastic about it today? This is the choice that investors face and this sets up perfect conditions for the Insync portfolio to deliver strong returns. P.S. Insync is of course categorised as a 'Quality Growth' Investor. Traditional valuation metrics are losing their predictive power. PE (Price/Earnings) and PB (Price/Book) ratios have been declining in their ability to predict value. The main reason is in the "E" part of the P/E ratio. Our modern global economy is increasingly driven by intangible assets. Items such as intellectual property, R&D, brands, and networks. In the last decade or so this has accelerated to dominate in many key industries. In the past capital equipment and other tangible assets used to figure large on balance sheets.
'Intangibles' now represent 84% of the market value of the S&P 500 as depicted above. The old focus supported the old P/E and P/B ratios suitability. The problem occurs when it is applied to this new world - to the industries and companies that invest heavily in intangibles. It creates a misleading and distorted picture.
By example, when Pfizer invests R&D in a new drug for Covid-19 (forecasted to generate sales of US$45.7 Bn this year), or Amazon spending on building their cloud capability (sales of US$60 Bn expected from this division), these investments are classified as intangibles. They have to be expensed through their income statements. This means it significantly depresses their earnings today despite these 'investments of expenditure' creating significant sales and profits for many years to follow. Their resulting P/E and P/B ratios are thus negatively impacted. This is important to remember when investing for the future. Beware of using the rear-view mirror. Life has changed. Fastest decline in history. By way of contrast, old-industry companies, say a steel company, has to invest heavily in property and machinery (tangibles). The accounting rules treat these investments as capital expenditures. It immediately goes onto the balance sheet and does not detract from that year's earnings unlike intangibles. Effectively this inflates its present earnings and the book value. P/E and P/B ratios look good.
This inconsistent treatment of the drivers of future growth between intangibles and tangibles leads to wrong conclusions on what actually represents good value and what does not. P/Es are thus not a useful indictor for industries with high intangibles, and even more misleading if taking an average across a broad index. Conventional portfolio blending methods. Many research houses lump funds managers into simplified groupings primarily based on P/E ratios. Growth managers tend to be holding businesses with higher than market average P/E or P/B ratios. Value managers holding a portfolio of low P/E ratios, and GARP or Core managers somewhere in-between. Not only is this old measure being over-used to compare managers in the same group, it is further adapted as the primary means of blending managers across entire client portfolios and investment models. People tend towards simplicity even if its misleading. Given the change in intangible expenditures this is an increasingly unwise approach for professional advice givers. It is also worth noting that P/B and P/E ratios represent two of the three variables used to determine stock inclusion in the widely followed style index, MSCI World Value. The key driver of future earnings - intangibles, is not being appropriately reflected in the income statements and balance sheets in a rapidly changing economy. Accounting rules have not yet adapted. This, we strongly contend, is a key reason for the long-term underperformance of Value indices post the Global Financial Crisis. Intangibles- a key to investing in today's world Even though it is impossible to measure the value of intangibles precisely, it is essential for investment professionals to come up with a logical approach to incorporate intangibles into their decision making; otherwise, they risk being relics in this new age of information. At Insync we have developed a systematic way of incorporating the cashflows that intangibles are delivering into our valuation methodology. This results in a more accurate assessment of the value of a business and a key reason of our successful stock selections. Funds operated by this manager: Insync Global Capital Aware Fund, Insync Global Quality Equity Fund Disclaimer |


16 May 2022 - Performance Report: Cyan C3G Fund
| Report Date | |
| Manager | |
| Fund Name | |
| Strategy | |
| Latest Return Date | |
| Latest Return | |
| Latest 6 Months | |
| Latest 12 Months | |
| Latest 24 Months (pa) | |
| Annualised Since Inception | |
| Inception Date | |
| FUM (millions) | |
| Fund Overview | Cyan C3G Fund is based on the investment philosophy which can be defined as a comprehensive, clear and considered process focused on delivering growth. These are identified through stringent filter criteria and a rigorous research process. The Manager uses a proprietary stock filter in order to eliminate a large proportion of investments due to both internal characteristics (such as gearing levels or cash flow) and external characteristics (such as exposure to commodity prices or customer concentration). Typically, the Fund looks for businesses that are one or more of: a) under researched, b) fundamentally undervalued, c) have a catalyst for re-rating. The Manager seeks to achieve this investment outcome by actively managing a portfolio of Australian listed securities. When the opportunity to invest in suitable securities cannot be found, the manager may reduce the level of equities exposure and accumulate a defensive cash position. Whilst it is the company's intention, there is no guarantee that any distributions or returns will be declared, or that if declared, the amount of any returns will remain constant or increase over time. The Fund does not invest in derivatives and does not use debt to leverage the Fund's performance. However, companies in which the Fund invests may be leveraged. |
| Manager Comments | The Cyan C3G Fund has a track record of 7 years and 9 months and has outperformed the ASX Small Ordinaries Total Return Index since inception in August 2014, providing investors with an annualised return of 11.51% compared with the index's return of 8.31% over the same period. On a calendar year basis, the fund has only experienced a negative annual return once in the 7 years and 9 months since its inception. Over the past 12 months, the fund's largest drawdown was -21.46% vs the index's -9.15%, and since inception in August 2014 the fund's largest drawdown was -36.45% vs the index's maximum drawdown over the same period of -29.12%. The fund's maximum drawdown began in October 2019 and lasted 1 year and 4 months, reaching its lowest point during March 2020. The fund had completely recovered its losses by February 2021. The Manager has delivered these returns with 0.24% more volatility than the index, contributing to a Sharpe ratio which has fallen below 1 five times over the past five years and which currently sits at 0.67 since inception. The fund has provided positive monthly returns 86% of the time in rising markets and 38% of the time during periods of market decline, contributing to an up-capture ratio since inception of 64% and a down-capture ratio of 66%. |
| More Information |

16 May 2022 - Performance Report: L1 Capital Long Short Fund (Monthly Class)
| Report Date | |
| Manager | |
| Fund Name | |
| Strategy | |
| Latest Return Date | |
| Latest Return | |
| Latest 6 Months | |
| Latest 12 Months | |
| Latest 24 Months (pa) | |
| Annualised Since Inception | |
| Inception Date | |
| FUM (millions) | |
| Fund Overview | |
| Manager Comments | The L1 Capital Long Short Fund (Monthly Class) has a track record of 7 years and 8 months and has outperformed the ASX 200 Total Return Index since inception in September 2014, providing investors with an annualised return of 23.8% compared with the index's return of 8.02% over the same period. On a calendar year basis, the fund has only experienced a negative annual return once in the 7 years and 8 months since its inception. Over the past 12 months, the fund's largest drawdown was -7.21% vs the index's -6.35%, and since inception in September 2014 the fund's largest drawdown was -39.11% vs the index's maximum drawdown over the same period of -26.75%. The fund's maximum drawdown began in February 2018 and lasted 2 years and 9 months, reaching its lowest point during March 2020. The fund had completely recovered its losses by November 2020. The Manager has delivered these returns with 6.44% more volatility than the index, contributing to a Sharpe ratio which has fallen below 1 two times over the past five years and which currently sits at 1.09 since inception. The fund has provided positive monthly returns 79% of the time in rising markets and 65% of the time during periods of market decline, contributing to an up-capture ratio since inception of 93% and a down-capture ratio of -2%. |
| More Information |

16 May 2022 - Performance Report: Bennelong Long Short Equity Fund
| Report Date | |
| Manager | |
| Fund Name | |
| Strategy | |
| Latest Return Date | |
| Latest Return | |
| Latest 6 Months | |
| Latest 12 Months | |
| Latest 24 Months (pa) | |
| Annualised Since Inception | |
| Inception Date | |
| FUM (millions) | |
| Fund Overview | In a typical environment the Fund will hold around 70 stocks comprising 35 pairs. Each pair contains one long and one short position each of which will have been thoroughly researched and are selected from the same market sector. Whilst in an ideal environment each stock's position will make a positive return, it is the relative performance of the pair that is important. As a result the Fund can make positive returns when each stock moves in the same direction provided the long position outperforms the short one in relative terms. However, if neither side of the trade is profitable, strict controls are required to ensure losses are limited. The Fund uses no derivatives and has no currency exposure. The Fund has no hard stop loss limits, instead relying on the small average position size per stock (1.5%) and per pair (3%) to limit exposure. Where practical pairs are always held within the same sector to limit cross sector risk, and positions can be held for months or years. The Bennelong Market Neutral Fund, with same strategy and liquidity is available for retail investors as a Listed Investment Company (LIC) on the ASX. |
| Manager Comments | The Bennelong Long Short Equity Fund has a track record of 20 years and 3 months and has outperformed the ASX 200 Total Return Index since inception in February 2002, providing investors with an annualised return of 12.9% compared with the index's return of 8.35% over the same period. On a calendar year basis, the fund has experienced a negative annual return on 3 occasions in the 20 years and 3 months since its inception. Over the past 12 months, the fund's largest drawdown was -21.67% vs the index's -6.35%, and since inception in February 2002 the fund's largest drawdown was -29.05% vs the index's maximum drawdown over the same period of -47.19%. The fund's maximum drawdown began in September 2020 and has lasted 1 year and 7 months, reaching its lowest point during April 2022. During this period, the index's maximum drawdown was -15.05%. The Manager has delivered these returns with 0.15% less volatility than the index, contributing to a Sharpe ratio which has fallen below 1 five times over the past five years and which currently sits at 0.75 since inception. The fund has provided positive monthly returns 64% of the time in rising markets and 61% of the time during periods of market decline, contributing to an up-capture ratio since inception of 5% and a down-capture ratio of -127%. |
| More Information |

16 May 2022 - New Funds on Fundmonitors.com
|
New Funds on FundMonitors.com |
|
Below are some of the funds we've recently added to our database. Follow the links to view each fund's profile, where you'll have access to their offer documents, monthly reports, historical returns, performance analytics, rankings, research, platform availability, and news & insights. |
|
|
|||||||||||||||||
| GQG Partners Global Equity Fund - AUD Hedged | |||||||||||||||||
|
|||||||||||||||||
|
GQG Partners Global Equity Fund - Class A |
|||||||||||||||||
|
|||||||||||||||||
|
GQG Partners Emerging Markets Equity Fund - Class A |
|||||||||||||||||
|
|||||||||||||||||
|
|
|||||||||||||||||
| Longreach Energy Income Fund | |||||||||||||||||
|
|||||||||||||||||
| View Profile | |||||||||||||||||
 |
|||||||||||||||||
| Microequities Value Income Fund | |||||||||||||||||
|
|||||||||||||||||
| View Profile | |||||||||||||||||
|
Want to see more funds? |
|||||||||||||||||
|
Subscribe for full access to these funds and over 650 others |


16 May 2022 - Earnings growth is becoming a priority
|
Earnings growth is becoming a priority Montgomery Investment Management April 2022
Over the years I have often sat alongside guests on a TV or radio panel and heard them conclude the easy gains have been made. For the first time in many years I agree. In recent years investors have made substantial gains from equities but a close look at the driving force behind those gains is likely to reveal investors won because the tide was rising. Sure, many companies grew their earnings too but there were a huge number of companies whose share prices went parabolic despite the absence of earnings. A rising tide does indeed lift all boats, but don't mistake a rising tide for genius, or so the axiom goes. Since 1979, without exception, every period of inflation and or rising interest rates, was accompanied by a contraction in price to earnings (PE) ratios. And using data back to the 1980s, we find the decline in the earnings multiple is greatest when interest rates move up from lower starting levels, just as we are witnessing now. For the last four decades, whenever inflation or interest rates have risen, the multiple of earnings investors have been willing to pay for a share in a company has declined. In every one of the seven phases when US 2-Year Treasury yields rose between 1980 and today, the US S&P500 12-month forward PE Ratio declined. In other words, if Jerome Powell and his team at the US Federal Reserve continue on the path articulated in our blog post The End of Zero, investors can kiss goodbye the easy wins resulting from shares simply becoming more popular, and that rising popularity being reflected in ever expanding PE multiples. I will go so far as to suggest we are, right now, in a period of adjustments to a regime of lower PEs. Plenty of investors haven't yet worked that out and this can be seen in the steep gains for almost all equities amid the hope and talk of peace in Ukraine. Fundamentally however, rates are rising. And while I think rates will rise by less than the most bearish forecasts, the impact on PEs is already underway. Going forward Investors should now be looking at the quality of their portfolios and seek at least some exposure to high quality growth. If a company, with earnings of $10 per share, sees its PE of 35 times fall to 25 times, the share price will decline 28 per cent, from $350 down to $250. Plenty of high-quality growth companies have experienced this, and worse. And that represents a new opportunity. In an environment of high short-term inflation expectations history tells us not to expect expanding PEs. If the best we can hope for is PEs remain static, the way to generate capital growth will be from earnings growth. If the PE ratio for our hypothetical company stays at 25 times earnings, the share price will return to $350 provided earnings grow 40 per cent to $14 per share (E$14 x PE25 = Px$350). The work investors need to undertake now is to uncover those companies able to grow. One place to look is among those companies enjoying structural or megatrend tailwinds. And if among those companies you also find a capital light and highly profitable business with net cash on the balance sheet, more power to you. Avoid capital intensive, low growth, mature, cyclical, geared businesses, or those with lumpy contract-type revenues, and those exposed to discretionary spending (unless they are on a store roll-out tear) and those companies playing in the revolving door of capital - paying out cash, they need later, as dividends today and subsequently raising dilutive capital to replace it. In the next period investors will be wise owning businesses selling products and services with inelastic demand and the recipients of non-discretionary spending. Think of Microsoft - nobody is going to cut their subscription to Microsoft Office just because Jerome Powell said interest rates are going up, or because Putin decides to invade Ukraine. Inelastic services like Microsoft Office are entrenched in the daily systems of hundreds of millions of businesses and individuals. That durability provides Microsoft low cyclicality, higher profitability, stable, recurring and growing cash flows and little or no need for debt. Another company that comes to mind is held in the Polen Capital Global Growth Fund; Adobe. Adobe's Digital Media products enjoy a near monopoly and are "industry standard". Adobe creates and markets software for creative professionals and hobbyists. Its digital media segment supplies 70 per cent of revenue and 90 per cent of it is recurring. Meanwhile its SaaS based digital marketing solutions for enterprises produces 24 per cent of revenue, while Print & Publishing is two percent. In 2011 Adobe commenced a transition to annual subscription-based sales, forever altering the company from a "boom, bust" product cycle business to a predictable, subscription-based model. Unsurprisingly the company generates a return on invested capital of 33 per cent, a return on equity of 43 per cent, has US$1.1 billion of net cash on its balance sheet, produced earnings growth in 2021 of 23.6 per cent, free cash flow growth of 29 per cent and an operating margin of 45 per cent. They are numbers most businesses owners would be envious of. But when Adobe recently announced it was ceasing new sales to Russia and not collecting on subscriptions there, the share plunged nearly 10 per cent. Great! Since its share price highs last year, the shares have declined 37 per cent. Sure, the rate of growth that saw revenue of US1.6 billion in 2004 rise to US$15.8 billion in 2021 may slow but this is a structural growth story, a very high-quality company and remember, shares prices generally track earnings if the PE remains constant. And finally, let us say interest rate rises have the desired effect of reducing inflation. Well, what follows is disinflation and in a disinflationary environment, when the economy is still growing, PEs expand again. That would be icing on the cake for investors who heed the suggestion to invest in quality growth after share prices have been slammed by contracting PEs. Author: Roger Montgomery, Chairman and Chief Investment Officer Funds operated by this manager: Montgomery (Private) Fund, Montgomery Small Companies Fund, The Montgomery Fund |