
NEWS

30 May 2022 - 3 big megatrends boosting returns
|
3 big megatrends boosting returns Insync Fund Managers May 2022 The strong and consistent returns we obtain for our investors are achieved by investing in businesses that are highly profitable and cash generative, with strong balance sheets. But which ones? Over time, an increase in the share price of a company follows its earnings growth. Investing in those few, well positioned and highly profitable companies benefitting from megatrends, delivers 'best of the best' outcomes. Here are 3 of our 16 big megatrends boosting returns: Household Formation Enterprise Digitisation Internet of Things Funds operated by this manager: Insync Global Capital Aware Fund, Insync Global Quality Equity Fund Disclaimer |

27 May 2022 - Hedge Clippings |27 May 2022
|
|
|
|
Hedge Clippings | Friday, 27 May 2022
So the election (thankfully) is over. The result, with the benefit of hindsight, was predictable or at least hiding in plain sight. Whether one is pleased, disappointed, or couldn't care less would depend on your political hue - blue, red, green, teal, or yellow. Although he navigated the country reasonably safely through COVID, Scomo certainly stirred up some ill feeling across sections of the community who would normally have voted Liberal. Meanwhile, Albo didn't seem to be across all the economic facts, was sidelined for a week with COVID, and didn't appear to be the most inspirational of campaigners. However, it looks like he'll just get across the line in his own right, albeit with less than one third of the primary vote. Irrespective of one's view either way, having a clear winner is positive. Having laid out his policies, the new PM and his team should be entitled to get on with implementing them, without being distracted or blackmailed by minority groups with their own agenda. They'll be able to do that in the lower house. The Senate might be a different matter. So now we can get back to normal - or should that be the "new normal", the economy? In many ways, not much has changed. Debt levels are sky high at the household level, thanks to over a decade of falling interest rates, and, over the last couple of years, government COVID assistance thrown by the bucket-load at a willing individual and business community, whether it was needed or not. The problem with throwing bucket-loads of anything is that while some hits the mark, much of it misses and lands up being wasted - or adding to the mess. Market wise, sooner or later there was going to be a day of reckoning, with inflation back with a vengeance, aided by COVID, supply chain issues, and a war in Europe's backyard. Meanwhile, valuations in the tech/crypto sector in particular defied long term history lessons, and investors are learning, or being reminded of the lessons - or benefits - of diversification. Diversification can take many forms - from the simple (and not always very effective) investment in a broadly based low cost "index" fund to a concentrated fund investing in just 15 or 20 companies within the same index. However, depending on the skill of the fund manager, the concentrated fund might outperform in one market environment but significantly underperform in another. Thus logically, the careful or risk averse investor (those that hope for the best, but plan for the worst) spread their investments across funds to avoid manager risk, across strategies, and across asset classes. Diversification works well, as long as one considers the correlation between funds, strategy and asset class. In addition to correlation, a key indicator to consider is a fund's Down Capture Ratio, which in effect just measures correlation in negative markets. All too often, particularly in rapidly falling markets, diversification doesn't work if the correlation is high (as it is at present) between equities and bonds. With over 650 funds on the Fundmonitors.com database, there's the dilemma, or difficulty, of too much choice. In rapidly changing market environments, particularly in negative or falling markets, make sure that your fund selections are not only diversified, but also not overly correlated. For instance, including long/short funds, or in the current environment, funds investing in "clean energy" minerals such as Argonaut's or Terra Capital's focus on lithium or nickel. Outside equities, alternatives such as Laureola's Life Settlements, which has zero correlation to any other market or asset class. News & Insights A brave new world | Kardinia Capital Equity risk premium | IQuay Global Investors Revenge Travel | Insync Fund Managers Infrastructure assets are well placed for an era of inflation | Magellan Asset Management |
|
|
April 2022 Performance News Bennelong Concentrated Australian Equities Fund Equitable Investors Dragonfly Fund |
|
|
If you'd like to receive Hedge Clippings direct to your inbox each Friday
|

27 May 2022 - Fund Review: Bennelong Long Short Equity Fund April 2022
BENNELONG LONG SHORT EQUITY FUND
Attached is our most recently updated Fund Review on the Bennelong Long Short Equity Fund.
- The Fund is a research driven, market and sector neutral, "pairs" trading strategy investing primarily in large-caps from the ASX/S&P100 Index, with over 20-years' track record and an annualised return of 12.90%.
- The consistent returns across the investment history highlight the Fund's ability to provide positive returns in volatile and negative markets and significantly outperform the broader market. The Fund's Sharpe Ratio and Sortino Ratio are 0.75 and 1.12 respectively.
For further details on the Fund, please do not hesitate to contact us.

27 May 2022 - Market Insights & Fund Performance
|
Market Insights & Fund Performance L1 Capital May 2022 WEBINAR REPLAY | L1 Capital Long Short Portfolio | May 19, 2022 Mark Landau, Joint Managing Director and Chief Investment Officer of L1 Capital, provides an update, including a look at key market drivers: Inflation, Energy and Re-opening trade. Funds operated by this manager: L1 Capital Long Short Fund (Daily Class), L1 Capital Long Short Fund (Monthly Class), L1 Capital U.K. Residential Property Fund IV, L1 Long Short Fund Limited (ASX: LSF) |

26 May 2022 - Fund Review: Bennelong Kardinia Absolute Return Fund April 2022
BENNELONG KARDINIA ABSOLUTE RETURN FUND
Attached is our most recently updated Fund Review. You are also able to view the Fund's Profile.
- The Fund is long biased, research driven, active equity long/short strategy investing in listed ASX companies.
- The Fund has significantly outperformed the ASX200 Accumulation Index since its inception in May 2006 and also has significantly lower risk KPIs. The Fund has an annualised return of 7.89% p.a. with a volatility of 7.70%, compared to the ASX200 Accumulation's return of 6.63% p.a. with a volatility of 14.14%.
- The Fund also has a strong focus on capital protection in negative markets. Portfolio Managers Kristiaan Rehder and Stuart Larke have significant market experience, while Bennelong Funds Management provide infrastructure, operational, compliance and distribution capabilities.
For further details on the Fund, please do not hesitate to contact us.

26 May 2022 - Infrastructure assets are well placed for an era of inflation
|
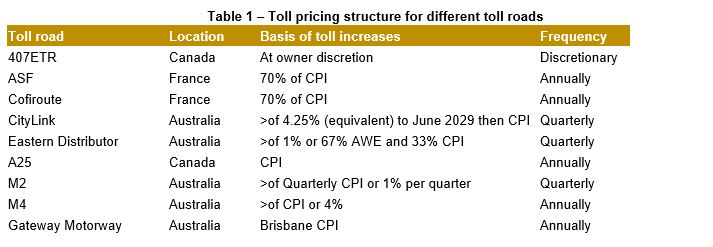
Infrastructure assets are well placed for an era of inflation Magellan Asset Management April 2022 Global stocks struggled early in 2022 because investors were concerned about faster inflation, which has risen to its highest in four decades in the US, a record high in the eurozone and highest in three decades in the UK. Long-term bond yields are climbing (bond prices are falling) because inflation reduces the value of future bond payments. Short-term bond yields are rising as central banks have increased, or are poised to lift, cash rates and terminate, even reverse, their asset-buying programs that supressed interest rates. In times of accelerating inflation and turbulent share markets, investors might find that holding global listed infrastructure securities is one way to help protect a portfolio against inflation. Inflation and asset values Inflation tends to hurt stocks in two ways. One is that inflation reduces the present value of future cash flows, a key determinant of share prices. The other way a sustained increase in inflation undermines stock valuations is that rising input costs and higher borrowing costs reduce profits - unless a business has the pricing power to boost the price of its goods or services to compensate. The lower the expected profits, the less people are willing to pay for shares. Inflation and infrastructure assets As inflation accelerates worldwide, many investors are turning to the few companies that are renowned for their inflation protection. Among these are infrastructure companies. The discussion here assumes companies defined as infrastructure meet two criteria. First, the company must own or operate assets that behave like monopolies. Second, the services provided by the company must be essential for a community to function efficiently. Such companies have predictable cash flows that make them attractive defensive assets. The main sectors within infrastructure are utilities, toll roads, airports, railroads, energy infrastructure, communications (mobile phone and broadcast towers). Each sector exhibits diverse investment characteristics and reacts differently to faster inflation, as explained below. The key thing to note though is most of these businesses are protected from inflation, which should help support their share prices if inflation becomes entrenched. Utilities Utilities include water utilities, electricity transmission (high-voltage power lines) and electricity distribution (urban power lines) and gas transmission and distribution. In most countries, utilities are monopolies. Consequently, government regulators control the prices these entities charge and adjust rates to provide utilities with an appropriate return on invested capital. This process requires regulators to take into account the changes to borrowing, construction and operating costs and changes in the value of the assets that utilities own. While all the regulatory regimes that Magellan considers to be investment-grade feature mechanisms that allow for the recovery of rising utility input and financing costs, the intricacies of different regulatory regimes affect the timeliness of that recovery. Regulatory systems that strike return allowances in real terms, escalate revenues with inflation, and index debt costs to market yields, including those in Australia and the UK, provide the most timely protection against inflation. By contrast, regulatory systems such as those in Spain and the US that strike return and cost allowances in nominal terms protect against inflation with a modest lag. Toll roads The typical business model for a toll road is that a government signs a contract that allows a toll-road operator to collect tolls for a set time and increase those tolls on a regular basis in a defined way. At the end of this contract, the road is returned to government ownership in a good state of repair. In most countries, the toll road is often not the only road route available to motorists. Consequently, the toll road is not a monopoly. The toll road, however, generally exists because alternative routes are much slower. The opening of a toll road inevitably reduces traffic on the free alternative. But over time, the free alternative can become congested more quickly than the toll road. As that occurs, the toll road behaves more like a monopoly and gives toll roads increased pricing power. However, toll price changes are generally pre-defined under a contract. Table 1 shows a cross-section of how toll prices are set in a range of contracts.
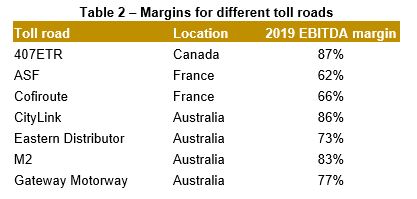
Sources: Company releases, Magellan As can be seen, the pricing mechanism for many of these toll roads picks up any increases in inflation with minimal lag. Moreover, due to their strong pricing power, toll roads can expect that there will be minimal, if any, loss in traffic when tolls increase so revenues will fully recover the inflationary hit. Additionally, one of the key characteristics of toll roads that insulates them from inflationary impacts is their high profit margins. Table 2 shows the gross profit margins of a selection of international toll roads. The average margin of 75% from the sample is substantially above other industrial companies.
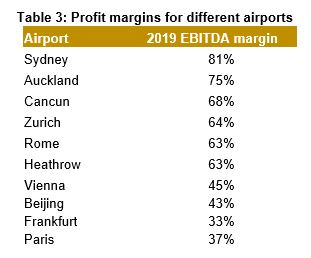
Source: Company releases, Magellan The other key area where inflation can hurt profits is by increasing the cost of capital expenditure companies need to undertake. With most toll roads, however, the capital expenditure on operating roads is minimal and generally limited to resurfacing and replacing crash barriers, etc. Airports When looking at airports and inflation, it's best to consider airports as two businesses. The 'airside' operations primarily involve managing the runways and taxiways of the airport. Airside revenue is generated by a charge levied per passenger or a charge levied on the weight of the plane, or a combination. In most jurisdictions, the onus is on the airport to negotiate appropriate charges with the airlines. This side of the operation therefore behaves much like a regulated utility. The other business is the 'landside' operation that involves the remainder of the airport. These operations cover three primary areas: retail, car parking and property development. In most airports, the airport owner does not run the retail outlets. Instead, the owner acts as the lessor and receives a guaranteed minimum rental that is normally inflation-linked plus a share of sales. These revenues are therefore protected from a jump in inflation. The parking operations at the airport generally behave like a monopoly although there is some substitution threat; that is, passengers can use taxis instead of driving. As such, airports have significant ability to increase prices in response to higher inflation. In regard to costs, airport profit margins exhibit much greater variability than toll roads, as evident from Table 3.
Source: Company releases, Magellan Efficient airports such as those in Auckland and Sydney are more insulated from faster inflation than those (typically European) airports that are struggling to reduce the workforces that were in place when they were privatised. (Even these less-efficient airports still exhibit higher margins than the average industrial company.) Finally, airports also have the highest capital expenditure requirements of any of the transport infrastructure subsectors. Airside capital expenditure includes widening and extending runways and taxiways. It is generally only undertaken after consultation and agreement with the airlines and regulatory authorities. Over time, airside charges will rise to recover these costs. Landside capital expenditure relates to increasing the retail, parking and general property leasing facilities. Higher inflation may change the financial viability of such capital expenditure. But airports, having an unregulated monopoly in these areas, can increase prices to compensate for inflation. Consequently, inflation is unlikely to hurt the value of an airport asset. Railroads (Class 1 freight rail) The railroads that meet Magellan's definition of infrastructure are primarily North American Class 1 railroads. These railroads typically have no regulator-approved capability to pass through inflation. Instead, their respective national regulators provide for lighter economic regulation using a broad 'revenue adequacy' standard. Thus, regulations have allowed railroad operators to charge rates that support prudent capital outlays, assure the repayment of a reasonable level of debt, permit the raising of needed equity capital, and cover the effects of inflation whilst attempting to maintain sufficient levels of market-based competition. Arguably, this framework has provided railroads with greater discretion around the rates they charge customers and thus, the ability to more than account for inflation. Chart 1 shows how North American railroads have increased rates at levels well ahead of inflation over the past 20 years.
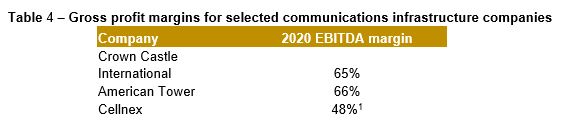
Source: US Bureau of Labor Statistics; Federal Reserve and AAR This isn't to suggest that regulation provides the key source of inflation protection for North American railroads. Rather, we think the rails generate most of their inflation protection from pricing power (which is derived from the lack of alternatives and the regional duopolistic regional markets) and operating efficiencies. Energy infrastructure The energy-infrastructure companies that meet our definition of infrastructure have dominant market positions and real pricing power, which is reflected in long-term, typically inflation-linked, take-or-pay contracts or regulated returns. Given the long-term nature of energy infrastructure contracts, pipeline and storage operators typically use pre-agreed price increases to protect real revenues and hedge against rising costs. Given the strategic and monopolistic nature of some assets such as transmission pipelines, some of these pipelines are regulated. Australia, for instance, has a mix of regulated and unregulated gas pipelines. In Canada, tariffs are negotiated within a regulatory framework. In the US, the regulator sets pipeline rates to allow the operator to earn a fair return on their invested capital. All methods protect these companies from inflation. Tank-storage providers that meet our definition of infrastructure need to have terminals in favourable locations and typically sell capacity, predominantly under long-term contracts, with no exposure to movements in commodity prices. Long-term storage contracts are usually indexed in a similar way to pipeline contracts. Netherlands-based storage provider Royal Vopak has long-term contracts (longer than one year) linked to the CPI of the country where the storage takes place (with annual indexation), while the bulk of costs are in the local currency of those countries, which provides a strong hedge against inflation Communications infrastructure Communications infrastructure, as defined by Magellan, is comprised of independently owned communication sites designed to host wireless communication equipment, primarily towers. Although these sites are mainly used by wireless carriers, they may host equipment for television, radio and public-safety networks. Despite the complexities of the technology that underpins wireless communication networks, the business model for these tower companies is simple. These companies generate most of their revenue through leasing tower space to wireless carriers such as mobile-service providers that need a place to install equipment. In return for providing this space, the tower company receives a lease or services agreement that provides a long-term and reliable income stream. The terms of these contracts are usually favourable for tower companies because data demand is strong and competition is low. Thus, leases are long term and revenue increases are priced into the contract.
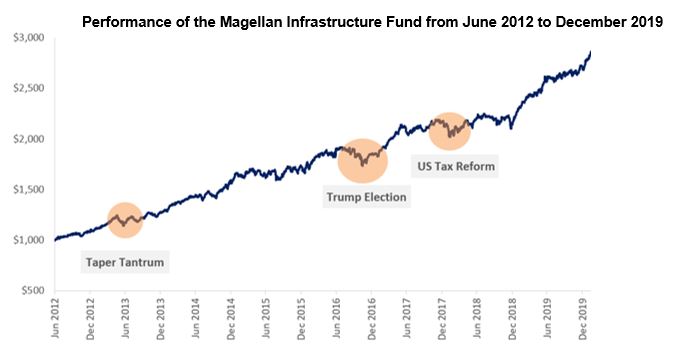
Source: Magellan Even so, we consider some, primarily US-based, communication towers to be relatively more sensitive to changes in inflation than other infrastructure sectors. This is due to communication towers in the US typically having limited inflation protection on the revenue side in the near term. In sum, we consider their protection to be partial. The second order effect of higher interest rates The traditional policy approach from central banks in response to higher inflation is to raise nominal interest rates, which has potentially two effects on our investment universe: The impact of changes in interest rates on the underlying financial performance of the businesses in which we invest; and the impact on the valuation of those businesses. As discussed above, regulated utilities can recover the cost tied to a rise in inflation through the periodic regulatory process. This generally includes the costs of servicing higher interest rates on their debt, thus exposure to interest rates will be limited to the length of time between reset periods, albeit in practice those utilities that are exposed to this kind of risk tend to hedge it by issuing fixed rate debt with a term that aligns with the regulatory period. Overall, the past decade has witnessed a significant lengthening in the duration of the debt portfolio for the majority of infrastructure and utilities businesses. Many of these companies are well protected from higher rates because they have taken advantage of the low interest rates of recent years to lock in cheap, fixed rate debt for long periods. Ultimately, we are confident that any shifts in interest rates will not hamper the financial performance of the companies in the portfolio for the foreseeable future. In terms of valuation, an increase in interest rates can be expected to lead to a higher cost of debt, and an increase in the rate at which investors value future earnings (the higher this 'discount rate', the less investors are willing to pay for future income streams). While our forecasts and valuations take these factors into account, the history of financial markets leads us to expect increasing uncertainty if rates rise or look like rising. Companies that are regarded as 'defensive' are often shunned when interest rates rise as investors prefer higher-growth sectors. However, it is our experience that provided businesses have solid fundamentals, their stock prices over the longer term will reflect their underlying earnings. In recent history, there have been three occasions where we have seen a spike in US 10-year yields of about 0.9%. At face value, these three increases in prevailing interest rates appear to have led to declines in the market value of listed infrastructure. However, if we look over the combined period then a different picture emerges. The following chart shows the performance of the Magellan Infrastructure Fund from June 2012 to December 2019.
The chart shows that the hit from higher interest rates was short term. Once the interest-rate rises were digested and it was established that the outlooks for infrastructure businesses were largely unaffected then the share prices recovered. Conclusion Infrastructure remains well placed in an environment of increasing inflation due to its inflation-linked revenues, low operating costs and consequent high margins, with the second order impact of higher interest rates being muted by the lengthening of company debt portfolios over the past decade. These characteristics offer investors a haven when inflation is at decade highs around the world. |
|
Funds operated by this manager: Magellan Global Fund (Hedged), Magellan Global Fund (Open Class Units) ASX:MGOC, Magellan High Conviction Fund, Magellan Infrastructure Fund, Magellan Infrastructure Fund (Unhedged), MFG Core Infrastructure Fund [1] This is on a post-lease payments basis. Important Information: This material has been delivered to you by Magellan Asset Management Limited ABN 31 120 593 946 AFS Licence No. 304 301 ('Magellan') and has been prepared for general information purposes only and must not be construed as investment advice or as an investment recommendation. This material does not take into account your investment objectives, financial situation or particular needs. This material does not constitute an offer or inducement to engage in an investment activity nor does it form part of any offer documentation, offer or invitation to purchase, sell or subscribe for interests in any type of investment product or service. You should read and consider any relevant offer documentation applicable to any investment product or service and consider obtaining professional investment advice tailored to your specific circumstances before making any investment decision. A copy of the relevant PDS relating to a Magellan financial product or service may be obtained by calling +61 2 9235 4888 or by visiting www.magellangroup.com.au. Past performance is not necessarily indicative of future results and no person guarantees the future performance of any strategy, the amount or timing of any return from it, that asset allocations will be met, that it will be able to be implemented and its investment strategy or that its investment objectives will be achieved. This material may contain 'forward-looking statements'. Actual events or results or the actual performance of a Magellan financial product or service may differ materially from those reflected or contemplated in such forward-looking statements. This material may include data, research and other information from third party sources. Magellan makes no guarantee that such information is accurate, complete or timely and does not provide any warranties regarding results obtained from its use. This information is subject to change at any time and no person has any responsibility to update any of the information provided in this material. Statements contained in this material that are not historical facts are based on current expectations, estimates, projections, opinions and beliefs of Magellan. Such statements involve known and unknown risks, uncertainties and other factors, and undue reliance should not be placed thereon. Any trademarks, logos, and service marks contained herein may be the registered and unregistered trademarks of their respective owners. This material and the information contained within it may not be reproduced, or disclosed, in whole or in part, without the prior written consent of Magellan. |
.JPG)

25 May 2022 - Performance Report: Equitable Investors Dragonfly Fund
| Report Date | |
| Manager | |
| Fund Name | |
| Strategy | |
| Latest Return Date | |
| Latest Return | |
| Latest 6 Months | |
| Latest 12 Months | |
| Latest 24 Months (pa) | |
| Annualised Since Inception | |
| Inception Date | |
| FUM (millions) | |
| Fund Overview | The Fund is an open ended, unlisted unit trust investing predominantly in ASX listed companies. Hybrid, debt & unlisted investments are also considered. The Fund is focused on investing in growing or strategic businesses and generating returns that, to the extent possible, are less dependent on the direction of the broader sharemarket. The Fund may at times change its cash weighting or utilise exchange traded products to manage market risk. Investments will primarily be made in micro-to-mid cap companies listed on the ASX. Larger listed businesses will also be considered for investment but are not expected to meet the manager's investment criteria as regularly as smaller peers. |
| Manager Comments | The fund ended the month with 31 positions and 3% in cash (including cash ETF). The fund's top positions at month-end included Earlypay, Geo (NZX-listed), MedAdvisor, Ellume (unlisted), Intelligent Monitoring, Scout Security, Energy Technologies, Mad Paws and Upsure. Equitable see fundamentals being more compelling now than they have been for some time. However, they noted they don't necessarily see equity markets snapping back upwards. They believe it's more likely there will be ongoing sentiment swings as the world adjusts to higher interest rates, central banks juggle inflation and employment targets and geopolitical instability looms. |
| More Information |

25 May 2022 - Fund Review: Bennelong Twenty20 Australian Equities Fund April 2022
BENNELONG TWENTY20 AUSTRALIAN EQUITIES FUND
Attached is our most recently updated Fund Review on the Bennelong Twenty20 Australian Equities Fund.
- The Bennelong Twenty20 Australian Equities Fund invests in ASX listed stocks, combining an indexed position in the Top 20 stocks with an actively managed portfolio of stocks outside the Top 20. Construction of the ex-top 20 portfolio is fundamental, bottom-up, core investment style, biased to quality stocks, with a structured risk management approach.
- Mark East, the Fund's Chief Investment Officer, and Keith Kwang, Director of Quantitative Research have over 50 years combined market experience. Bennelong Funds Management (BFM) provides the investment manager, Bennelong Australian Equity Partners (BAEP) with infrastructure, operational, compliance and distribution services.
For further details on the Fund, please do not hesitate to contact us.
25 May 2022 - Revenge Travel
|
Revenge Travel Insync Fund Managers April 2022 Why on earth would Experiences thrive with the gloom around today? Put simply-Pent-up demand. Pre-Covid expenditure on experiences had been consistently growing ahead of GDP and its sub-segment, travel, was one of the fastest growing. Most megatrends within Insync's portfolio tend to have low sensitivity to economic cycles but the one sub-segment that suffered temporarily was travel. The extent of the fall in travel was unprecedented. Worldwide a staggering 1 billion fewer international arrivals in 2020 than in 2019. This compares with the 4% decline recorded during the 2009 global economic crisis (GFC).
There has been a lack of visibility on how leisure travel was going to emerge after governments implemented onerous travel restrictions. This was compounded by the shift to working from home with online meetings reducing the need for face-to-face meetings. What we do know is that humans desire to travel is hardwired into all of our DNAs. As travel restrictions have started to ease consumers appear to be making up for lost time. Airlines in the US last month reported domestic flight bookings surpassing pre-pandemic levels! US travellers spent $6.6 billion on flights in February, 6% higher than February 2019. Airlines for America, a leading US industry advocacy group noted that travellers have been eager to book tickets as COVID restrictions lifted. This provides a good indicator for the rest of the world. Our families and friends are all planning new adventures and reunions too. Interestingly, rising jet fuel prices, which have put upward pressure on ticket prices, has so far not deterred travellers who are willing to spend more. Emirates recently added a fuel surcharge and saw booking rise! A number of surveys are painting similar stories. TripAdvisor, found that 45% of Americans are planning to travel this March and April, including 68% of Gen Z travellers. This number will climb higher as the summer season rapidly approaches, as 68% of all American adults will vacation this summer (The Vacationer). No wonder hotels around the United States are nearing or have already surpassed pre-pandemic occupancy. Just try finding a decent, moderately priced hotel room in Sydney, as two of our team have recently experienced. The megatrend of Experiences is accelerating. Finding the right businesses benefitting from the trend is equally important for the consistent earnings growth we seek. It's why Cruise lines, airlines and hotels, whilst obvious picks, don't meet the quality criteria we insist upon.
Recently we reinvested into Booking Holdings after the over-blown pull back in its share price and the Covid event subsiding. It generates prodigious amounts of cash because of their scale and superior margins versus its competitors. As well as delivering a commanding competitive position they also help it in protecting against inflation. Bookings recently overtook Marriott, the largest hotel group, in gross volume booked in 2012, and today stands 70% bigger. Companies with superior business models and balance sheets tend to come through a crisis strengthening their competitive position. Booking Holdings is a prime example. The structural reduction in business travel has made hotels reliant upon OTAs once again to fill-up their rooms. This has been evidenced by recent data showing strong market share gains, in excess of pre-COVID levels. Second is the shutdown of Google's "Book on Google" product, removing the biggest perennial risk to the OTA investment case. The fact that the most powerful online search engine is shutting down this service is testament to the powerful position that Booking Holdings occupy.
Long term, travel looks set to continue to grow ahead of GDP as populations age, emerging market middle classes expand, and discretionary spend shifts more from "things" to "experiences.". Booking Holdings will be a major beneficiary compounding earnings for many years with its share price likely to follow the consistent growth in earnings.
Funds operated by this manager: Insync Global Capital Aware Fund, Insync Global Quality Equity Fund Disclaimer |


24 May 2022 - Great long-term opportunities come in times of uncertainty
|
Great long-term opportunities come in times of uncertainty Claremont Global April 2022
How are you navigating the current market environment?There have certainly been some rough seas in the first quarter of 2022. Between inflation, rising interest rates, soaring oil prices and the tragic Russian invasion of Ukraine, there's a lot of headline risk. One danger for investors is that they get whipsawed as they attempt to respond to macro and geopolitical risk. However, we don't manage from a top-down macro perspective ― instead, we focus on companies and construct the portfolio to reduce exposure to specific risks. It's a high conviction portfolio of between 10 and 15 companies. All our portfolio companies are listed in developed markets, although typically have geographically diverse revenue. Over the last few months, we've been able to deploy cash and reallocate capital across the portfolio, to take advantage of opportunities where the discount to our estimate of value is greatest. Recent volatility has allowed us to add two new positions to the portfolio - great companies that we've been able to buy at depressed levels. So, you pay no attention to macro?We're macro aware and we control our underlying exposures, so that the portfolio can weather a range of macroeconomic conditions. But we don't spend time attempting to predict macroeconomic outcomes or left tailed events. In Keynes' two groups of forecasters, "those who don't know" and "those who don't know they don't know", we fall in the former category. The list of "unprecedented" events over the last two or three years have been a stark reminder of the limitations of predictions. We are often dealing with uncertainty, not neatly measurable probability. We think the best long-term protection against downturns is by buying quality companies, run by capable management, with strong balance sheets and not overpaying. The average age of our portfolio companies is more than 80 years - they are battle hardened and have proven resilient across many cycles. Our team has a better chance of developing insight into businesses, than predicting which way many macroeconomic variables may align at a point in time ― and then what market outcome may or may not occur as a result. You said you've seen opportunities in this environment. Can you tell us about those?In mid-March we were buying a U.S. tech company and a European luxury goods business. Before we had even disclosed the names of the new holdings, an observer commented the positioning changes were "brave" - which they meant not in the flattering U.S. sense of "that's courageous", but in the British sense of "are you insane?!" Of course, they weren't courageous, nor insane, decisions. We've followed both companies for years and have a high degree of confidence in the quality of the businesses and the sustainability of earnings growth over the long-term. We have waited years for the opportunity to invest at the right price. What were the two positions added?The luxury goods company is LVMH. The company has an extraordinary portfolio of brands, some hundreds of years old, and are well diversified by product and geography. We've owned it before (selling when the price got too far ahead of our valuation) and have always admired the company. So, when LVMH's share price declined 25% in just over a month, we welcomed the opportunity to invest. The tech company is Adobe, the dominant platform for the design of digital content. For many creatives, Adobe is as essential as Microsoft Office is for knowledge workers. Adobe has been growing its top line in the high teens, has extremely high incremental margins, approximately 90 per cent subscription revenues and we expect it will continue to grow EPS in the high teens. In the recent sell-off, the Adobe share price was down approximately 40 per cent from its peak, and at an attractive level relative to our assessment of value. In both cases, while their share prices have declined, the companies continue to perform exceptionally strongly, and tricky markets are usually when the discount to value opens up. What's the process for evaluating the purchase of these two companies?Our process is too detailed to go into here, but at a high level some of the key issues we focus on are:
How did you get comfortable to make these investments amid such uncertainty?The first two points are important in their own right for driving returns. However, buying great companies that have proven resilient through prior cycles also serves an important psychological purpose, which is sometimes overlooked. We need confidence in the ability of our companies to deliver on our earnings expectations, and in turn our valuations, to determine how much to pay and to not waiver when the opportunities present. Without that confidence, we place ourselves in a position where price falls (or rises) alone - rather than facts - are more likely to drive our view of a company's prospects. By bending to the market's view, we would be at risk of buying or selling at the wrong point, particularly when there are extreme price moves. Potentially, being our own worst enemy in undermining the power of compounding. And what if markets continue to decline?The discount to value may open up further and that's ok. We typically increase position sizes over time, rather than moving immediately to a full weight. We're not trying to pick the bottom; just ensure we earn a very healthy return on capital. That means not buying until there is a sufficient margin of safety. It also means making sure we don't go weak at the knees, and we do execute when the opportunity is there. If we do our job well, identifying great businesses and not overpaying, controlling overall portfolio exposure, compounding will take care of the rest over the long-term. We've discussed company risk but practically, how do you manage portfolio risk when you have a bottom-up focus?Put aside the differential calculus, practically, any sensible portfolio management is an attempt to deal with the two core risks: 1) losing money and 2) missing out. There's a spectrum of trade-offs in managing these two risks. Our primary objective is to preserve our clients, and our own, capital (i.e. avoid permanent capital losses); and then position for long-term compounding. Capital preservation is front of mind, so we prepare for a wide range of outcomes, not just the outcome we think is most likely. What we can control is portfolio exposure. We spend the majority of our time thinking about individual businesses, including their earnings drivers, risks, and likely resilience in a range of scenarios. We then construct the portfolio to limit exposure to specific types of risks. For example, we don't want all of our companies to be geared to interest rate rises, and then be wrong-footed if expectations reverse - we want a mix of earnings drivers. In our portfolio today, the earnings of companies such as CME Group, ADP and Aon will be likely beneficiaries of inflation and rate rises. Lowes, Nike and Ross Stores will likely face a headwind from higher interest rates, but that's OK, we don't want to get too far to one side of the boat and be hit by the wave no one saw coming. Author: Adam Chandler, Portfolio Manager Funds operated by this manager: |