
NEWS

16 Jun 2022 - Performance Report: Bennelong Australian Equities Fund
| Report Date | |
| Manager | |
| Fund Name | |
| Strategy | |
| Latest Return Date | |
| Latest Return | |
| Latest 6 Months | |
| Latest 12 Months | |
| Latest 24 Months (pa) | |
| Annualised Since Inception | |
| Inception Date | |
| FUM (millions) | |
| Fund Overview | |
| Manager Comments | The Bennelong Australian Equities Fund has a track record of 13 years and 4 months and has outperformed the ASX 200 Total Return Index since inception in February 2009, providing investors with an annualised return of 12.71% compared with the index's return of 10.09% over the same period. On a calendar year basis, the fund has only experienced a negative annual return once in the 13 years and 4 months since its inception. Over the past 12 months, the fund's largest drawdown was -24.06% vs the index's -6.35%, and since inception in February 2009 the fund's largest drawdown was -24.32% vs the index's maximum drawdown over the same period of -26.75%. The fund's maximum drawdown began in February 2020 and lasted 6 months, reaching its lowest point during March 2020. The fund had completely recovered its losses by August 2020. The Manager has delivered these returns with 1.46% more volatility than the index, contributing to a Sharpe ratio which has fallen below 1 five times over the past five years and which currently sits at 0.74 since inception. The fund has provided positive monthly returns 91% of the time in rising markets and 17% of the time during periods of market decline, contributing to an up-capture ratio since inception of 129% and a down-capture ratio of 99%. |
| More Information |

16 Jun 2022 - Why it's all about Earnings Growth
|
Why it's all about Earnings Growth Insync Fund Managers May 2022 Why it's all about Earnings Growth Companies that sustainably grow their earnings at high rates over the long term are called Compounders. Investing in a portfolio of Compounders is an ideal way to generate wealth for longer-term oriented investors that tend to also beat market averages with less risk. This chart shows the tight correlation between returns of the S&P 500 (orange line) and earnings growth (blue line) since 1926. NB: Grey bars are US recessions
Insync's focus is on investing in the most profitable businesses with long runways of growth resulting in a portfolio full of Compounders. Inflation & interest rate impacts By focusing on identifying businesses benefitting from megatrends with sustainable earnings growth, means we do not need to concern ourselves with market timing, economic growth forecasts, inflation, or the future of interest rates. Throughout the last 100 years we've experienced periods of high economic growth, recessions, different inflation and interest rate settings, wars, pandemics, crisis and on it goes, but the one thing that has remained consistent... Over the long term, share prices follow the growth in their earnings. Media and many market 'experts' continue to be concerned about the risk of a sustained period of higher inflation. They worry over a short-term 'rotation' from quality growth stocks of the type Insync seek to own to value stocks. The latter in many cases is simply taken as equating to lowly rated companies and reopening stocks, such as airlines, energy, and transport. There are 3 problems with this view that can trap investors:
In sharp contrast good businesses remain strong at this stage of the cycle. They continue delivering the earnings growth that propel share prices over the long term. This is what makes their share price progress both sustainable and well founded. High margins and superior pricing power from Insync's portfolio of 29 highly profitable companies across 18 global Megatrends offers "the holy grail" of inflation-busting companies. Pricing power, sound debt management and margin control allow great companies to handle inflation and interest rates well. LVMH and Microsoft (featured in October update) are portfolio examples that recently increased prices of their products with no impact on their sales growth. Profitability + Revenue Growth Short term, investors typically fret over interest rate rises and all growth stocks suffer initially, as they adopt an indiscriminate machine-gun approach to selling. Over time however, the more profitable businesses with strong revenue growth start to reassert their upward trajectory in their share prices, as investors appreciate their long-term consistent earnings power. Stocks with "quality growth" attributes, such as high returns on capital, strong balance sheets, and consistent earnings growth, have typically outperformed in past situations similar to what we face today (Mid-2014 through early 2016 and from 2017 through mid-2019. Source- Goldman Sachs).
This is in sharp contrast to stocks with strong revenue growth projections that also have negative margins or low current profitability. They are highly sensitive to changes in interest rates (These stocks propelled the short-term returns of many of the Growth funds in 2021). Many of them lack profit and cash flow, which doesn't give you much downside protection if they don't deliver. Many rely on the constant supply of new capital to fund their operations. These types of companies have very long durations because their present values are driven primarily by expectations of positive cash flows at a distant point in the future. We call this HOPE. As the saying goes; we don't rely on hope as a sound strategy. Stocks with valuations entirely dependent on future growth in the distant future are vulnerable to a dramatic drop in price if rates rise sharply or revenue growth expectations are reduced. This chart (performance of the Goldman Sachs Non-Profitable Tech Basket) shows the downside risk to this sector of unprofitable high revenue growth companies. The index has fallen by close to 40% from its peak in February 2021. The index consists of non-profitable US listed companies in innovative industries.
Unsurprisingly, popular "new era" stocks held by high growth managers have also suffered a similar fate with examples noted below.
Funds operated by this manager: Insync Global Capital Aware Fund, Insync Global Quality Equity Fund Disclaimer |


15 Jun 2022 - Performance Report: Airlie Australian Share Fund
| Report Date | |
| Manager | |
| Fund Name | |
| Strategy | |
| Latest Return Date | |
| Latest Return | |
| Latest 6 Months | |
| Latest 12 Months | |
| Latest 24 Months (pa) | |
| Annualised Since Inception | |
| Inception Date | |
| FUM (millions) | |
| Fund Overview | The Fund is long-only with a bottom-up focus. It has a concentrated portfolio of 15-35 stocks (target 25). The fund has a maximum cash holding of 10% with an aim to be fully invested. Airlie employs a prudent investment approach that identifies companies based on their financial strength, attractive durable business characteristics and the quality of their management teams. Airlie invests in these companies when their view of their fair value exceeds the prevailing market price. It is jointly managed by Matt Williams and Emma Fisher. Matt has over 25 years' investment experience and formerly held the role of Head of Equities and Portfolio Manager at Perpetual Investments. Emma has over 8 years' investment experience and has previously worked as an investment analyst within the Australian equities team at Fidelity International and, prior to that, at Nomura Securities. |
| Manager Comments | The Airlie Australian Share Fund has a track record of 4 years and therefore comparison over all market conditions and against its peers is limited. However, the fund has outperformed the ASX 200 Total Return Index since inception in June 2018, providing investors with an annualised return of 10.78% compared with the index's return of 8.65% over the same period. On a calendar year basis, the fund hasn't experienced any negative annual returns in the 4 years since its inception. Over the past 12 months, the fund's largest drawdown was -7.3% vs the index's -6.35%, and since inception in June 2018 the fund's largest drawdown was -23.8% vs the index's maximum drawdown over the same period of -26.75%. The fund's maximum drawdown began in February 2020 and lasted 9 months, reaching its lowest point during March 2020. The fund had completely recovered its losses by November 2020. The Manager has delivered these returns with 0.34% less volatility than the index, contributing to a Sharpe ratio which has fallen below 1 three times over the past four years and which currently sits at 0.7 since inception. The fund has provided positive monthly returns 97% of the time in rising markets and 13% of the time during periods of market decline, contributing to an up-capture ratio since inception of 106% and a down-capture ratio of 95%. |
| More Information |

15 Jun 2022 - Performance Report: Bennelong Kardinia Absolute Return Fund
| Report Date | |
| Manager | |
| Fund Name | |
| Strategy | |
| Latest Return Date | |
| Latest Return | |
| Latest 6 Months | |
| Latest 12 Months | |
| Latest 24 Months (pa) | |
| Annualised Since Inception | |
| Inception Date | |
| FUM (millions) | |
| Fund Overview | There is a slight bias to large cap stocks on the long side of the portfolio, although in a rising market the portfolio will tend to hold smaller caps, including resource stocks, more frequently. On the short side, the portfolio is particularly concentrated, with stock selection limited by both liquidity and the difficulty of borrowing stock in smaller cap companies. Short positions are only taken when there is a high conviction view on the specific stock. The Fund uses derivatives in a limited way, mainly selling short dated covered call options to generate additional income. These typically have less than 30 days to expiry, and are usually 5% to 10% out of the money. ASX SPI futures and index put options can be used to hedge the portfolio's overall net position. The Fund's discretionary investment strategy commences with a macro view of the economy and direction to establish the portfolio's desired market exposure. Following this detailed sector and company research is gathered from knowledge of the individual stocks in the Fund's universe, with widespread use of broker research. Company visits, presentations and discussions with management at CEO and CFO level are used wherever possible to assess management quality across a range of criteria. |
| Manager Comments | The Bennelong Kardinia Absolute Return Fund has a track record of 16 years and 1 month and has outperformed the ASX 200 Total Return Index since inception in May 2006, providing investors with an annualised return of 7.69% compared with the index's return of 6.42% over the same period. On a calendar year basis, the fund has experienced a negative annual return on 2 occasions in the 16 years and 1 month since its inception. Over the past 12 months, the fund's largest drawdown was -10.03% vs the index's -6.35%, and since inception in May 2006 the fund's largest drawdown was -11.71% vs the index's maximum drawdown over the same period of -47.19%. The fund's maximum drawdown began in June 2018 and lasted 2 years and 6 months, reaching its lowest point during December 2018. The fund had completely recovered its losses by December 2020. During this period, the index's maximum drawdown was -26.75%. The Manager has delivered these returns with 6.41% less volatility than the index, contributing to a Sharpe ratio which has fallen below 1 five times over the past five years and which currently sits at 0.64 since inception. The fund has provided positive monthly returns 87% of the time in rising markets and 32% of the time during periods of market decline, contributing to an up-capture ratio since inception of 16% and a down-capture ratio of 55%. |
| More Information |

15 Jun 2022 - Manager Insights | Magellan Asset Management
|
|
|
|
Damen Purcell, COO of FundMonitors.com, speaks with Chris Wheldon, Portfolio Manager at Magellan Asset Management. The Magellan High Conviction Fund has a track record of 8 years and 8 months. On a calendar year basis, the fund has only experienced a negative annual return once since its inception and has provided positive returns 88% of the time, contributing to an up-capture ratio for returns since inception of 83.03%.
|

15 Jun 2022 - Why "making dirty cleaner" is key to 2030
|
Why "making dirty cleaner" is key to 2030 Yarra Capital Management May 2022
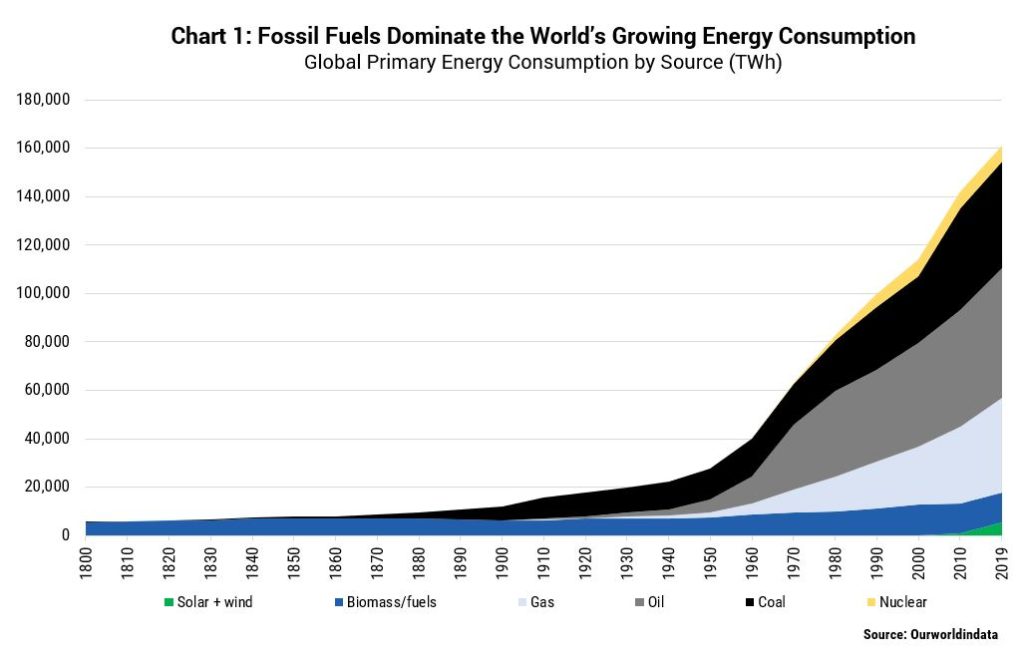
As Australia resets to a more ambitious 2030 emissions target under a new Labor government, it's time we address the largest opportunity on our pathway to net zero emissions: "making dirty cleaner". David Gilmour, Portfolio Analyst and ESG Specialist, details why. As Australia resets to a more ambitious 2030 emissions target under a new Labor government, it's time we address the largest opportunity on our pathway to net zero emissions: "making dirty cleaner". For too long, sustainability investment has centred on future facing industries, like renewables, and blatantly ignored the dirtiest industries. The focus has been on the cure to emissions, with no consideration to prevention. Divestment has been the weapon of choice. The Ukraine-Russia war has been a wake-up call. Fossil fuels, despite Western efforts to curb supply, are necessary for energy security when global trade is dividing into geopolitical blocks. What's more, they continue to dominate the world's growing demand for energy (Chart 1). To break their nexus with economic growth - and simultaneously transition without widening wealth inequality - we need to solve the demand side for both industry and the consumer. And that requires investor support and engagement.
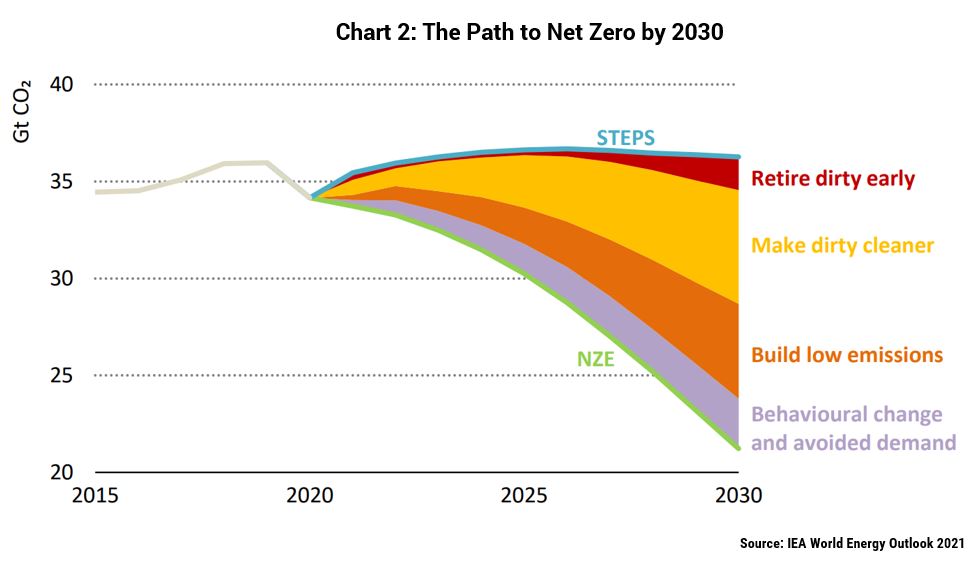
According to the International Energy Agency (IEA), we cannot simply divide energy investments into "clean" and "dirty". In fact, the largest part of emissions reductions under its net zero scenario - the same one purists cite when arguing to cease new fossil fuel production - comes from a middle ground of "transition" investments (Chart 2). Examples include project enhancements to reduce methane leakage, efficiency or flexibility measures in industrial processes, coal-to-gas switching (e.g. new gas boilers), refurbishments of power plants to support co-firing with low emissions fuels, and gas-fired plants that enable higher renewables penetration.
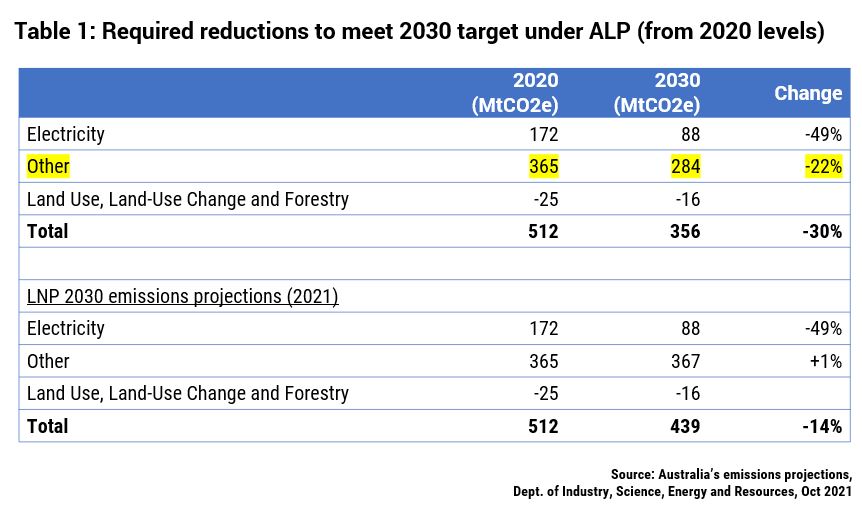
Within Goldman Sachs' latest forecast for a 37% fall in US emissions by 2030[1] (below the Biden Administration's target 50-52% reduction), energy efficiency is the first of three themes driving emissions lower over the short term. Outside Utilities, GS forecasts the biggest reductions to come from Oil & Gas Producers, Diversified Metals & Mining and Aluminium[2] - sectors where ownership by ESG focused investors is limited. Domestically it's a similar story. Like the US, Australia's electricity sector only accounts for around 30% of total emissions. Labor's new target for a 43% reduction on emissions to 2030 (based on 2005 levels) will require substantive efforts from Industry and Transport since, as we discussed last year, the Electricity sector is already stretched to its limit with a forecast 49% reduction by 2030 from today's levels. When you dig into the numbers, Labor's target equates to -30% on 2020 emissions levels, from 512MT today to 356Mt in 2030. This compares to the Coalition's projection for 439MT by 2030 (-14%) (Table 1). If we assume no further emissions reductions in the electricity sector under Labor, then it needs a -22% reduction in emissions from the "Other" sources, versus the Coalition's former forecast for +1%.
The new Federal government has also committed to strengthening the existing Safeguard Mechanism (SGM) to support its national target. Currently, Australia's largest emitting facilities (>100,000 tonnes per annum) have to purchase credits (ACCUs) when their emissions rise above generously set baselines. We support Labor's proposal to reduce these baselines over time which, if enacted, will drive greater energy efficiency and lowest-cost abatement solutions. Investors must also play an important role. We believe strongly in company engagement over exclusion; the former can lead to outperformance, while the latter shifts ownership to parts of the market with less oversight and deprives companies of capital when they need it most. That's why we are shareholders in high emitters such as Alumina (AWC), a company with a harder pathway to net zero but has the capability to benefit from the transition. AWC is already among the lowest emitters among major alumina producers, is pursuing early-stage technologies and is a clear beneficiary of green capex given the expected growth in demand for aluminium (39% demand growth to 2030[3]). We are also overweight Worley (WOR), which is well positioned to capture higher structural demand from energy transition work over and above its traditional work for the oil & gas industry. Once we solve the demand side, we expect supply from the oil & gas industry will take care of itself as customers evaporate. Until then Australian gas producers enjoy a privileged position. They are low sovereign risk for European countries weaning themselves off Russian gas, and will contribute significantly to lowering emissions in Asia as coal-to-gas switching takes place. Early this year we established a position in Woodside Petroleum (WPL), a company which predominantly produces gas and has a new strategy to invest $US5bn in new energy opportunities by 2030. Our focus remains on working with management to strengthen its 2030 interim target and lower its reliance on offsets. As ever, we continue to test the resolve of Australian companies to reduce their exposure to climate change risks and whether they are pursuing the right opportunities in the transition. Importantly, we have no intention of sidelining companies that provide critical products, especially when cleaning up their operations will cause the largest reductions in global emissions to a low carbon future. |
|
Funds operated by this manager: Yarra Australian Equities Fund, Yarra Emerging Leaders Fund, Yarra Enhanced Income Fund, Yarra Income Plus Fund [1] Source: Goldman Sachs: The path to lower US emissions, and what can drive impact, May 2022.
|


14 Jun 2022 - Performance Report: Laureola Australia Feeder Fund
| Report Date | |
| Manager | |
| Fund Name | |
| Strategy | |
| Latest Return Date | |
| Latest Return | |
| Latest 6 Months | |
| Latest 12 Months | |
| Latest 24 Months (pa) | |
| Annualised Since Inception | |
| Inception Date | |
| FUM (millions) | |
| Fund Overview | Life Settlements are resold life insurance policies and can be thought of as a form of finance extended to an individual backed by the person's life insurance policy. This financing is repaid upon maturity by collecting the death benefit from the insurance company. Risk mitigation measures implemented by Laureola include science-driven due diligence of policies, active monitoring of insured through a vertically integrated operation, and investor aligned fund design. |
| Manager Comments | The Laureola Master Fund has a track record of 9 years and has outperformed the Bloomberg AusBond Composite 0+ Yr Index since inception in May 2013, providing investors with an annualised return of 14.34% compared with the index's return of 2.7% over the same period. On a calendar year basis, the fund hasn't experienced any negative annual returns in the 9 years since its inception. Over the past 12 months, the fund's largest drawdown was -2.39% vs the index's -10.02%, and since inception in May 2013 the fund's largest drawdown was -4.9% vs the index's maximum drawdown over the same period of -10.29%. The fund's maximum drawdown began in December 2018 and lasted 10 months, reaching its lowest point during December 2018. The fund had completely recovered its losses by October 2019. During this period, the index's maximum drawdown was -0.98%. The Manager has delivered these returns with 1.83% more volatility than the index, contributing to a Sharpe ratio which has consistently remained above 1 over the past five years and which currently sits at 2.28 since inception. The fund has provided positive monthly returns 97% of the time in rising markets and 95% of the time during periods of market decline, contributing to an up-capture ratio since inception of 160% and a down-capture ratio of -195%. |
| More Information |
14 Jun 2022 - Performance Report: Collins St Value Fund
| Report Date | |
| Manager | |
| Fund Name | |
| Strategy | |
| Latest Return Date | |
| Latest Return | |
| Latest 6 Months | |
| Latest 12 Months | |
| Latest 24 Months (pa) | |
| Annualised Since Inception | |
| Inception Date | |
| FUM (millions) | |
| Fund Overview | The managers of the fund intend to maintain a concentrated portfolio of investments in ASX listed companies that they have investigated and consider to be undervalued. They will assess the attractiveness of potential investments using a number of common industry based measures, a proprietary in-house model and by speaking with management, industry experts and competitors. Once the managers form a view that an investment offers sufficient upside potential relative to the downside risk, the fund will seek to make an investment. If no appropriate investment can be identified the managers are prepared to hold cash and wait for the right opportunities to present themselves. |
| Manager Comments | The Collins St Value Fund has a track record of 6 years and 4 months and has outperformed the ASX 200 Total Return Index since inception in February 2016, providing investors with an annualised return of 17.87% compared with the index's return of 10.3% over the same period. On a calendar year basis, the fund hasn't experienced any negative annual returns in the 6 years and 4 months since its inception. Over the past 12 months, the fund's largest drawdown was -5.4% vs the index's -6.35%, and since inception in February 2016 the fund's largest drawdown was -27.46% vs the index's maximum drawdown over the same period of -26.75%. The fund's maximum drawdown began in February 2020 and lasted 7 months, reaching its lowest point during March 2020. The fund had completely recovered its losses by September 2020. The Manager has delivered these returns with 3.58% more volatility than the index, contributing to a Sharpe ratio which has only fallen below 1 once over the past five years and which currently sits at 0.98 since inception. The fund has provided positive monthly returns 84% of the time in rising markets and 65% of the time during periods of market decline, contributing to an up-capture ratio since inception of 79% and a down-capture ratio of 32%. |
| More Information |

14 Jun 2022 - Performance Report: 4D Global Infrastructure Fund
| Report Date | |
| Manager | |
| Fund Name | |
| Strategy | |
| Latest Return Date | |
| Latest Return | |
| Latest 6 Months | |
| Latest 12 Months | |
| Latest 24 Months (pa) | |
| Annualised Since Inception | |
| Inception Date | |
| FUM (millions) | |
| Fund Overview | The fund is managed as a single portfolio including regulated utilities in gas, electricity and water, transport infrastructure such as airports, ports, road and rail, as well as communication assets such as the towers and satellite sectors. The portfolio is intended to have exposure to both developed and emerging market opportunities, with country risk assessed internally before any investment is considered. The maximum absolute position of an individual stock is 7% of the fund. |
| Manager Comments | The 4D Global Infrastructure Fund has a track record of 6 years and 3 months and has outperformed the S&P Global Infrastructure TR (AUD) Index since inception in March 2016, providing investors with an annualised return of 9.97% compared with the index's return of 9.35% over the same period. On a calendar year basis, the fund has only experienced a negative annual return once in the 6 years and 3 months since its inception. Over the past 12 months, the fund's largest drawdown was -3.9% vs the index's -0.57%, and since inception in March 2016 the fund's largest drawdown was -19.77% vs the index's maximum drawdown over the same period of -24.67%. The fund's maximum drawdown began in February 2020 and lasted 2 years and 2 months, reaching its lowest point during September 2020. The fund had completely recovered its losses by April 2022. The Manager has delivered these returns with 0.52% less volatility than the index, contributing to a Sharpe ratio which has fallen below 1 four times over the past five years and which currently sits at 0.79 since inception. The fund has provided positive monthly returns 96% of the time in rising markets and 14% of the time during periods of market decline, contributing to an up-capture ratio since inception of 100% and a down-capture ratio of 96%. |
| More Information |

14 Jun 2022 - Record high inflation could trigger a fresh eurozone financial crisis
|
Record high inflation could trigger a fresh eurozone financial crisis Magellan Asset Management May 2022 Italy's 66th post-war government collapsed in January 2021 when Prime Minister Giuseppe Conte was forced to resign after former premier Matteo Renzi removed his minor Italia Viva party from the ruling coalition. President Sergio Mattarella encouraged the parties to revive the alliance so he could avoid calling a snap general election during a pandemic. But the talks went nowhere. As concerns grew that any election might usher right-wing populists into power, Mattarella pulled off a masterstroke. In early February, Mattarella unexpectedly contacted Mario Draghi; yes, 'Super Mario' who saved the euro in 2012 with his 'whatever it takes' comment. Mattarella asked the chief of the European Central Bank from 2011 to 2019 to begin talks to form a 'national unity' government. Within days, Draghi had won a parliamentary majority to become Italy's 29th prime minister since 1946 and its fourth unelected (or 'technocratic') premier since 1993.[1] Investors were pleased. On February 13 when Draghi assumed office, 'lo spread' - the yield at which Italian 10-year government bonds trade over their German equivalents, a number that is judged the bellwether of EU economic and political risks - had narrowed to a five-year low of just under 100 basis points. Draghi's government retains the confidence of investors yet lo spread has widened to 200 basis points (as the German 10-year bond topped 1% for the first time since 2015).[2] What malfunction occurred that widened the gap towards the 300 basis-point level that is seen by many as the tripwire for a crisis? None that was Draghi's fault. The culprit, like elsewhere in the world, is inflation. Eurozone inflation has climbed to its highest since the euro was created in 1999. Consumer prices surged 8.1% in the 12 months to May due to the ECB's promiscuous monetary policy, mammoth fiscal support during the pandemic, rising energy prices due to the switch to renewables, and supply blockages created by pandemic disruptions. The way Russia's war on Ukraine has boosted energy, commodity and food prices is likely to keep eurozone inflation elevated. The ECB has one objective; to maintain price instability, which is interpreted as keeping inflation below 2%. The central bank modelled on the inflation-hating Deutsche Bundesbank has little choice but to tighten monetary policy when inflation is nearly four times its target. Since 2016, the ECB's key rate has stood at 0%, while the overnight deposit rate has been negative since 2014 (and at a record minus 0.5% since 2019).[3] When the pandemic struck, the ECB added to various asset-buying programs[4] that gained heft when the bank first undertook quantitative easing in 2015. Over the past seven years, the central bank has purchased 3.9 trillion euros of eurozone assets, including 723 billion of Italian public debt, an amount equal to nearly 40% of Italy's GDP.[5] Given the record inflation, talk is mounting the ECB in July will raise rates for the first time since 2011, in what would be the first step towards boosting the key rate to a 'neutral' level of about 1.5% next year. The central bank is curtailing, and intends to end, its asset purchases.[6] Many central banks are raising key rates to tame inflation. For most countries, the main threat is the resultant slowing in economic growth boosts the jobless rate, perhaps to worrying levels if economies slump into recession. The ramifications of tighter monetary policy for the 19-member eurozone are wider and more concerning for three reasons. The first is the ECB is poised to stop acting as the buyer of last resort for its almost-bankrupt 'Club Med' members such as Italy, where gross government debt stood at 151% of GDP at the end of 2021.[7] No financier of government deficits (as some see it) for indebted sovereigns, especially Italy, will likely trigger a bond sell-off that puts the finances of debt-heavy governments on an unsustainable footing. Rising yields might restart the 'doom loop' that triggered the collapses of Greece, Ireland and Spain from 2010, whereby national bank bond holdings held as capital reserves plunge in value and the national government and commercial lenders become entwined in a downward spiral. The ECB would be exposed as lacking any credible way to quell such a government-bank suicide bind short of resuming the asset-buying that fuels the inflation it seeks to kill. The second way tighter ECB monetary policy is troubling is that the resultant economic downturn will remind indebted euro-users that they have no independent monetary policy to help their economies, nor a bespoke currency they can endlessly print to meet debt repayments, or devalue to export their way out of trouble. The only macro tool domestic policymakers possess is fiscal policy. The problem is many indebted governments are already running large fiscal deficits - Rome's shortfall over 2021 stood at 7.2% of GDP[8] and is forecast to be 6.0% in 2022[9] - and their debt loads mean these dearths can't be widened or prolonged. As talk mounts that indebted countries should quit the euro to reinstall the other macro tools, populist Italian politicians are bound to rekindle plans for a parallel currency as the least traumatic way for Italy to readopt the lira. The third means by which higher inflation is poisonous for the eurozone is that it creates a fissure between the area's creditor and debtor nations that would make it harder to find durable solutions for the euro. Inflation-phobic but inflation-ridden Germany and other creditors such as Finland and the Netherlands will squabble with France (government debt at 113% of GDP), Greece (193%), Italy, Portugal (127%) and Spain (118%) over how far the ECB should go to rein in inflation. The leaders of the creditor countries will be under domestic political pressure to ensure the ECB smothers inflation. They will battle with debtor leaders over how the ECB might support tottering governments and wobbly national banks sitting atop troubled economies. In line with this hawk-dove split, the Netherlands central bank chief Klaas Knot in July became the first ECB policy-board member to call for the bank to raise its key rate by 50 basis points to tackle inflation.[10] To maintain its inflation-fighting credentials, the ECB must raise interest rates enough to tame inflation, even if that stance crushes economic growth. The core concern of such tight monetary policy is that it will expose how the euro's flawed structure - that it is a currency union without the necessary political, fiscal or banking unions - has become explosive due to the large debts of southern eurozone governments. To be sure, policymakers are likely to once again thrash out some last-minute fudge that defers a denouement on the euro's fate. But temporary solutions are only, well, temporary and the euro needs a durable resolution. The indebted south could win the political tussle such that the ECB never makes a serious attempt to tame inflation. Due to generous pandemic support, creditor nations have higher government debt-to-GDP ratios - Germany's is 69%, the Netherland's 52%. They thus might tolerate faster inflation as it improves their debt ratios if their economies hold up. But that path might only delay tighter monetary policy and subsequent detonations. The war in Ukraine might undermine eurozone economic growth enough to quell inflation without the ECB doing much. The cost of servicing public debt, while rising, is still historically low, which reduces the likelihood of missed debt payments and a crisis. Eurozone governments are restarting efforts to create a proper banking union, which would mean common bank rules and eurozone, rather than national support for troubled banks.[11] But creditor nations don't want to be part of a mutual deposit insurance scheme if that means subsidising Italian banks holding Rome's debt. Nor do debtor governments want to join a banking union that could restrict their banks buying their bonds to support them. Lo spread is well short of the post-euro record 556 basis points it reached in 2011 during the first eurozone crisis that was triggered by the current-account imbalances among members.[12] But Rome's debt was only 120% of GDP then, and that gap narrowed only due to ECB support that is now waning because the problem today is inflation, not skewed trade and investment flows. Germany's economic slump and dislike of inflation will ensure Berlin pressures the ECB to prioritise inflation. Lo spread could widen enough to threaten a flawed currency union, especially if member countries are squabbling over solutions. While Draghi the central banker could bluff investors, Draghi the politician has no similar obvious masterstroke. Of note too is that Draghi's prime ministership will likely end when Italy holds a general election next year in Europe's spring that is likely to usher right-wing eurosceptics into power. To all the world's problem, be prepared to add elevated doubt about the euro's long-term future. The currency swap In 1948, Chris Howland was a 20-year British private who was the most popular radio DJ in northern Germany. On the night of June 17, two British military policemen appeared at the radio station in Hamburg where Howland worked. They made Howland sit up all night before allowing him at 6.30 am to open a sealed envelope and read the content on air. The news? The military government of Britain, France and the US from June 20 would introduce a new currency. Every German would receive 40 new Deutsche marks, which had been printed in the US and shipped in wooden crates stamped 'Doorknobs', in exchange for 60 Reichsmarks. Any other swastika-emblazoned Reichsmarks people held were made worthless come June 21.[13] A 'currency reform' of some sort was expected. But still. It's estimated that 95% of Reichsmarks were destroyed without replacement and savers were left with only 6.5% of their assets. The instantaneous currency switch and savings savaging were at the heart of measures under the Marshall Plan designed to revive Germany's economy at a time when millions of Germans were starving, inflation was rife, the currency untrusted and bartering prevalent. The steps, which in the absence of Russian knowledge sparked the Berlin Blockade,[14] worked. The economic revival in the French, UK and US zones that became West Germany was credited with helping Germany adopt a new constitution in 1949 known as the Basic Law. The currency changeover on top of the rampant post-war inflation and the hyperinflation of the early 1920s left a legacy. Germans adopted a mentality that the value of the Deutsche mark must be protected above all. This job was given to the Bundesbank when it was established in 1957 as the world's first and only central bank still to be granted independence under its country's constitution (whereas other central banks are granted 'independence' through acts of parliament or the goodwill of the executive).[15] Come 1993, Germany's Constitutional Court confirmed that under the Basic Law the Bundestag (parliament) only had the authority to ratify the Maastricht Treaty that created the euro if the European monetary union was in Germany's interest. The test? "The future European currency must be and remain as stable as the Deutsche mark," the court decreed.[16] Thus the ECB ended up with the same primary objective as the Bundesbank; namely, to maintain price stability. In Germany, the ECB's loose monetary setting and the inflation unleashed are seen as a betrayal. To the German public, tabloid media and even the German 'father of the euro' Otmar Issing, the ECB is modelled more on Italy's economic mismanagement pre-euro (when Rome's main policy response was to devalue the lira). Issing, the ECB's first chief economist, said the ECB has "lived in a fantasy" that downplayed the danger of inflation and thus the bank "has contributed massively to this trap in which it is now caught".[17] The ECB lax stance has wiped out returns on German savings, which is seen as income foregone to subsidise lazy southern Europeans.[18] High inflation stings Germans because few invest in equities or other 'growth' assets that might act as a hedge against inflation. Most German savings head to small regional savings and co-operative banks that offer low deposit rates. The German public is unlikely to feel more generous towards the indebted south if interruptions to energy and other imports from Russia send the German economy into recession.[19] But, as pessimism grows about global prospects, the economic outlook of inflation-tolerant and Russian-gas-dependent Italy is dimming too. Although Italy's economy is supported by consumer savings built up during lockdowns and 192 billion euros from the EU's 750-billion-euro Covid recovery fund, higher energy prices and other tremors from the Ukraine war could slow growth enough to send the country into recession.[20] Many fret about the trouble to be ignited when the ECB halts its asset buying, given how precarious are Rome's finances - the country has the largest budget deficit in the eurozone and the worst public debt ratio after Greece (193%).[21] In case of any crisis centred on Italy, policymakers have options such as loans from the EU rescue fund and linked ECB bond purchases of struggling members. But such aid would require approval from Germany's Bundestag and other creditor-nation parliaments. Another option is the one revealed when Draghi and French President Emmanuel Macron signed a joint letter last December that implicitly called for the transfer of all eurozone government debt since 2007 to a debt-management agency. But Germany and many other euro members would oppose such subterfuge.[22] It's probable that sometime soon the talents of Draghi the unelected politician and other policymakers will be tested. Lo spread will reveal what bond investors think. What's unlikely in any upcoming crisis, however, is any solution that cements the euro's future. By Michael Collins, Investment Specialist |
|
Funds operated by this manager: Magellan Global Fund (Hedged), Magellan Global Fund (Open Class Units) ASX:MGOC, Magellan High Conviction Fund, Magellan Infrastructure Fund, Magellan Infrastructure Fund (Unhedged), MFG Core Infrastructure Fund [1] In 1993, Bank of Italy Governor Carlo Azeglio Ciampi was drafted as prime minister. At the height of the sovereign debt crisis in 2011, Mario Monti, who'd spent a decade at the European Commission, was appointed PM. In 2018, rival populist parties tapped Conte, a law professor at a university in Florence, to be PM. A list of Italian prime ministers can be found at: wikipedia.org/wiki/List_of_prime_ministers_of_Italy[2] The gravest scare for investors during Draghi's time as prime minister occurred in January this year when Italy's parliament failed to elect a new president in seven ballots held over a week and Draghi was touted as the next head of state (and seemed interested in the role). But that would have once again meant a snap general election that might have jetted right-wing populist parties into power. That outcome was avoided when MPs re-elected Mattarella even though the 80-year-old had rejected a second term. Important Information: This material has been delivered to you by Magellan Asset Management Limited ABN 31 120 593 946 AFS Licence No. 304 301 ('Magellan') and has been prepared for general information purposes only and must not be construed as investment advice or as an investment recommendation. This material does not take into account your investment objectives, financial situation or particular needs. This material does not constitute an offer or inducement to engage in an investment activity nor does it form part of any offer documentation, offer or invitation to purchase, sell or subscribe for interests in any type of investment product or service. You should read and consider any relevant offer documentation applicable to any investment product or service and consider obtaining professional investment advice tailored to your specific circumstances before making any investment decision. A copy of the relevant PDS relating to a Magellan financial product or service may be obtained by calling +61 2 9235 4888 or by visiting www.magellangroup.com.au. Past performance is not necessarily indicative of future results and no person guarantees the future performance of any strategy, the amount or timing of any return from it, that asset allocations will be met, that it will be able to be implemented and its investment strategy or that its investment objectives will be achieved. This material may contain 'forward-looking statements'. Actual events or results or the actual performance of a Magellan financial product or service may differ materially from those reflected or contemplated in such forward-looking statements. This material may include data, research and other information from third party sources. Magellan makes no guarantee that such information is accurate, complete or timely and does not provide any warranties regarding results obtained from its use. This information is subject to change at any time and no person has any responsibility to update any of the information provided in this material. Statements contained in this material that are not historical facts are based on current expectations, estimates, projections, opinions and beliefs of Magellan. Such statements involve known and unknown risks, uncertainties and other factors, and undue reliance should not be placed thereon. Any trademarks, logos, and service marks contained herein may be the registered and unregistered trademarks of their respective owners. This material and the information contained within it may not be reproduced, or disclosed, in whole or in part, without the prior written consent of Magellan. |