
NEWS

5 Aug 2022 - Origin ramps up investment in cleaner energy sources
|
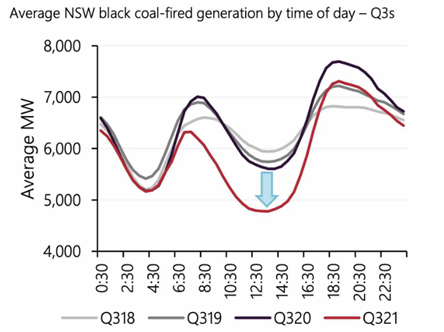
Origin ramps up investment in cleaner energy sources Tyndall Asset Management May 2022 Origin Energy recently announced the early closure of its Eraring Power Station. This will reduce Origin's carbon emissions, whilst allowing the company to focus on obtaining low or no emission sources to replace capacity. As an operator of a coal-fired electricity generator, Origin Energy is one of Australia's largest carbon emitters. While the company has long positioned itself to transition to clean electricity generation, the absence of policy direction from successive Federal Governments has seen this transition evolve more slowly than expected. As State Governments have taken the lead on energy policy, the transition is now progressing apace. Despite reducing its emissions by c16% over the FY20 and FY21, Origin remains a significant carbon emitter. Data from the Clean Energy Regulator's National Greenhouse and Energy Reporting indicates that Origin was the fourth largest carbon emitter in FY21 (on a combined scope one and two basis). Notably, the top three are other coal-fired generators. Of the company's c17mt CO2-e of scope 1&2 emissions in FY21, 86% of these emissions come from the Eraring Power Station. On February 15th, Origin Energy announced that it had informed the Australian Energy Market Operator of its intention to close Eraring in August 2025 - the earliest possible closure date given the required 3.5-year notice period. While the closure of a coal-fired generator has obvious significant environmental benefits, there are social impacts to consider. Accelerated renewable capacity undermines the economics of baseload generators. The company explained that the reason for the accelerated closure was in part attributable to the economic impact of growing renewable penetration in the National Electricity Market (NEM). Renewable generation, particularly solar, is most productive in the middle of the day. Growing volumes of generation from renewable sources have seen demand for grid electricity decline in the middle of the day. Electricity prices at these times fall to low or even negative levels. Further, the NSW Government's Electricity Infrastructure Roadmap will drive an acceleration in the supply of renewable energy that will likely drive average prices lower still.
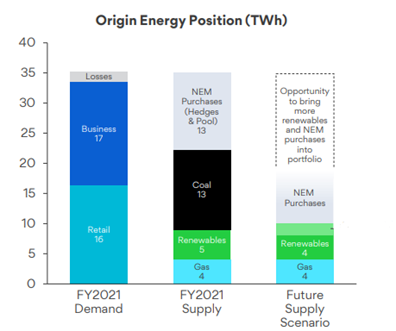
Source: AEMO, Renew Economy Increasing renewable volumes are reducing demand for coal-fired generation in the middle of the day. The low or negative prices in the middle of the day result in financial losses for baseload generators like Eraring. Baseload generators rely on higher prices during the peak and shoulder periods of the day to recoup losses and generate an adequate return. Unfortunately, the introduction of capacity from Snowy 2.0 in the latter part of this decade may also pressure these peak and shoulder prices, further undermining the financial sustainability of baseload generators. A significant reduction in Origin's emissions profile will result over time When Eraring is closed, the company's scope 1 emissions will fall by an estimated 95%. How far the combined scope 1&2 emissions fall remains to be seen and will be dependent upon the sources of energy Origin accesses to replace the Eraring volumes. The company has highlighted several potential sources of capacity that will compensate for the loss of Eraring and a number of these are low or no emission sources. These include a proposed 700MW battery at Eraring, the additional renewable assets being added to the NEM, the potential expansion of the Shoalhaven pumped hydro project, and Snowy Hydro capacity. Additionally, the ambition to orchestrate 2GW through a virtual power plant provides further flexibility in the form of additional firming and demand management.
Source: Origin Energy Ultimately, while purchases of coal-fired generation from the pool will remain a feature for some time, Tyndall expects Origin will deliver ongoing reductions in emissions intensity following the closure of Eraring. Importantly, over time we expect that this improving environmental footprint and leadership in the transition to clean energy will be reflected in Origin's share price with a progressive re-rating of the stock. Social impacts front of mind for Origin While the early closure of Eraring provides significant environmental benefits, this development will also have a material social impact on Origin's workforce and the local community. The labour force directly impacted includes 240 Origin employees as well as several independent contractors that work at Eraring from time to time. On average, there are c200 contractors on-site on any given day. The workforce includes administration workers, multi-skilled engineers, boilermakers, and electricians. We would note that many of these skills have application outside of the generation industry. Origin is highly cognisant of the implications for these workers and their families and recognises the role Origin must play in ensuring a just and equitable transition for them. Importantly, Origin intends to support its workers with reskilling and career support. The broad principles to apply here are individualised consideration of needs and preferences, in full awareness that different workers will have different priorities. The company will seek to transfer personnel within Origin where possible. Where this is not possible, Origin will assist in identifying external opportunities. Recognising the heightened impact the closure may have on apprentices, their needs will be prioritised. The company has also stated that it will continue its existing community support programs such as local sponsorships and the relocation of the Myuna Bay Sport and Recreation Centre. Further, Origin has committed to invest $5m in local community support over the decade to 2032. Our discussions with the company around these issues reinforce our belief that Origin operates with a high level of integrity. The company is acutely aware of the role it needs to play in ensuring that the energy transition is an equitable one for all the various stakeholders, including those employees that will be significantly impacted. Environmentally compelling, socially aware In conclusion, the early closure of the Eraring Power Station is a net positive for Origin shareholders in our view. We expect the market to reward the declining carbon emissions intensity over time. While the impact on the community and workforce is unfortunate, we note that Origin's intended efforts to retrain and repurpose its staff highlights the integrity with which the company behaves and the importance it attaches to its social licence to operate. Author: Tim Johnston, Deputy Head of Equities Funds operated by this manager: Tyndall Australian Share Concentrated Fund, Tyndall Australian Share Income Fund, Tyndall Australian Share Wholesale Fund Important information: This material was prepared and is issued by Yarra Capital Management Limited (formerly Nikko AM Limited) ABN 99 003 376 252 AFSL No: 237563 (YCML). The information contained in this material is of a general nature only and does not constitute personal advice, nor does it constitute an offer of any financial product. It does not take into account the objectives, financial situation or needs of any individual. For this reason, you should, before acting on this material, consider the appropriateness of the material, having regard to your objectives, financial situation, and needs. The information in this material has been prepared from what is considered to be reliable information, but the accuracy and integrity of the information is not guaranteed. Figures, charts, opinions and other data, including statistics, in this material are current as at the date of publication, unless stated otherwise. The graphs and figures contained in this material include either past or backdated data, and make no promise of future investment returns. Past performance is not an indicator of future performance. Any economic or market forecasts are not guaranteed. Any references to particular securities or sectors are for illustrative purposes only and are as at the date of publication of this material. This is not a recommendation in relation to any named securities or sectors and no warranty or guarantee is provided. |

4 Aug 2022 - Faster than forecast: digitisation acceleration
|
Faster than forecast: digitisation acceleration Insync Fund Managers July 2022 Whilst we focused on this exciting megatrend and Accenture last year, things are moving even faster than forecast and so a revisit is timely. Accenture is a prime holding for this megatrend and thus remains in the Insync portfolio. In their recent earnings call, they announced a very strong demand environment. This has induced double-digit growth in all parts of their business and also across all their markets, industries and services. Many of their clients are embarking upon bold transformation programs, often spanning multiple parts of their enterprise in an accelerated time frame. Macro-economics have little impact on these companies spend on digitisation. These clients recognize the need to transform almost all of their businesses, meshing technology, data and AI and with new ways of working and delivering their product or service to market. Current market gyrations have not changed the trajectory of our identified megatrends (including this one) in the Insync portfolio. Our companies such as Accenture continue to grow profitably at multiples many times that of GDP.
Insync's intense focus on the fundamentals, investing in businesses like Accenture that are compounding their earnings at high rates, gives us confidence that the portfolio is well positioned to deliver strong returns as volatility in markets subside. Stocks held by Insync possess:
Funds operated by this manager: Insync Global Capital Aware Fund, Insync Global Quality Equity Fund Disclaimer |


4 Aug 2022 - Half-year in review: is the worst over?
|
Half-year in review: is the worst over? Loftus Peak 22 July 2022 Global sharemarkets changed direction abruptly in mid-November 2021, with the trigger the 'hot' US inflation reading for October - it rose to +6.2% year-over-year, almost guaranteeing the US Federal Reserve would raise rates to prevent the number going higher (which it did). It got worse. The Russian invasion of Ukraine put upward pressure on commodities: disruptions in oil, grain, fertilisers and some chemicals added new anxiety to a world still recovering from COVID supply shortages. Indeed, Shanghai remained in lockdown until last month. There is good news in the bad news - rising costs and tight supply are pushing prices to unacceptable heights for businesses and consumers, which of itself is slowing the economy and reducing upward pressure on interest rates. As monetary policy tightened investors bailed out of cashflow-negative, longer-dated growth stocks. These companies, exposed as they are to an intentionally-slowed economy, declined in value materially. Without profitability today, the market is anticipating that such companies will be forced to find new funding with fresh debt or equity - but of course at significantly higher cost to existing shareholders, which is pushing valuations down further. Sharemarket indices dropped by -20% to -30%, but many former sharemarket stars were down by -50% to -90%. There was safety in quality, relatively, with the Loftus Peak portfolio outperforming the "concept" stocks, as the chart below shows. The market punished companies that were not profitable
Source: Goldman Sachs, Loftus Peak. Data in AUD, indexed to 100 as at 30/06/21 For the 12 months to 30 June 2022, the value of the Fund dropped -23.3%, with most of this confined to the second half. This was underperformance of -14.7% relative to the benchmark MSCI All Countries World Index (net) as expressed in AUD from Bloomberg. The Fund closed out the month down -6.9% net-of-fees, which was underperformance of -2.1% against the benchmark. Roku and Netflix, also hit in the second half, were among the worst performers, and cut -3.9% and -3.3% from Fund value respectively over the twelve months. Amazon cut -2.2%, Google -2.1% and Microsoft -1.2%, while AMD's negative contribution was -2.1% with Taiwan Semiconductor (-1.5%) and Nvidia (-0.8%) also off. Qualcomm, the Fund's largest position, cut -3.4% from the value of the Fund. Streamers unspoolNetflix and Roku are two former market darlings needing neither debt or equity capital but which nevertheless were treated as if they did. The streamers, together, were the largest negative for the Fund in the financial year to 30 June 2022. And yet it is difficult to find any informed industry participant who does not believe that all TV will be streamed by decade's end. Indeed, in 2022 streaming eclipsed cable TV in popularity across the US , as reflected in the chart below.
Source: Roku Company Filing, Nielsen That streaming companies, which thrived in lockdowns only to stall when restrictions are lifted, has little bearing on pivotal questions around their room for growth at the expense of linear TV. We believe Roku's and Netflix's penetration has not reached saturation with both having differentiated but solid medium- to long-term growth paths. Chip stocks weak, for nowThe Fund has held investments in semiconductor companies including Qualcomm, Nvidia, Xilinx, AMD and Taiwan Semiconductor over a number of years. We invested because these companies are foundational to the disruption economy, though they do not command the same valuations as software-driven companies such as Facebook, Netflix and Google, which, along with many others, have boomed as applications for the networked, streamed economy were turbo-charged by the smartphone. But in this tougher economic environment, when growth multiples are under pressure, the semiconductor stocks have provided significant shelter, while the outlook for them has materially improved as their usage, across virtually all industries (either directly or indirectly) increases. For example, one very important announcement barely noted by financial markets was that Apple had failed to meet the deadline for the 2023 rollout of its own 5G modems in its newest phones. This is important because Apple's failure was preceded just two years earlier by that of the titan Intel to produce the same part - meaning that Qualcomm will continue to be the 5G supplier through 2023. Qualcomm's technological superiority, coupled with its financial strength, create a formidable moat ensuring growth for several years for its 5G business. We hold Qualcomm not just for the phone business, but for the significant diversification it has engineered relative to its position a few years ago.
Source: Qualcomm Company Filings Qualcomm's automotive revenues in the most recent quarter were up +61% on the prior year period, as the performance requirements of and higher demand for automobile intelligence is necessitating a huge increase in chip usage. The company's connected IoT (Internet of Things) business was up +41%. Even Qualcomm's 'mature' smartphone business showed growth of +56% year-over-year, driven by its dominance in 5G. Another of the Fund's holdings, AMD, also has a sizeable moat - built by besting the incumbent, Intel (which the Fund does not hold) in the area of low power, high performance chips for the most discerning of end markets, data-centres - which, according to McKinsey & Co, represent the single largest and fastest-growing end market for semiconductors globally. Why does McKinsey say this? Because datacentres are the hardware on which cloud computing runs, an evolving megatrend brimming with promise as the convergence point for the miscellany of remote work, connected supply chains, networks and more. These are areas targeted by Taiwan Semiconductor and Nvidia, which have, unsurprisingly, constructed formidable moats of their own, using deep pools of capital amassed by years of excellence in product execution. This is technology and disruption, to be sure, and not the commoditised kind, either. The Blue Sky in the CloudMegacaps Amazon, Google, Microsoft, Tencent and Alibaba form part of the Fund's cloud exposure. It is possible that these cloud businesses may one day eclipse the legacy businesses of their parent companies (especially true of Amazon and Amazon Web Services). Information technology in business globally is moving to the cloud, but it is only a fraction of the way there. Building a cloud business isn't for the faint of heart - it is a scale game requiring tens of billions of dollars of investment. This has led to a few large players reaping most of the rewards to date, which we expect to continue given the capital requirements. These companies now represent 73% of the global cloud infrastructure market by revenue. Amazon alone accounted for almost half, while Microsoft had the largest market share growth. Silicon's cousin - the power semi-conductorBeyond all this, the roll-out of electric vehicles along with increasing use of wind and solar power are driving the development of new specialised componentry for electrification known as power semis, typically silicon carbide. ON Semiconductor is a major player here, and is critical to the supply of componentry that facilitates this power transfer. How to grow an AppleServices - not just products - are a keystone of Apple's future growth. The services business, including Apple TV+, Apple Music, Apple Fitness+, Apple news+ and more notched double the annual revenue growth of the products business in the March quarter. One of these services, Apple Pay, is expanding quickly, and only a few weeks ago moved into the buy-now pay later space. The chart below tells the story of Apple's services businesses now accounting for almost 35% of gross profit, compared with 17% in 2016.
Source: Apple Company Filings Looking aheadWe understand the market's concerns about recession and what that might mean for consumers and businesses. However disruption and the associated long-term secular trends continue through even the worst periods of recession. It is for this reason, along with the quality of our holdings, that we believe the companies held by the Fund are well positioned for any short-term economic headwinds and more importantly, for the medium and long term. Funds operated by this manager: |


3 Aug 2022 - Investment Perspectives: REITs and navigating the inflation panic

1 Aug 2022 - Spotlight Video|Small-Caps
|
Small-Caps FundMonitors.com July 2022 |
|
David Franklyn, Chief Investment Officer & Fund Manager at Argonaut Funds Management together with Robert Gregory, Founder and Portfolio Manager at Glenmore Asset Management, and Rodney Brott, CEO & Executive Director of DS Capital shared their thoughts regarding the Small-Cap market, its primary drivers and what opportunity it can provide. Funds operated by this manager: Argonaut Natural Resources Fund, Glenmore Australian Equities Fund, DS Capital Growth Fund
|

1 Aug 2022 - Advisers will look to platform providers for Consumer Duty support
|
Advisers will look to platform providers for Consumer Duty support abrdn June 2022
Seven in ten (73%) advisers are aware of the proposed regulations, with a quarter (25%) entirely unaware. Awareness is highest among those working in networked firms (75%), and lowest among those at firms with restricted direct authorisation (69%). If the rules - a final version of which are expected to be published by the FCA in July - were implemented as proposed, nearly half (46%) of advisers with an understanding of the requirements would turn to their platform provider for support with implementing the new rules. Just over two in five (44%) would rely on internal resources, while a further two in five (39%) would engage their external compliance provider. When asked about the anticipated impact of Consumer Duty on their firms' own operations, more than half (54%) of advisers expected their organisation would need to make procedural changes to comply. Just under half (46%) expected their firms would need to take on additional resource to comply - with those working in directly authorised businesses (50%) most likely to expect the need for further hiring. Meanwhile, just over two fifths (44%) expected to see overhead costs increase. Those in networked businesses least expected to see a financial impact (35%), rising to more than half (51%) of advisers in directly authorised firms. Alastair Black, Head of Industry Change, abrdn, said: "Consumer Duty will be a big step change for advisers when it comes into force next year. It's clear that the majority of advisers are already reviewing what it means for their business, and are anticipating the need to change processes, procedures, and even hire, to ensure they are aligned. "At its core, Consumer Duty is about good governance, which will touch on all parts of firms' operations. With this in mind, it's encouraging to see that advisers will be turning to a range of sources to aid their compliance efforts, including their third-party partners. "Consumer Duty is essentially advocating good customer outcomes which is already at the heart of everything an advice firm does. So, while it's encouraging to see firms considering its implications, the change may not be as big as some fear. "However, there are a number of important steps all firms will need to take. For some this will be similar to implementing the SMCR (Senior Managers and Certification Regime) where there was no clear documentation and rationale to follow. For example, there are some elements that may be new for some advice firms, like documenting how they determine their advice service and charge is good value for money. "The insight, and support, of suppliers - whether its platform technology, or otherwise - that understand the regulations, and what it might mean for individual businesses, will be hugely valuable to delivering the outcomes the new regulation aims to achieve." As the publication of the final Consumer Duty rules approaches, abrdn's research also explored where firms saw challenges when it came to the adoption of new regulation in general. Advisers most frequently pointed to a lack of understanding of new requirements as their biggest hurdle (26%), with a quarter (25%) citing the financial pressure of increased overhead costs. A further quarter (25%) said they lacked capacity within their business to support new regulation's administrative burden, while just over one in five (23%) said they struggled with implementation deadlines being too tight. Alastair Black added: "Regulation needs to evolve to ensure that advisers, and their clients, remains supported and protected. But we know that adapting - particularly to major changes - takes significant amounts of time and resource. "Working with the right third-party partners, with right experience and expertise, can help advisers move at pace to tackle the knowledge barrier, reduce the cost of implementation and ease capacity pressures - ultimately enabling advisers to spend more of their valuable time on doing more for their clients." |
|
Funds operated by this manager: Aberdeen Standard Actively Hedged International Equities Fund, Aberdeen Standard Asian Opportunities Fund, Aberdeen Standard Australian Small Companies Fund, Aberdeen Standard Emerging Opportunities Fund, Aberdeen Standard Ex-20 Australian Equities Fund (Class A), Aberdeen Standard Focused Sustainable Australian Equity Fund, Aberdeen Standard Fully Hedged International Equities Fund, Aberdeen Standard Global Absolute Return Strategies Fund, Aberdeen Standard Global Corporate Bond Fund, Aberdeen Standard International Equity Fund , Aberdeen Standard Life Absolute Return Global Bond Strategies Fund, Aberdeen Standard Multi Asset Real Return Fund, Aberdeen Standard Multi-Asset Income Fund |

29 Jul 2022 - Hedge Clippings |29 July 2022
|
|
|
|
Hedge Clippings | Friday, 29 July 2022
It's all doom and gloom on the inflation / interest rate / recession front, and at least the newly installed Treasurer isn't pulling any punches. One could be cynical and say "why should he" when he can genuinely claim no responsibility, and can also point to the fact that compared with data from the US and Europe, and just about everywhere else in the world, relatively speaking we're all in the same boat - even possibly traveling better than most. Dr. Chalmers is correct in saying most of the inflationary pressures are external, and is sensibly hosing down expectations from some quarters for wage rises. Provided the wage/price spiral doesn't take hold, inflation will get worse - but not much worse, and interest rates will rise further - but in our view not much more - simply because the economy, and property in particular, is so leveraged to any rate rise after they've been so low for so long. Which of course is part of the problem. The sad news is we're all going to have to get used to it, and discretionary spending is going to suffer. Unfortunately for those without the luxury of discretionary cash to spend in the first place, that's going to be tough. Parliament got down to business again this week and it didn't take long for the newly installed opposition to do what we suppose to do - namely oppose everything and anything the government's trying to do, even if Peter Dutton did look stupid when doing so. Luckily Scomo wasn't there, as that would have been a further distraction, and probably more than a little embarrassing for him, although we somehow think his hide is thick enough that he wouldn't care. Scomo was overseas warning against the approach and rise of China's influence in the Pacific, and the reaction to his comments is likely to be insignificant if Nancy Pelosi lands in Taiwan. Mr. Xi doesn't like losing face, and one would imagine the US can't afford to back down either, so our only advice is to look out! Turning to the performance of managed funds, hopefully a less contentious subject and one we know a little more about than diplomacy. An article in today's AFR, with a misleading headline "10 reasons fund managers underperform" when in fact the list was 10 reasons investors underperform. In our experience, the reasons many investors underperform is that they choose the wrong fund manager, or don't diversify sufficiently. Maybe we're being a little pedantic, as the sub-editors role is to write a headline to grab the reader's attention - which in our case, it did. According to the AFR article, and based on a US data set of 2,000 funds, only 32% of funds outperformed their benchmark in FY2021, and only 33% outperformed over 5 years. As far as AFM's dataset of Australian funds is concerned, 65% of Equity funds outperformed the ASX200 total return over 1 year, 64% over 3 years, falling to 48% over 5 years. As we always point out, averages are dangerous - if your head's in the freezer, and feet in the oven, your temperature is probably average. The challenge is choosing the right manager - or as above, diversifying across managers, strategy, sector, and asset class. The other important factor is that different funds and their respective strategies perform differently in different market conditions, and investing in managed funds is a long(er) term exercise. This week's video interview with three equity managers - David Franklyn from Argonaut (resources), Rob Gregory from Glenmore, and Rodney Brott from DS Capital (both small to mid cap equity managers) is a case in point in a market which is down 10% YTD, and 6.5% over 12 months. Whether the market has factored in the bad news Dr. Chalmers is alluding to or not only time will tell, but it's worth noting that markets tend to move ahead of, not behind the economy. News & Insights Small-Caps | Spotlight Video Investment Perspectives: REITs and navigating the inflation panic | Quay Global Investors Faster than forecast: digitisation acceleration | Insync Fund Managers |
|
|
June 2022 Performance News |
|
|
If you'd like to receive Hedge Clippings direct to your inbox each Friday
|

29 Jul 2022 - Performance Report: ASCF High Yield Fund
| Report Date | |
| Manager | |
| Fund Name | |
| Strategy | |
| Latest Return Date | |
| Latest Return | |
| Latest 6 Months | |
| Latest 12 Months | |
| Latest 24 Months (pa) | |
| Annualised Since Inception | |
| Inception Date | |
| FUM (millions) | |
| Fund Overview | Does not require full valuations on loans <65% LVR. Borrowing rates are from 12% per annum on 1st mortgage loans and 16% per annum on 2nd mortgage/caveat loans. Pays investors between 5.55% - 6.25% per annum depending on their investment term. |
| Manager Comments | The ASCF High Yield Fund has a track record of 5 years and 4 months and has outperformed the Bloomberg AusBond Composite 0+ Yr Index since inception in March 2017, providing investors with an annualised return of 8.6% compared with the index's return of 1.09% over the same period. On a calendar year basis, the fund hasn't experienced any negative annual returns in the 5 years and 4 months since its inception. Over the past 12 months, the fund hasn't had any negative monthly returns and therefore hasn't experienced a drawdown. Over the same period, the index's largest drawdown was -12.13%. Since inception in March 2017, the fund's largest drawdown was 0% vs the index's maximum drawdown over the same period of -12.4%. The Manager has delivered these returns with 3.77% less volatility than the index, contributing to a Sharpe ratio which has consistently remained above 1 over the past five years and which currently sits at 23.03 since inception. The fund has provided positive monthly returns 100% of the time in rising markets and 100% of the time during periods of market decline, contributing to an up-capture ratio since inception of 87% and a down-capture ratio of -78%. |
| More Information |

29 Jul 2022 - Is it time to hit the 'buy' button?
|
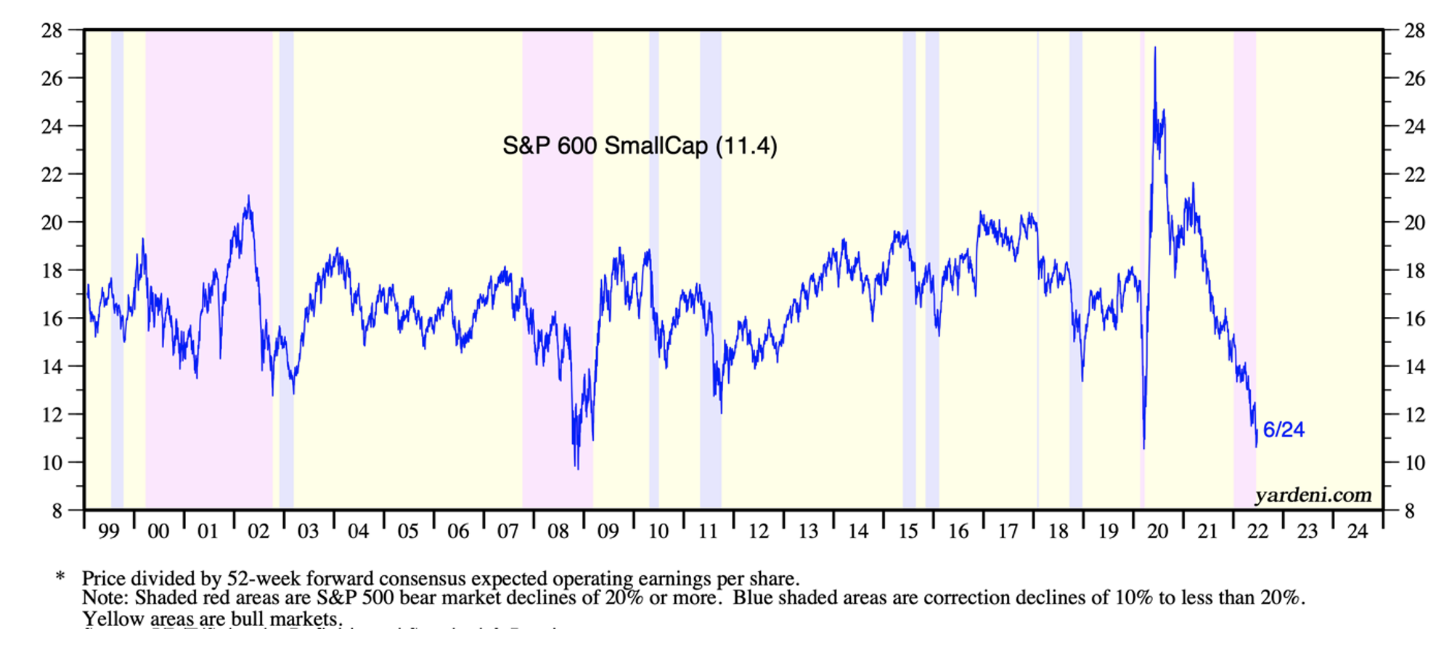
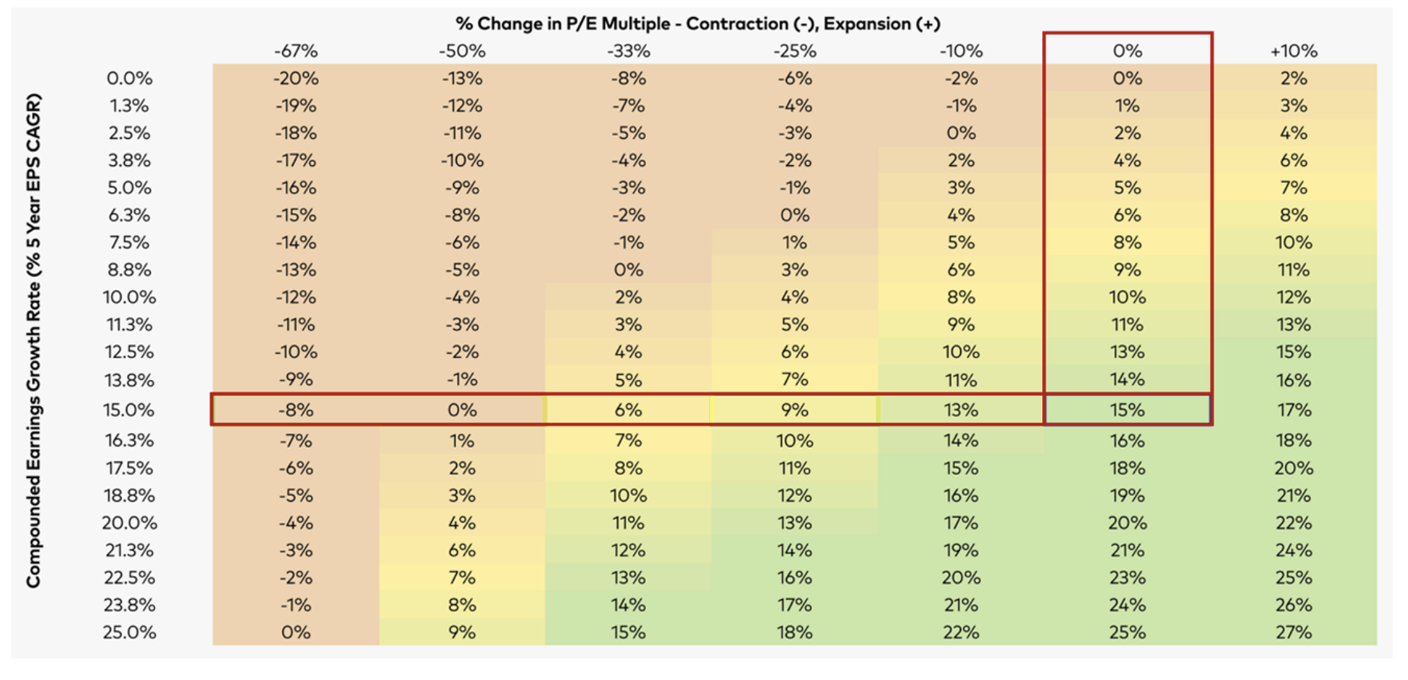
Is it time to hit the 'buy' button? Montgomery Investment Management 11 July 2022 If there's one investing axiom to hang your hat on, it's this: the lower the price you pay, the better your returns over the longer term. With the price-to-earnings (P/E) ratios of many high-quality businesses compressing, I, therefore, think it's time for long-term investors to buy while so many others are fearful. P/E ratios have compressed materially and quickly. Most of the compression is due of course to rising bond yields, which in turn are a response to inflation concerns. But in some cases, some of the P/E compression can be attributable to rising earnings. Keep the latter point in mind. Let's talk about a bear marketA bear market is a 20% slide from its peak but at the point of a bear market, investors make a 25% return just from the market returning to its previous high. If the market falls 50%, investors who buy at the trough make 100% just from the market recouping its losses and returning to previous highs. The lower the price one pays, the higher the return. Looking at every bear market (fall of 20% or more) since WWII, the average length of time it takes for the S&P500 to reach its nadir is 12 months and the average decline is 32.7%. Finally, the average length of time it has taken for the S&P500 to return to its previous high is a further 21 months. At the time of writing, the S&P500 is at 3900 points, down 19% from its high of 4818.63 recorded on 4 January 2022. The index has been as low as 24% below its all-time high. If the market played to the historical averages (unlikely) the S&P500 would fall to 3242 points (down 32.7% from its high, and another 11.5% from its recent low) on 4 January 2023. It would then reacquire its previous high of 4818.62 on 6 October 2024. While the averages are unlikely to be repeated (the events create the averages not the other way around) what is interesting is an investor who buys the S&P500 index today at 3900 would generate a return of 23.5% over the next two years, three months and eight days. That's equivalent to 9.75% per annum if the market were to follow the averages. And it is also only applicable to the index. As we aren't in the business of buying indices, rather we seek to own individual companies, the above 'analysis' is only useful in that history offers encouragement the market will reacquire its previous highs, eventually. Investing in individual companiesEncouraged by the prospect of an eventual broader market recovery we can now examine the arithmetic of investing in individual companies. First, if I buy a share on 10 times the earnings per share (EPS) of the company - a Price to Earnings (P/E) ratio of 10 times - and sell the shares on the same P/E ratio in a future year, and EPS grow at 15%, then my annual return will be 15%, the same as the earnings per share growth rate. It matters not what the P/E ratio is, if they are the same at the time of acquisition and disposal, my return will equal the EPS growth rate achieved by the company. Second, as Figure 1 illustrates, the P/E ratio reflects the bipolar nature of markets. Frequently market sentiment swings to reflect popularity for equities, and equally frequently sentiment reverts to being depressed and despondent with P/E ratios correspondingly slumping. Figure 1. PEs reflect the bipolar nature of market sentiment
Source: Yardeni Research Inc. P/E ratios are a measure of popularity. The more popular equities are, the higher the multiple of earnings investors are willing to pay and therefore, the higher the P/E ratio. When equities are unpopular, the lower the multiple of earnings investors are willing to pay. We can take advantage of this bipolar behaviour by focusing buying activity around periods when sentiment, as reflected by P/E ratios, is depressed. We can also take encouragement, from the reliable bipolar market behaviour, that P/Es will eventually reflect buoyant optimism again. And further encouragement comes again from the arithmetic of EPS growth and P/E compression and expansion. I have published Table 1. previously but it is worth dwelling upon again. Table 1. PE compression v. PE expansion
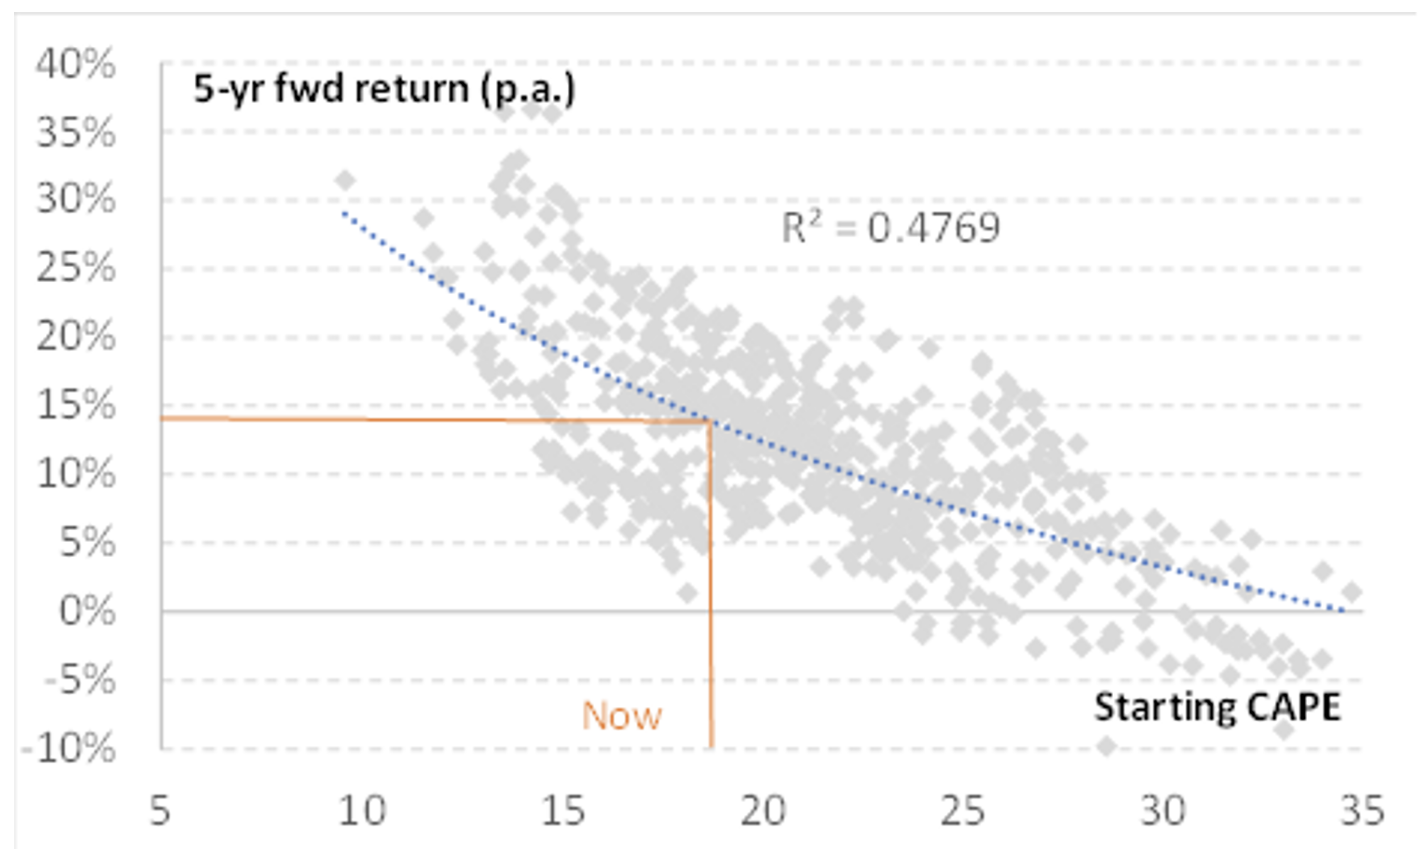
The vertical axis represents various levels of earnings per share growth. The 15% row assumes the purchase of shares in a company whose earnings per share grows at 15% per annum for five years. The column headings across the top represent the change in the P/E ratio at the end of the five-year period. The 15% and the 0% column interest at 15%. Purchasing shares in a company whose earnings per share grows at 15% per annum, will return 15% per year to the investor if the P/E ratio does not change. The intersection of the 15% row and the -25% column is 9%. Nine per cent is the annual return to the investor, over five years, from buying shares in a company whose earnings per share grow at 15% per annum and the P/E ratio declines by a quarter and fails to recover over the five years. You will see a 0% return is received where the 15% row intersects with the column representing a P/E contraction of 50%. Buying a share of a company growing its EPS by 15% per annum over five years, produces a nil return when the P/E ratio falls by half and stays there. The investor would also have to hold the shares for the five years to break even. But a nine per cent return is received, even if the P/E ratio halves when shares are purchased in a company able to grow earnings by 25% per year. The best chance of attractive returnsIt should be apparent by now buying shares in companies able to compound earnings at high rates over a long period, offers the best chance of attractive returns even if the popularity of shares were to collapse and remain in the doldrums. But as we have previously noted, this is unlikely. PE ratios reflect popularity which swings frequently and reliably. Figure 2. ASX Cyclically adjusted PE (CAPE) five year forward return (dot plots)
Finally, stockbroker MST has conducted a historical analysis of returns from Australian shares based on the P/E at which the investment was made. It is clear from the data, the axiom referred to earlier - the higher the price one pays, the lower the return and vice versa - holds true. A higher starting P/E produces a lower return. Regression analysis of historical returns (note my comments about averages) reveals paying today's P/E ratio should result in a return over the subsequent five years of approximately 15% per annum. The range of historical returns at the current P/E however is five per cent to 25% per annum. In any case, history and math are on the side of the long-term investor brave enough to invest when others are fearful, as they are today. Author: Roger Montgomery, Chairman and Chief Investment Officer Funds operated by this manager: Montgomery (Private) Fund, Montgomery Small Companies Fund, The Montgomery Fund |
28 Jul 2022 - Semiconductors: The Next Big Opportunity?
|
Semiconductors: The Next Big Opportunity? Loftus Peak July 2022 Interest rate hikes, inflation, geopolitical tension… Portfolio Manager Anshu Sharma discusses semiconductors (chips) and why we think they are so important over the next three to five years.
Funds operated by this manager: |