
NEWS

28 May 2019 - Performance Report: Bennelong Concentrated Australian Equities Fund
| Report Date | |
| Manager | |
| Fund Name | |
| Strategy | |
| Latest Return Date | |
| Latest Return | |
| Latest 6 Months | |
| Latest 12 Months | |
| Latest 24 Months (pa) | |
| Annualised Since Inception | |
| Inception Date | |
| FUM (millions) | |
| Fund Overview | The overriding objective of the Concentrated Australian Equities Fund is to seek investment opportunities which are under-appreciated and have the potential to deliver positive earnings, while satisfying our stringent quality criteria. Bennelong's investment process combines bottom-up fundamental analysis together with proprietary investment tools which are used to build and maintain high quality portfolios that are risk aware. The portfolio typically consists of 20-35 high-conviction stocks from the S&P/ASX 300 Index. The Fund may invest in securities listed on other exchanges where such securities relate to ASX-listed securities. Derivative instruments are mainly used to replicate underlying positions and hedge market and company specific risks. |
| Manager Comments | The Bennelong Concentrated Australian Equities Fund rose +3.40% in April, outperforming the ASX200 Accumulation Index by +1.03% and taking annualised performance since inception in February 2009 to +16.34% versus the Index's +10.65%. The Fund's up-capture and down-capture ratios since inception, +139% and 91% respectively, highlight the Fund's capacity to outperform over the long-term regardless of the market's direction. As at the end of April, the Fund's weightings had been increased in the Consumer Staples, Industrials, IT, Communication and Financials sectors, and decreased in the Discretionary, Health Care, Materials and REIT's sectors. The Fund's top holdings include CSL, BHP Billiton and Aristocrat Leisure. The Fund aims to invest in a concentrated portfolio of high quality companies with strong growth outlooks and underestimated earnings momentum and prospects. The data in the table below from the latest monthly report demonstrate that the Fund is in line with its investment objectives;
|
| More Information |


27 May 2019 - Performance Report: Insync Global Capital Aware Fund
| Report Date | |
| Manager | |
| Fund Name | |
| Strategy | |
| Latest Return Date | |
| Latest Return | |
| Latest 6 Months | |
| Latest 12 Months | |
| Latest 24 Months (pa) | |
| Annualised Since Inception | |
| Inception Date | |
| FUM (millions) | |
| Fund Overview | Insync employs four simple screens to narrow the universe of over 40,000 listed companies globally to a focus group of high quality companies that it believes have the potential to consistently grow their profits and dividends. These screens are size of the company, balance sheet performance, valuation and dividend quality. Companies that pass this due diligence process are then valued using dividend discount models, free cash flow yield and proprietary implied growth and expected return models. The end result is a high conviction portfolio of typically 15-30 stocks. The principal investments will be in shares of companies listed on international stock exchanges (including the US, Europe and Asia). The Fund may also hold cash, derivatives (for example futures, options and swaps), currency contracts, American Depository Receipts and Global Depository Receipts. The Fund may also invest in various types of international pooled investment vehicles. At times, Insync may consider holding higher levels of cash if valuations are full and it is difficult to find attractive investment opportunities. When Insync believes markets to be overvalued, it may hold part of its resources in cash, or use derivatives as a way of reducing its equity exposure. Insync may use options, futures and other derivatives to reduce risk or gain exposure to underlying physical investments. The Fund may purchase put options on market indices or specific stocks to hedge against losses caused by declines in the prices of stocks in its portfolio. |
| Manager Comments | Of the Fund's top 10 holdings, equating to about 60% of the portfolio, the strongest returns came from Walt Disney (+22.7%) and Facebook (+15), while the weakest performers were Intuit (-5%) and Amadeus IT (-1.1%). The Fund's top holdings as at the end of April included Visa, Intuit, Walt Disney, Accenture, Facebook, Tencent Holdings, Booking Holdings, Amadeus IT, Adobe and Zoetis. |
| More Information |

24 May 2019 - Performance Report: Wheelhouse Global Equities Income Fund
| Report Date | |
| Manager | |
| Fund Name | |
| Strategy | |
| Latest Return Date | |
| Latest Return | |
| Latest 6 Months | |
| Latest 12 Months | |
| Latest 24 Months (pa) | |
| Annualised Since Inception | |
| Inception Date | |
| FUM (millions) | |
| Fund Overview | To pursue this objective, the Investment Manager is responsible for actively managing, monitoring and tailoring the integration of derivative contracts alongside the Morningstar Portfolio, while taking into account changing market and stock specific conditions. The Investment Manager is responsible for maximising the structural benefits of short option positions (lowered Volatility, improved capital preservation, higher income generation), whilst mitigating, minimising and monitoring the structural negatives (variable market exposure, option expiries, collateral management and asymmetric return profiles). In addition, long derivatives positions are also used to enhance the capital preservation characteristics of the Fund in more extreme market movements. As a consequence of the integration of Derivatives, returns of the strategy, intra-cycle, are expected to vary from the underlying Morningstar Portfolio due to these characteristics. For example in weak markets, or in extended sideways markets, the Fund is expected to outperform relative to the Morningstar Portfolio. Conversely in strong positive markets the Fund is expected to underperform. |
| Manager Comments | Top contributors included Disney, ServiceNow, Microsoft, United Technologies Corp and Guidewire Software. Detractors included Amgen, Intel, Pfizer, Zimmer Biomet and Roche. The Fund is designed to deliver equity returns with higher income generation and active downside protection. The strategy's high income generation and active tail risk program are designed to lower risk and deliver equity returns with a smoother, more retiree-friendly return profile. As a result, Wheelhouse intend for returns to add relative value in weak and low-growth markets and to drag in more positive markets. |
| More Information |

24 May 2019 - Performance Report: Quay Global Real Estate Fund
| Report Date | |
| Manager | |
| Fund Name | |
| Strategy | |
| Latest Return Date | |
| Latest Return | |
| Latest 6 Months | |
| Latest 12 Months | |
| Latest 24 Months (pa) | |
| Annualised Since Inception | |
| Inception Date | |
| FUM (millions) | |
| Fund Overview | The Fund will invest in a number of global listed real estate companies, groups or funds. The investment strategy is to make investments in real estate securities at a price that will deliver a real, after inflation, total return of 5% per annum (before costs and fees), inclusive of distributions over a longer-term period. The Investment Strategy is indifferent to the constraints of any index benchmarks and is relatively concentrated in its number of investments. The Fund is expected to own between 20 and 40 securities, and from time to time up to 20% of the portfolio maybe invested in cash. The Fund is $A un-hedged. |
| Manager Comments | The largest contributors were Safestore (US Storage), Hysan (HK Diversified) and Unite (UK Student Accommodation). Detractors were Scentre (Aust Malls), LEG Immobilien (German Apartments) and Ventas (US Healthcare). During April many of the Fund's US investees reported their 1Q19 results. Quay noted the results are pleasing for all of their investees and represent a continuing trend of robust operating fundamentals against the backdrop of a healthy US economy. |
| More Information |

23 May 2019 - Performance Report: Frazis Fund
| Report Date | |
| Manager | |
| Fund Name | |
| Strategy | |
| Latest Return Date | |
| Latest Return | |
| Latest 6 Months | |
| Latest 12 Months | |
| Latest 24 Months (pa) | |
| Annualised Since Inception | |
| Inception Date | |
| FUM (millions) | |
| Fund Overview | The manager follows a disciplined, process-driven, and thematic strategy focused on five core investment strategies: 1) Growth stocks that are really value stocks; 2) Traditional deep value; 3) The life sciences; 4) Miners and drillers expanding production into supply deficits; 5) Global special situations; The manager uses a macro overlay to manage exposure, hedging in three ways: 1) Direct shorts 2) Upside exposure to the VIX index 3) Index optionality |
| Manager Comments | Top contributors included Carvana, Afterpay, Stanmore Coal, Amazon and Facebook. Detractors included Aurelia Metals, Bluebird Bio, iQiyi, Oxford Biomedica and the Fund's short book. Frazis noted that as the portfolio rallied this year (+23% YTD) they have been steadily increasing their short positions in structurally flawed sectors. These shorts were increased further in the first week of May. In the latest report the manager gives a brief summary of the Fund's structural shorts. Frazis say their portfolio is positioned more conservatively than ever. |
| More Information |

23 May 2019 - Performance Report: Loftus Peak Global Disruption Fund
| Report Date | |
| Manager | |
| Fund Name | |
| Strategy | |
| Latest Return Date | |
| Latest Return | |
| Latest 6 Months | |
| Latest 12 Months | |
| Latest 24 Months (pa) | |
| Annualised Since Inception | |
| Inception Date | |
| FUM (millions) | |
| Fund Overview | The investment process involves a combination of top-down analysis with fundamental bottom-up qualitative and quantitative research to derive a risk-adjusted discounted cash flow (DCF) valuation of companies in the target universe. The investment team will generally buy stocks from the pool of securities that are trading below Loftus Peaks' valuation and sell them when they are trading above Loftus Peak's valuation. The approach allows for both fundamental accounting information as well as market-oriented inputs to be factored into the portfolio construction process. Loftus Peak's model typically does not rely on leverage to deliver investment returns and specifically takes into account risk in the valuation process. Capital preservation can be managed by holding up to 50% cash. Index and currency options and futures may also be used to manage risk. |
| Manager Comments | Top contributors in April included Qualcomm, Microsoft and Apple. Detractors included Anritsu, Tesla and Xilinx. Loftus Peak remain confident in Xilinx's long-term strategy, especially as the world increases demand for faster processing. They noted the Fund's cash levels are increasing as they continue to take profits on positions to which they deployed cash in December. The Australian dollar depreciated -0.92% over the month against the US dollar, which meant the value of the Fund's US dollar positions increased. As at 30 April 2019, the Fund carried a foreign currency exposure of 99%. |
| More Information |

23 May 2019 - Performance Report: Glenmore Australian Equities Fund
| Report Date | |
| Manager | |
| Fund Name | |
| Strategy | |
| Latest Return Date | |
| Latest Return | |
| Latest 6 Months | |
| Latest 12 Months | |
| Latest 24 Months (pa) | |
| Annualised Since Inception | |
| Inception Date | |
| FUM (millions) | |
| Fund Overview | The main driver of identifying potential investments will be bottom up company analysis, however macro-economic conditions will be considered as part of the investment thesis for each stock. |
| Manager Comments | Top contributors in April included Jumbo Interactive (+32.7%), NRW Holdings (+24.4%), Magellan Financial Group (+22.5%), Stanmore Coal (+16.4%), Pinnacle Investment Management (+15.1%), Charter Hall Education Trust (+7.2%) and Bravura Solutions (+5.5%). Detractors included Mastermyne (-7.5%) and Atlas Arteria (-3.0%). Glenmore noted the strong rally in equities in 2019 has resulted in valuations in a number of the Fund's key stocks becoming less attractive, resulting in the Fund's holdings in those stocks being trimmed. They added that, despite the lessening valuation appeal, their positive short and medium-term view on the earnings outlook has led to them maintaining a holding in these stocks. |
| More Information |

22 May 2019 - Performance Report: DS Capital Growth Fund
| Report Date | |
| Manager | |
| Fund Name | |
| Strategy | |
| Latest Return Date | |
| Latest Return | |
| Latest 6 Months | |
| Latest 12 Months | |
| Latest 24 Months (pa) | |
| Annualised Since Inception | |
| Inception Date | |
| FUM (millions) | |
| Fund Overview | The investment team looks for industrial businesses that are simple to understand; they generally avoid large caps, pure mining, biotech and start-ups. They also look for: - Access to management; - Businesses with a competitive edge; - Profitable companies with good margins, organic growth prospects, strong market position and a track record of healthy dividend growth; - Sectors with structural advantage and barriers to entry; - 15% p.a. pre-tax compound return on each holding; and - A history of stable and predictable cash flows that DS Capital can understand and value. |
| Manager Comments | The DS Capital Growth Fund rose +5.76% in April, outperforming the ASX200 Accumulation Index by +3.39% and taking annualised performance since inception in December 2012 to +15.13% versus the Index's +10.10%. This return has been achieved with an annualised volatility of 7.33% versus the Index's 11.13%. The Fund's Sharpe and Sortino ratios, 1.71 and 3.51 respectively, by contrast with the Index's Sharpe ratio of 0.75 and Sortino ratio of 1.09, highlight the Fund's capacity to achieve superior risk-adjusted returns whilst avoiding the market's downside volatility. Regarding the activity of a few of the Fund's holdings over the month:
DS Capital's view is that with the uncertainty of the Australian Federal Election behind us investors will focus on global and domestic economic conditions and related interest rates. They believe softer economic growth will maintain pressure on interest rates that have fallen since October 2018, deferring a return to higher rates that seemed likely just six months ago. While lower interest rates are theoretically favourable for equity markets, they add, weaker economic conditions can make it more difficult for businesses to grow earnings. They noted this was evident in the recent reporting season which, together with a recent lift in share prices, gives DS Capital cause for caution. They expect continuing volatility from the US-China trade tensions. Post reporting season company meetings, DS Capital have compiled a shopping list of businesses that they would like to own or add to their current holdings. They are seeing new opportunities and have a current cash holding of 20%. They noted they will take these opportunities sparingly. |
| More Information |

22 May 2019 - Performance Report: 4D Global Infrastructure Fund
| Report Date | |
| Manager | |
| Fund Name | |
| Strategy | |
| Latest Return Date | |
| Latest Return | |
| Latest 6 Months | |
| Latest 12 Months | |
| Latest 24 Months (pa) | |
| Annualised Since Inception | |
| Inception Date | |
| FUM (millions) | |
| Fund Overview | The fund will be managed as a single portfolio of listed global infrastructure securities including regulated utilities in gas, electricity and water, transport infrastructure such as airports, ports, road and rail as well as communication assets such as the towers and satellite sectors. The portfolio is intended to have exposure to both developed and emerging market opportunities, with country risk assessed internally before any investment is considered. The maximum absolute position of an individual stock is 7% of the fund. |
| Manager Comments | The strongest portfolio performer in April was global port operator DP World (+25%). The weakest performer was Brazilian toll road operator Ecorodovias (-15.4%). 4D noted that, despite a slowing global macro environment, it remains in positive territory and supportive of the Fund's bias towards user pay assets which have a direct correlation to macro. They also believe with Fed rate hikes stalled, emerging markets should see a recovery. However, they remain cautious of ongoing geo-political issues and have positioned accordingly. |
| More Information |
21 May 2019 - Performance Report: Bennelong Australian Equities Fund
| Report Date | |
| Manager | |
| Fund Name | |
| Strategy | |
| Latest Return Date | |
| Latest Return | |
| Latest 6 Months | |
| Latest 12 Months | |
| Latest 24 Months (pa) | |
| Annualised Since Inception | |
| Inception Date | |
| FUM (millions) | |
| Fund Overview | The Bennelong Australian Equities Fund seeks quality investment opportunities which are under-appreciated and have the potential to deliver positive earnings. The investment process combines bottom-up fundamental analysis with proprietary investment tools that are used to build and maintain high quality portfolios that are risk aware. The investment team manages an extensive company/industry contact program which helps identify and verify various investment opportunities. The companies within the portfolio are primarily selected from, but not limited to, the S&P/ASX 300 Index. The Fund may invest in securities listed on other exchanges where such securities relate to the ASX-listed securities. The Fund typically holds between 25-60 stocks with a maximum net targeted position of an individual stock of 6%. |
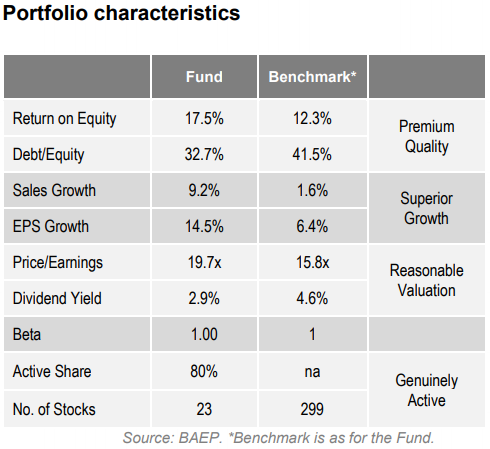
| Manager Comments | As at the end of April, the Fund's weightings had been increased in the Discretionary, Consumer Staples, IT, Industrials and Financials sectors, and decreased in the Health Care, Materials and REIT's sectors. The Fund aims to invest in high quality companies with strong growth outlooks and underestimated earnings momentum. By comparison with the ASX300 Accumulation Index, the Fund's holdings, on average, have a higher Return on Equity and lower Debt/Equity (Premium Quality), higher sales growth and higher EPS growth (Superior Growth), and higher Price/Earnings and lower dividend yield (Reasonable Valuation). This indicates that the Fund's portfolio is in line with Bennelong's objective. |
| More Information |