
NEWS

15 Jul 2025 - 10k Words | July 2025
|
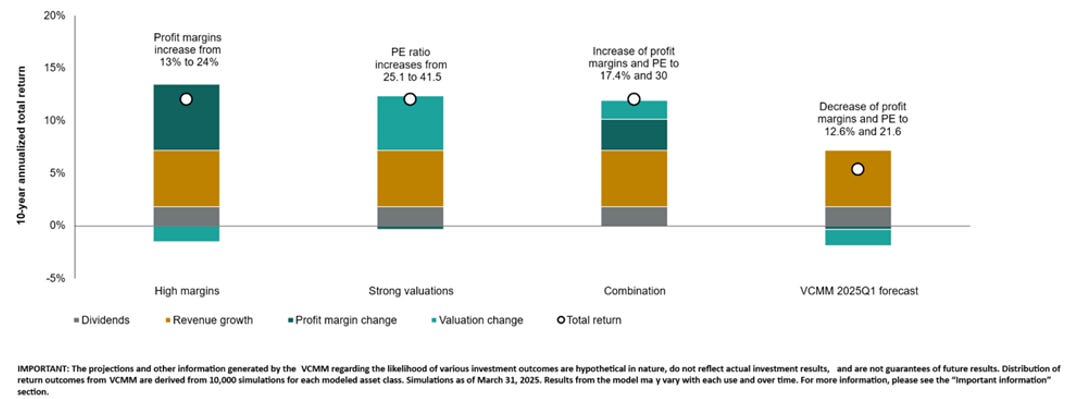
10k Words Equitable Investors July 2025 Apparently, Confucius did not say "One Picture is Worth Ten Thousand Words" after all. It was an advertisement in a 1920s trade journal for the use of images in ads on the sides of streetcars... We get a bit fixated on US equity valuations, with Vanguard highlighting the high hurdles required to achieve another decade of >12% returns; even as the 10 year bond yield has been more competitive and tariffs drive negative earnings revisions in the US. The Ex-US equities world has been fairing better out of the tariff scenario. We check in on interest rate expectations in the US and Australia. Bain bemoans a softer global buyout environment lately while The Information tackles the private market liquidity problem graphically. Finally, the US office CMBS delinquency rate charts near-vertical while Aussie mortgage arrears have been on the rise. Total market cap of S&P 500 firms >10x Price/Sales (US$ trillion)
Source: Kailash Capital Research Repeat of returns >12% for US equities requires record-high profit margins, record-high valuations, or a combination of both
Source: Vanguard S&P 500 Price/Free Cash Flow (cap weighted and equal weighted) v index level
Source: Fidelity US 10-year government bond yield
Source: FRED Consensus S&P 500 earnings by calendar year
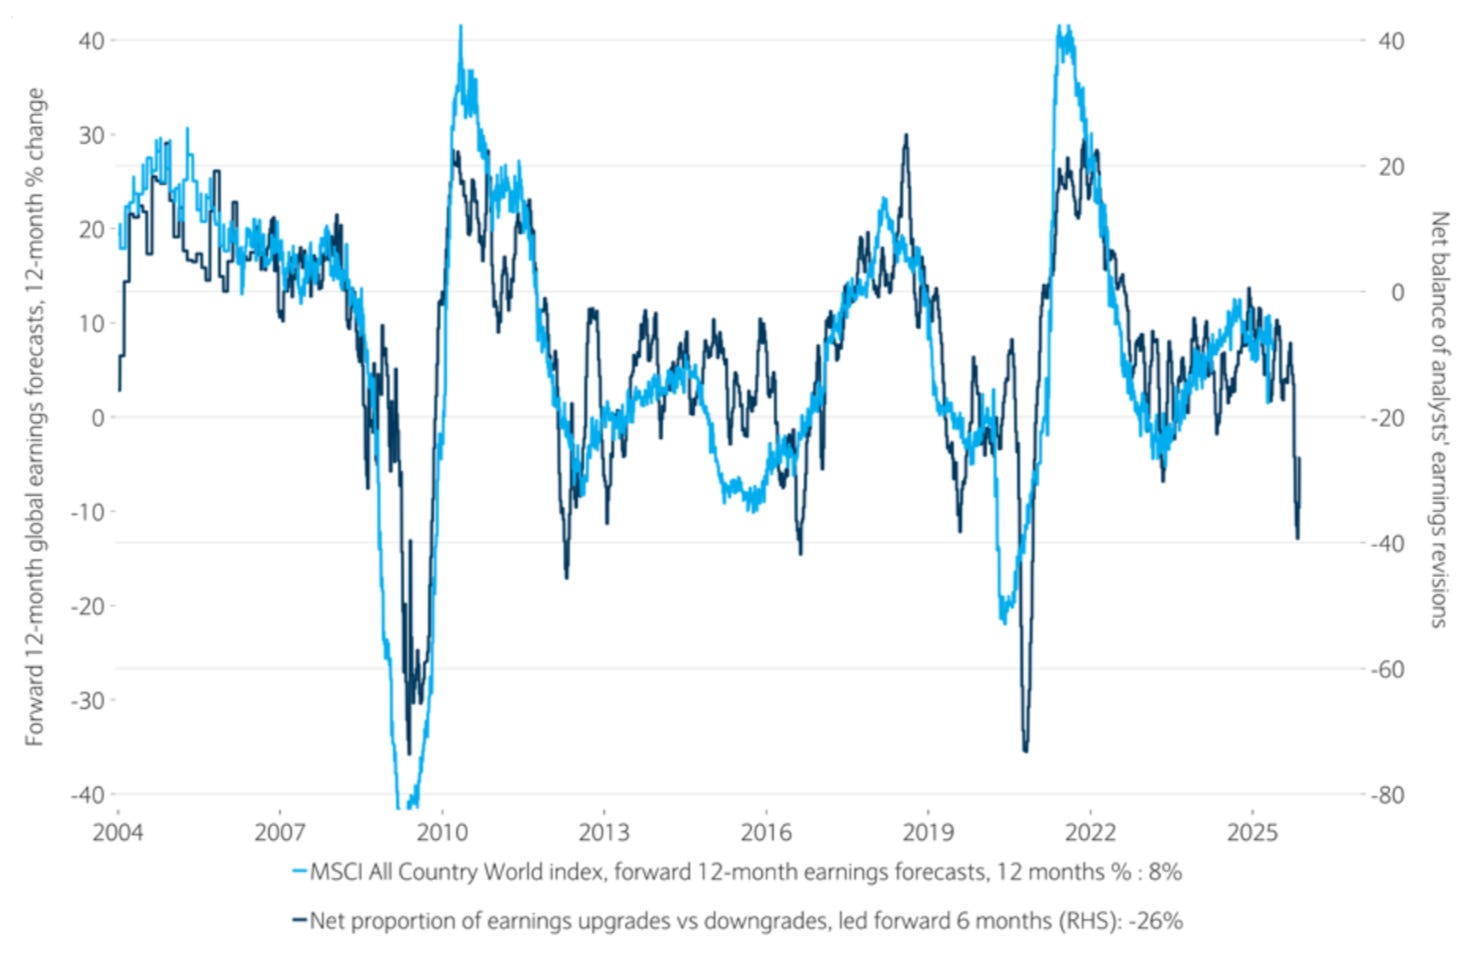
Source: Columbia Threadneedle Forward 12-month global earnings forecasts & net balance of upgrades v downgrades
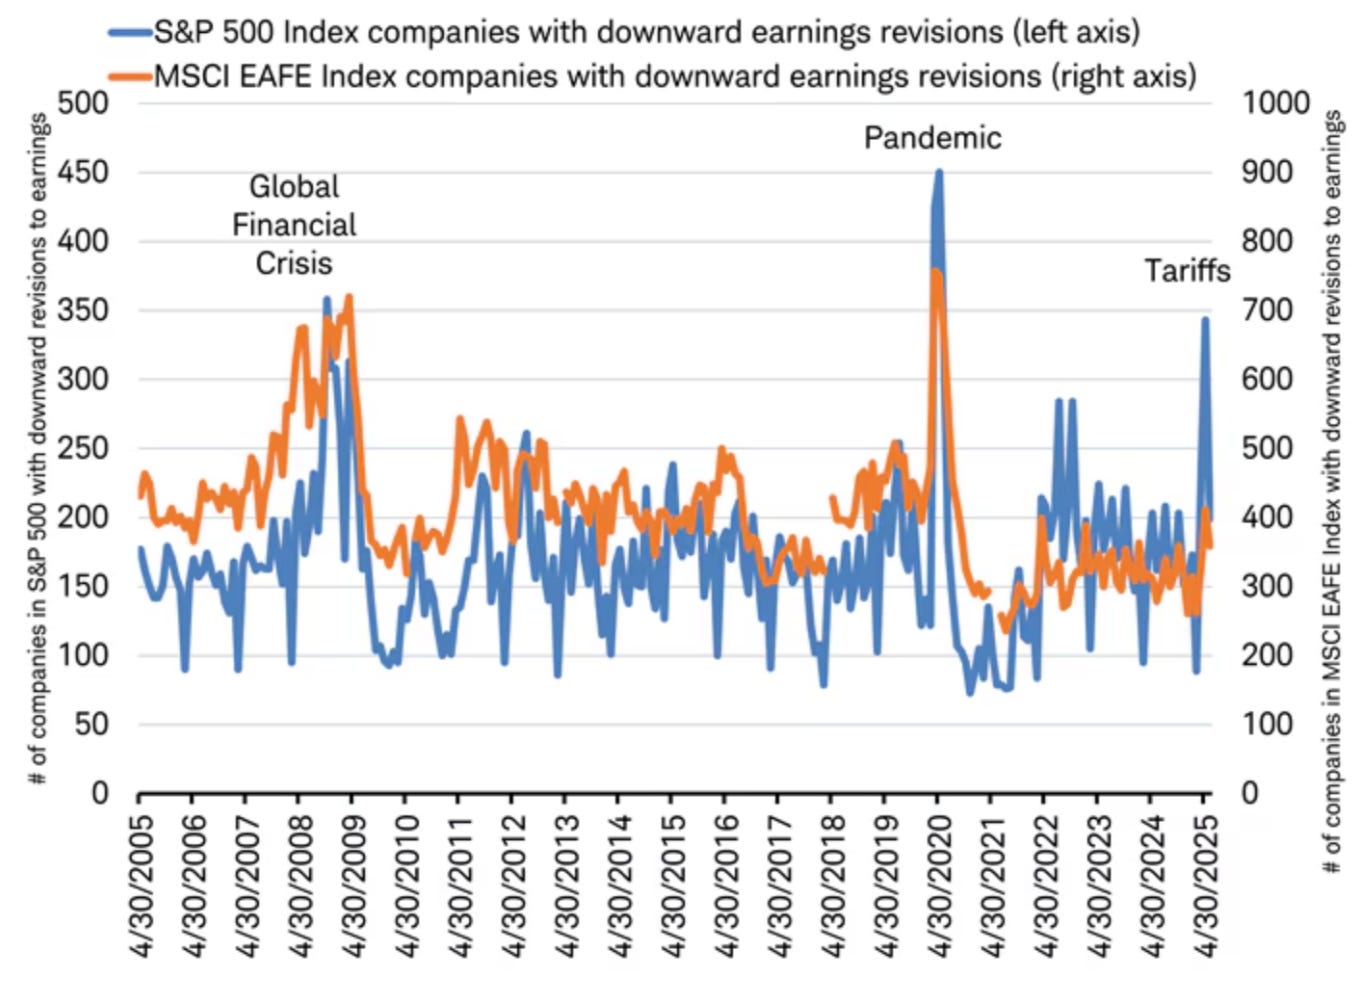
Source: Barclays Private Bank % of companies with downwards earnings revisions & impact of tariffs
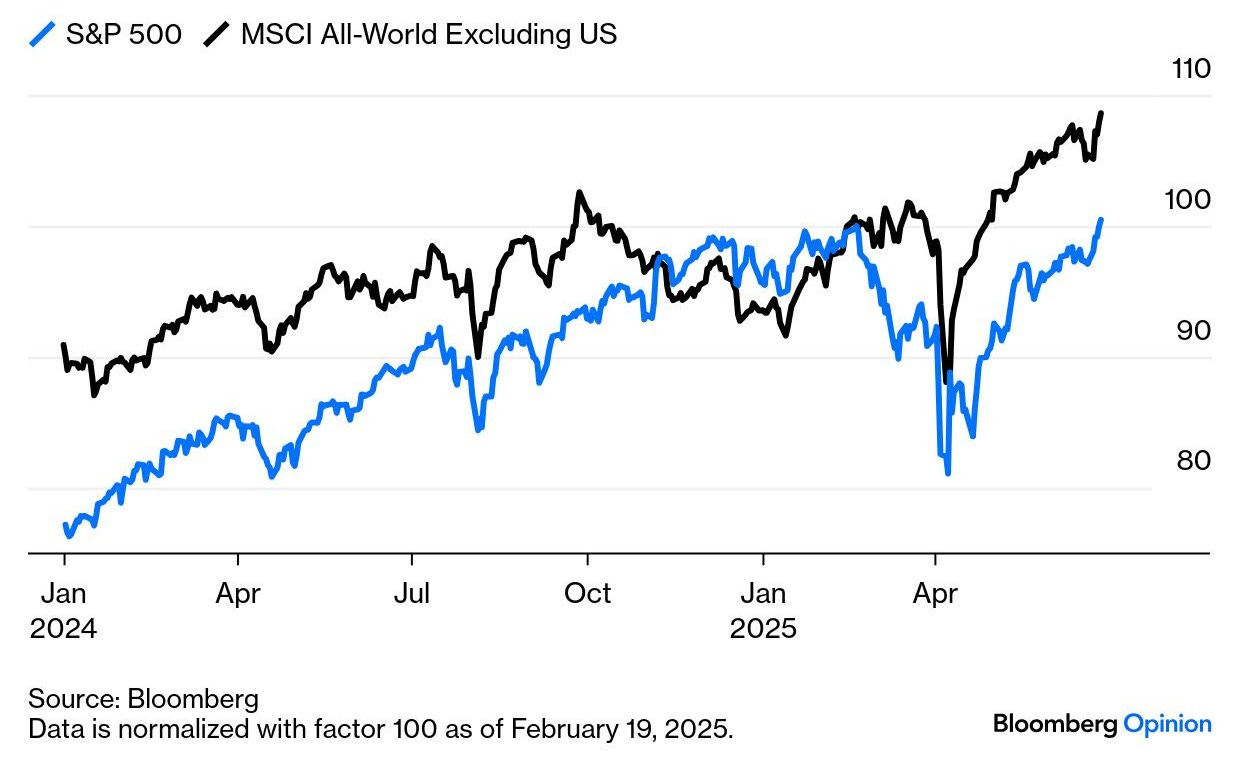
Source: Schwab The rest of the world is ahead since Feb 19 - in common currency
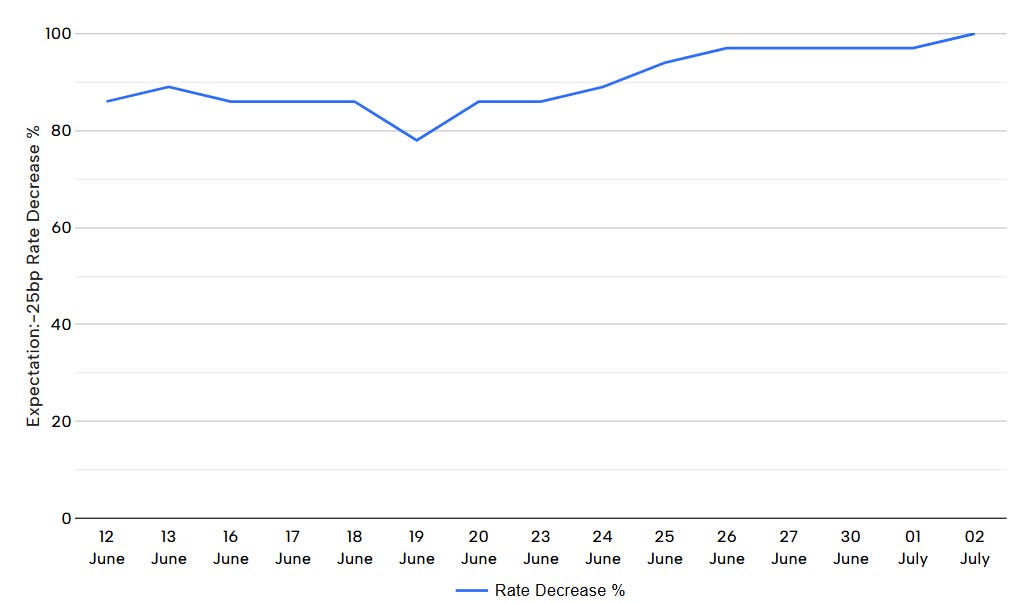
US market still looking for a Fed Reserve cash rate cut in September - but not quite as sure as a week ago
Source: CME Australian market backing in a 25 basis points rate cut by the RBA in July
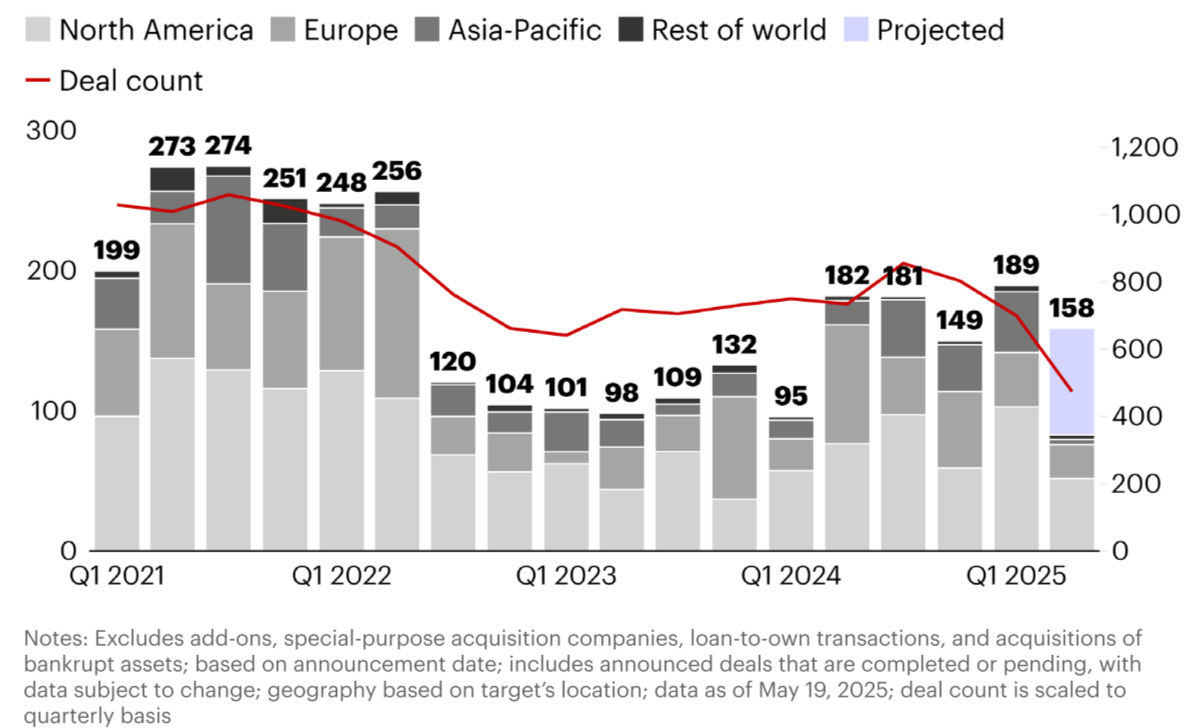
Source: ASX Global buyout deal value, by region ($US billion)
Source: Bain, Dealogic Scarcity of opportunities to convert private investments into cash
Source: The Information Australia mortgage arrears
Source: cotality US Office CMBS delinquency rate %
Source: Trepp, WOLFSTREET.com July 2025 Edition Funds operated by this manager: Equitable Investors Dragonfly Fund Disclaimer Past performance is not a reliable indicator of future performance. Fund returns are quoted net of all fees, expenses and accrued performance fees. Delivery of this report to a recipient should not be relied on as a representation that there has been no change since the preparation date in the affairs or financial condition of the Fund or the Trustee; or that the information contained in this report remains accurate or complete at any time after the preparation date. Equitable Investors Pty Ltd (EI) does not guarantee or make any representation or warranty as to the accuracy or completeness of the information in this report. To the extent permitted by law, EI disclaims all liability that may otherwise arise due to any information in this report being inaccurate or information being omitted. This report does not take into account the particular investment objectives, financial situation and needs of potential investors. Before making a decision to invest in the Fund the recipient should obtain professional advice. This report does not purport to contain all the information that the recipient may require to evaluate a possible investment in the Fund. The recipient should conduct their own independent analysis of the Fund and refer to the current Information Memorandum, which is available from EI. |


14 Jul 2025 - Trade deals and stimulus: the key drivers for stock returns

10 Jul 2025 - Expert Analysis of the RBA's rate decision
|
Expert Analysis of the RBA's rate decision FundMonitors.com July 2025 |
|
Following this Tuesday's decision by the Reserve Bank of Australia to keep the cash rate on hold at 3.85%, Chris Gosselin, CEO of FundMonitors.com, is joined once again by Nicholas Chaplin, Director and Portfolio Manager at Seed Funds Management, and Renny Ellis, Director & Head of Portfolio Management at Arculus Funds Management - both of whom correctly anticipated the outcome in last week's discussion, going against the grain of most economists and the money market. In its post-meeting statement, the RBA reiterated that 'the outlook remains uncertain' - a phrase that has now appeared in every statement since late last year - and reaffirmed that 'inflation and full employment remain the board's priority.' With that in mind, we're here to unpack the RBA's decision, the market's response, and what might lie ahead for monetary policy in the second half of the year.
If you haven't yet watched the previous video, where Nicholas and Renny shared their thoughts on what the RBA might do this week, click here to view it. |

10 Jul 2025 - Do You Need an SMSF?
|
Do You Need an SMSF? Marcus Today July 2025 |
|
When visiting a financial planner, it is almost inevitable that they will advise you to set up an SMSF. If you take control, they get control. But it is not for everyone. As of 30 June 2024, there were over 625,000 SMSFs (an increase of 4.5% from June 2023). 1,1987,293 SMSF members hold $990 billion in assets. Over the past five years, the number of SMSFs has grown by 11%. Where Do You Sit in the SMSF Hierarchy?
Generally speaking it is about control. It is about you (or your financial planner) being able to control your investments as well as do some 'strategic tax planning'. Read below to work out whether you need one, why you would need one, why you shouldn't open one and why you should. The Main Disadvantages of an SMSFThe main disadvantages of an SMSF include cost, complexity and the compliance burden. It may sound clever and simple, and be sold as such, but compare the 'fuss' and administration involved in an SMSF and compare it to the administration and lack of fuss involved if you simply sit in a "set and forget" big industry or retail super fund. There is no comparison. An SMSF is cost and effort. Rather laughably, as many of you come into retirement, you will (as you should) visit a financial planner, come away with an SMSF, and, if you don't hand your financial future and all the investment decisions to the financial planner, who charges you X percent of your investable assets every year (which seems inequitable - the more you have the more you pay for the same effort?), you could, just as you are supposed to relax and enjoy life, find yourself burdened with financial administration, extra accounting costs, and, despite being wholly unqualified, find yourself with the responsibility of being your own fund manager, which, it has to be said, can be divisive for a marriage when you cock it up! (Thank goodness for the guidance of the Marcus Today newsletter. We have been saving marriages for 27 years.) DO I NEED AN SMSF?The main reasons NOT to set up an SMSF include:
What Are the Main Reasons for Setting Up an SMSF?To allow a financial planner to take control of your investments.
To allow you much more flexibility on what you invest in.
You have enough money to need tax minimisation strategies that deliver more benefit than it costs to implement them.
Succession
Business owners
To look after the Family
WHAT DO SMSFs INVEST IN?Here is a table of asset allocation of SMSFs by asset class, depending on the size of the SMSF, using percentages. If you were to say the bigger the fund, the more sophisticated the strategy, then a few things become obvious. Notice that small funds (under $500K) have over 30% cash. Very small funds have 48%. The smaller the balance, the more chicken the investing. Note also that small funds are much bigger into crypto. Crypto is obviously the main reason some people set up an SMSF (with not a lot of money). Notice also, the bigger the fund, the more likely they are to own their business premises. One thing that mildly surprises me here is the low asset allocation to overseas equities (although using Australian-listed ETFs to invest in international stocks would appear as domestic listed shares, so maybe no surprise).
WHO HAS AN SMSF?75% of people with an SMSF are over 50. 3.3% are under 35.
SO, DO YOU NEED AN SMSF?Bottom line - ask yourself.
Don't set up an SMSF if:
UNNECESSARY SMSFsASIC is currently reviewing "SMSF establishment advice to retail clients" to "evaluate the suitability of SMSF establishment advice, ensuring it aligns with client needs and is in their best interests. SMSFs are suitable for some, but not all, clients. Setting up an SMSF is a significant step and may have serious consequences for your client, their retirement savings and their insurance cover". Clearly ASIC is concerned that some financial advisers set up SMSFs for their own benefit rather than the client's. "ASIC has warned that it continues to see too many examples where SMSF advice leads to poor, if not devastating, outcomes for clients. Findings from ASIC's review are expected to be released in the second half of 2025". So, if you are a SNW investor (small net worth - I just made that up), don't take it for granted that you should set up an SMSF just because your accountant or the financial planner you have just seen for the first time says you should. Unnecessary SMSFs are clearly a bit of an issue, enough to stir up ASIC anyway. DISCLAIMER: This content is for general information purposes only and does not constitute personal financial advice. Please consider your own circumstances or seek professional advice before making investment decisions. |
|
Funds operated by this manager: |
.png)
.png)
.png)
.png)

9 Jul 2025 - Australian Secure Capital Fund - Market Update
|
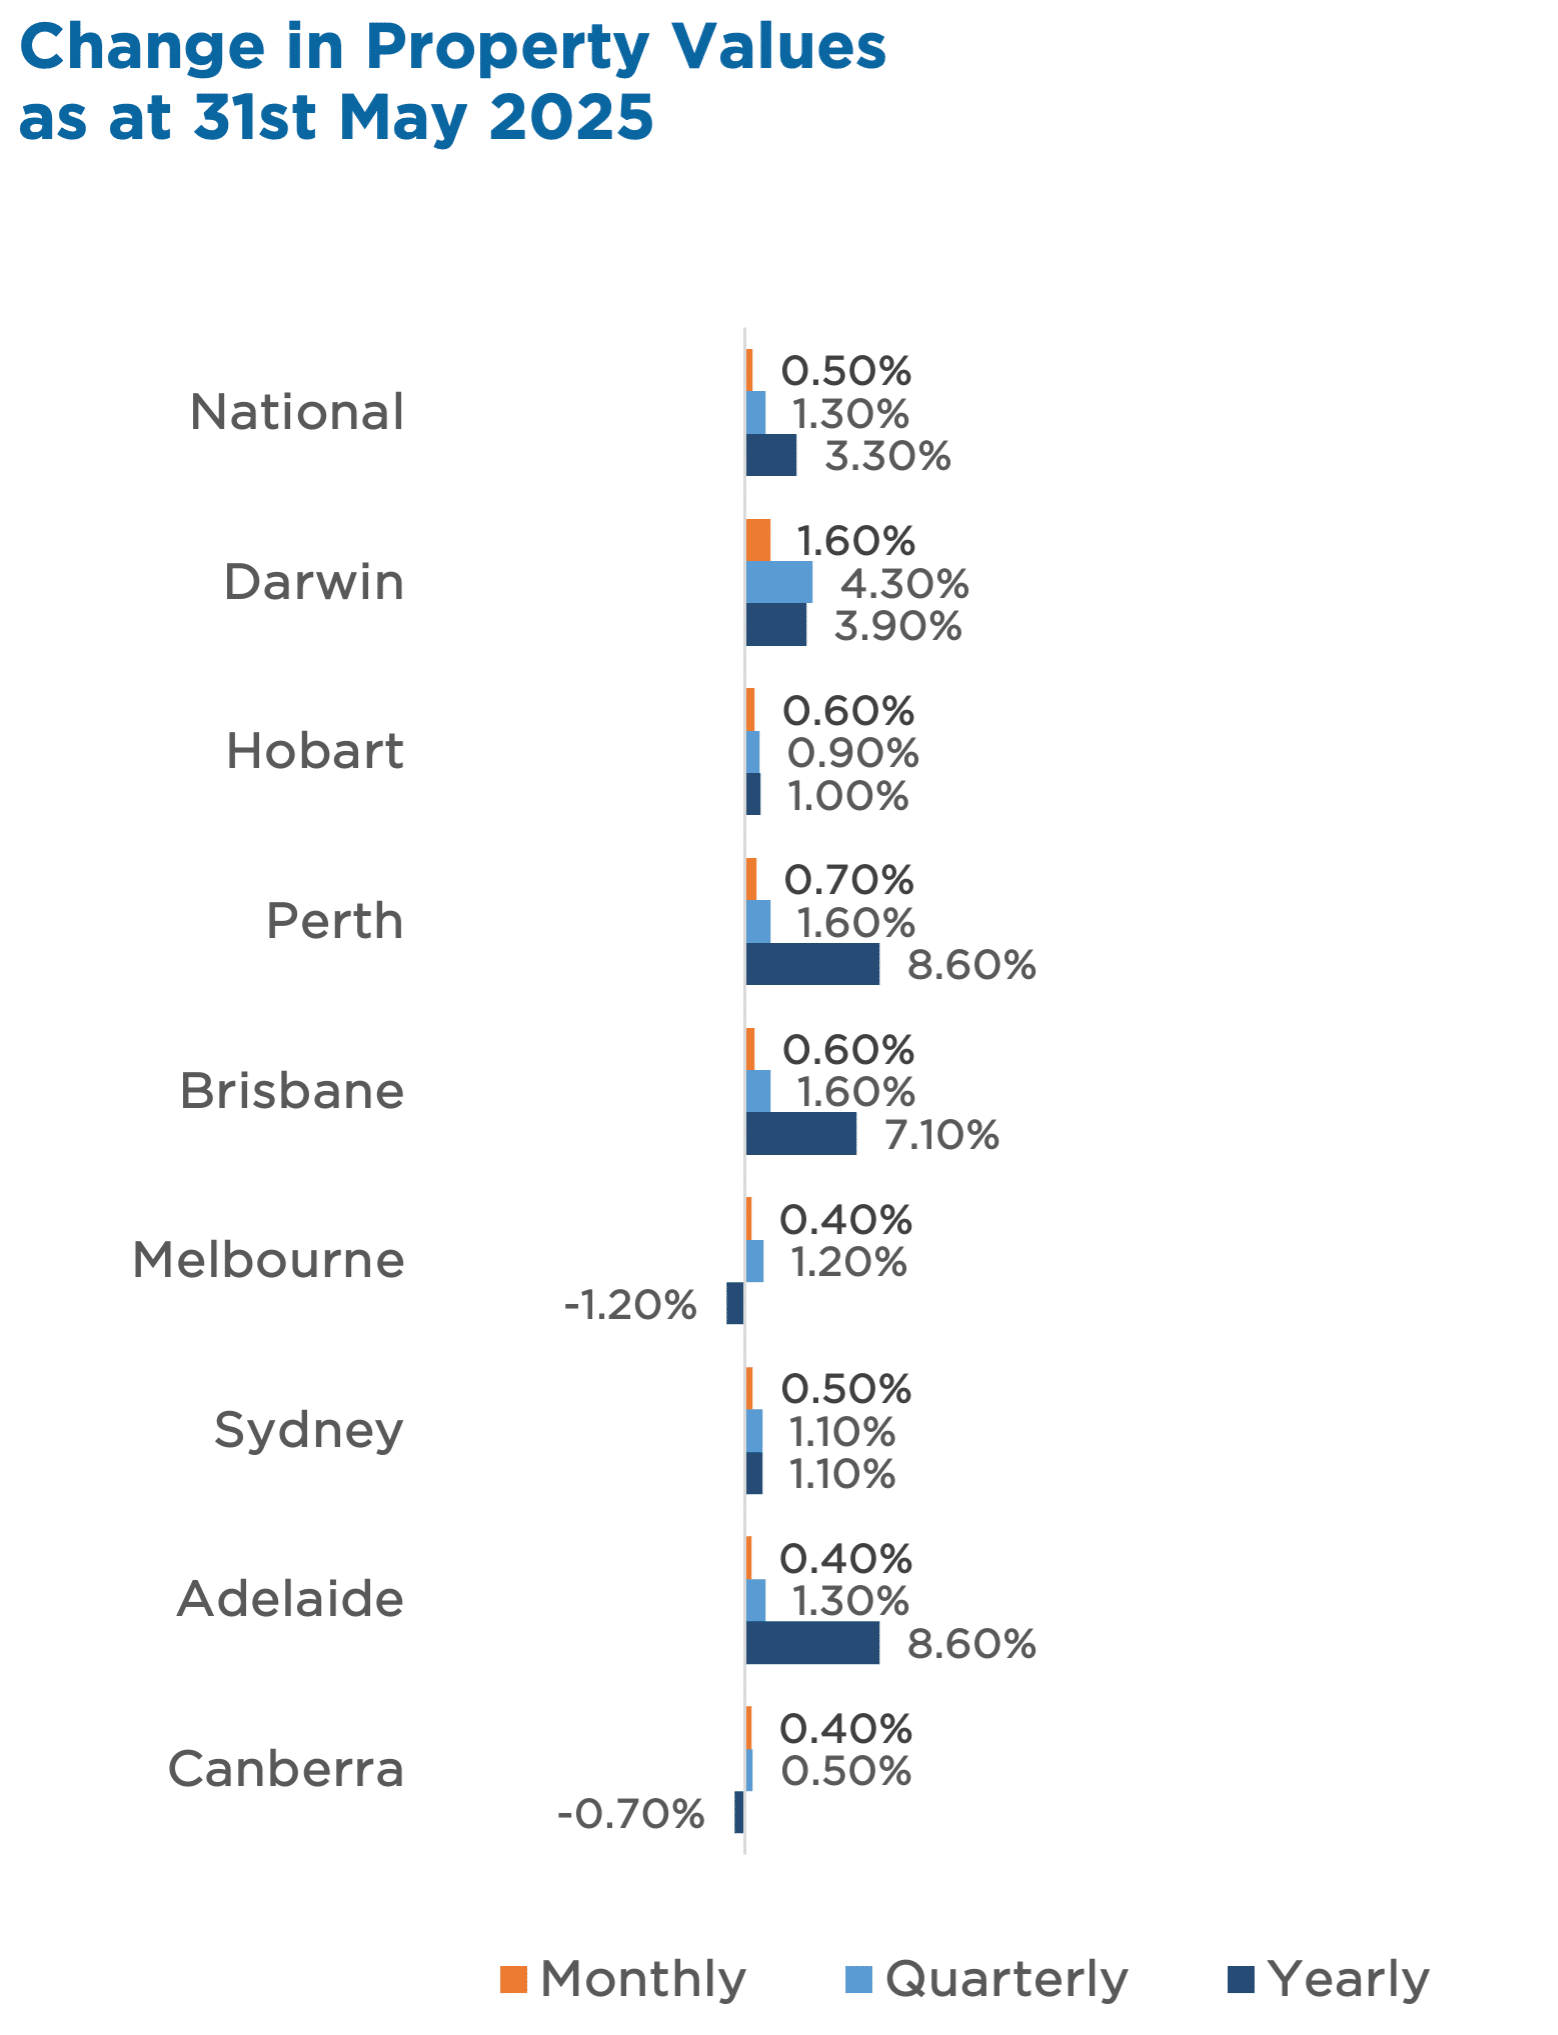
Australian Secure Capital Fund - Market Update Australian Secure Capital Fund June 2025 National housing values rose another 0.5% in May, bringing total growth to 1.7% so far in 2025, with every capital city in positive territory. The market appears to be responding to recent and anticipated interest rate cuts, with auction clearance rates also picking up post-RBA's May meeting. While annual growth has softened to 3.3%, even previously flatlining cities like Melbourne and Canberra are edging back into growth. Regionally, SA is leading the charge, up 5.8% year-to-date, while higher-end property segments in Sydney and Canberra are now outpacing entry-level growth. With values rising across capital cities and regions, many investors are keeping a close eye on how interest rates and housing supply may influence the months ahead. Property Values as at 31st of May 2025
Median Dwelling Values as at 31st of May 2025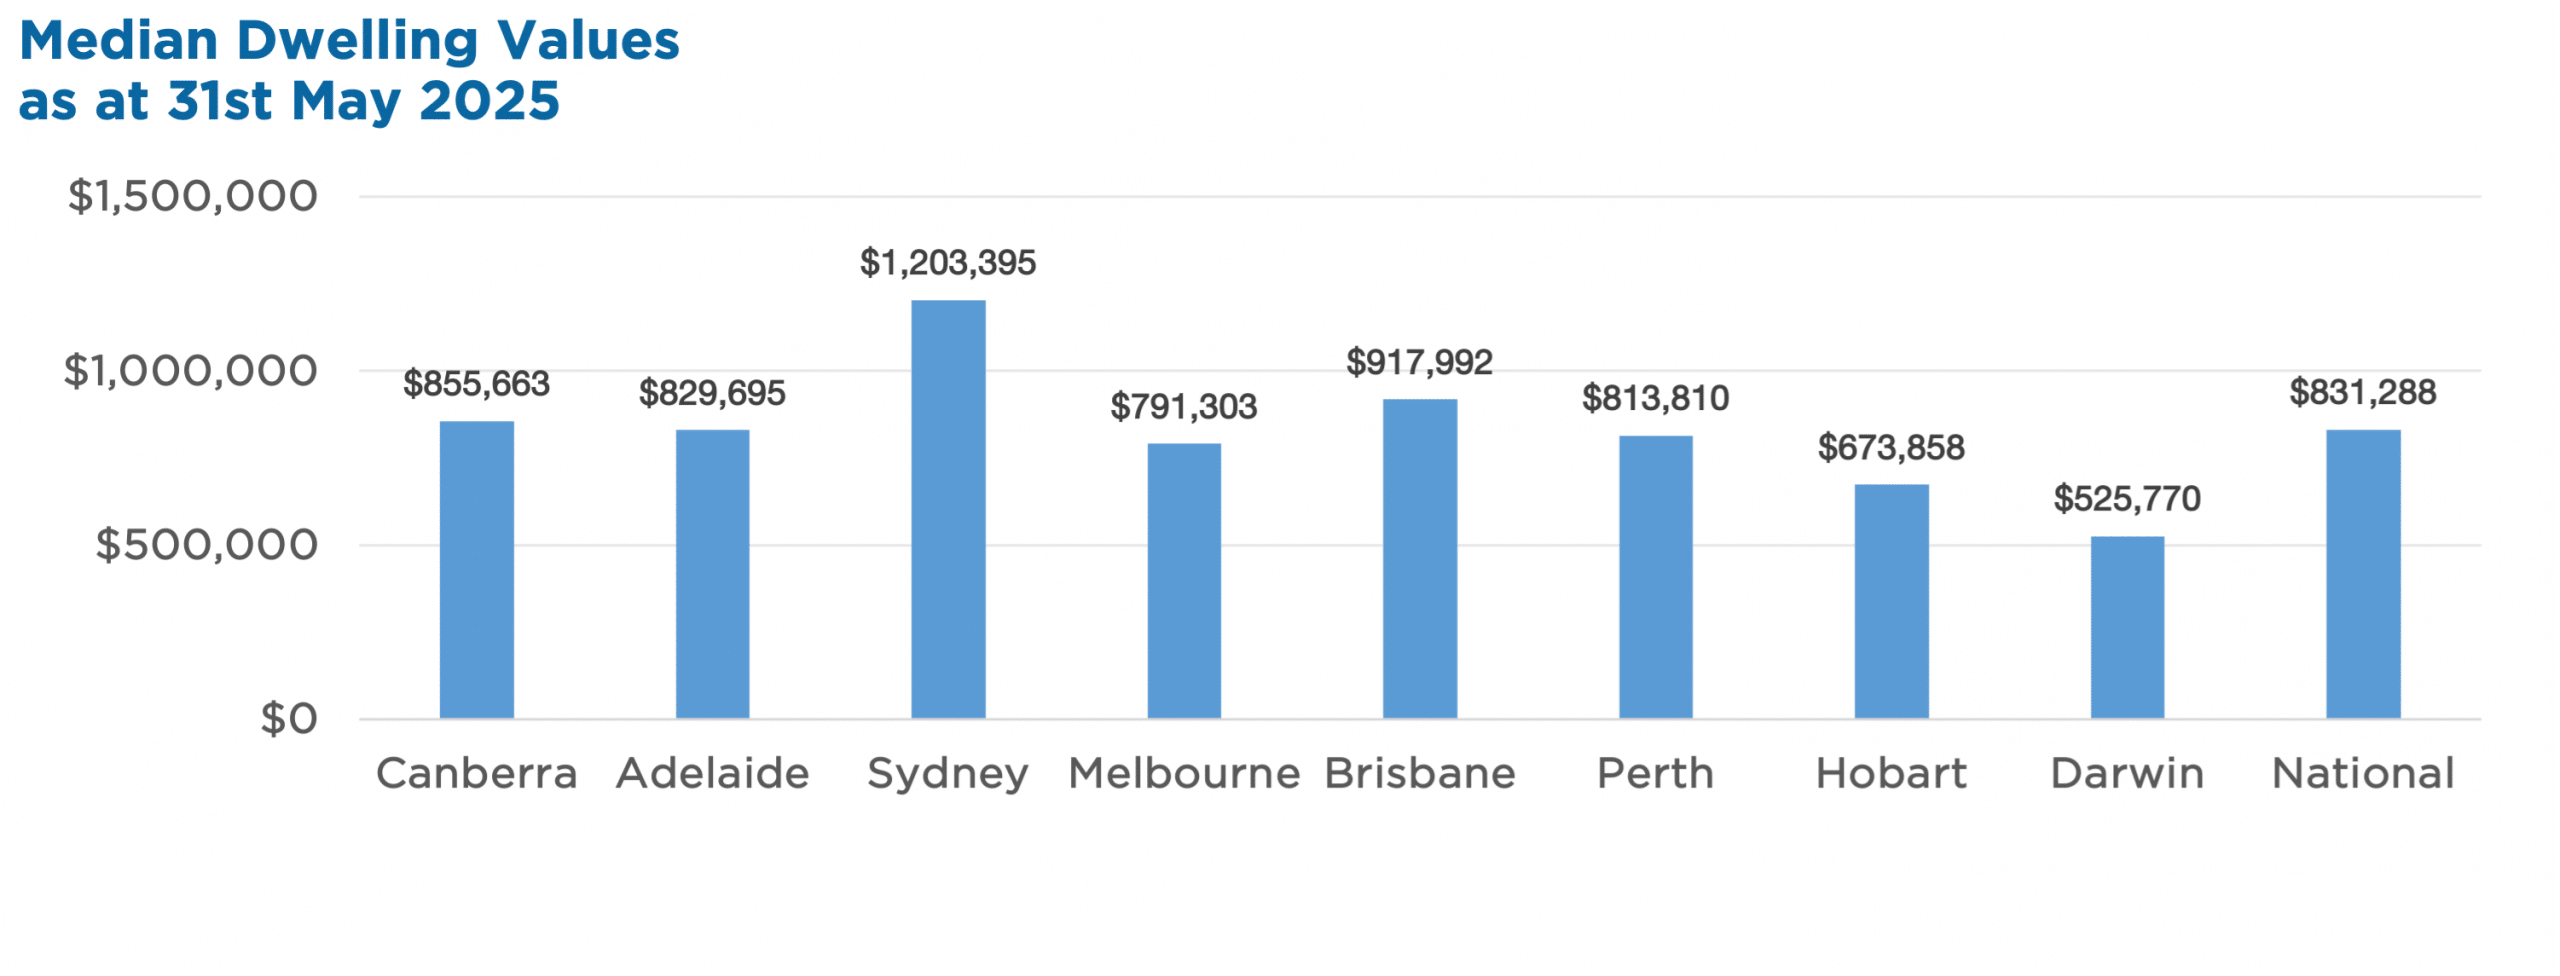 June Edition Funds operated by this manager: ASCF Select Income Fund , ASCF High Yield Fund , ASCF Premium Capital Fund , ASCF Private Fund
|

8 Jul 2025 - News & Views: Oil spikes and geopolitics - How does Global Listed Infrastructure fare?

4 Jul 2025 - Preview of RBA Board Meeting Decision, Friday, 4th July, 2025
|
Preview of RBA Board Meeting Decision, Friday, 4th July, 2025 FundMonitors.com July 2025 |
|
Summary In the lead-up to the Reserve Bank of Australia's (RBA) July policy meeting, Chris Gosselin, CEO of FundMonitors.com, hosted Nicholas Chaplin from Seed Funds Management, and Renny Ellis from Arculus Funds Management to assess the likelihood and implications of a rate cut. Despite soft inflation data for May (2.1%), both urged caution, highlighting the strength of the labour market, rebounding housing prices, and the broader economic stability. While markets are pricing in a cut, Chaplin and Ellis questioned the need for further easing given the current conditions, pointing out that GDP softness-not inflation-may be the real concern. They also compared the RBA's stance with the U.S. Federal Reserve, concluding that domestic factors should drive policy, not international pressure. Conclusion: Both Nicholas Chaplin and Renny Ellis advocate a "wait and see" approach. Despite market expectations, they caution that economic fundamentals do not yet warrant aggressive easing, especially with employment strong and inflation stable. Growth concerns exist, but the RBA has room to observe data and remain flexible in its response. Key Points: 1. Inflation and RBA Mandate
2. Labor Market Strength
3. Economic Growth Concerns
4. Housing and Asset Markets
5. Electricity Subsidies and Policy Interpretation
6. RBA vs. Federal Reserve (Fed)
7. Market Expectations
8. Recommendations from the Panel
Full Transcript: Chris Gosselin: The RBA board meets next Monday, and following two days of deliberations, they're expected to announce their decision at 2:30 PM on Tuesday afternoon. To preview that decision, I'm joined today by two experienced fund managers in the fixed income space: Nicholas Chaplin, Director and Portfolio Manager at Seed Funds Management; and Renny Ellis, Director and Head of Portfolio Management at Arculus Funds Management. Gentlemen, welcome. We're here to unpack what the RBA might decide, with markets almost unanimously pricing in a rate cut from the current 3.85%. Monthly inflation data for May was surprisingly soft at just 2.1%-well within the target range-fueling expectations of a cut. But with unemployment just over 4% and ongoing global uncertainty, is now the right time to ease? Let's dive in. Nick, let's start with you. Inflation came in at 2.1%, well below expectations. Do you think that gives the RBA enough justification to cut rates now? Nicholas Chaplin: I think Michele Bullock addressed this quite clearly on May 20 in her post-meeting media discussion. She stated that the "narrow path" narrative on inflation should be removed from their commentary-they've essentially achieved that goal. Yet interestingly, that didn't stop some banks from forecasting up to three more rate cuts this year. The rate cut in May seemed to acknowledge that CPI had reached the mid-to-low twos, which was justified when the 2.1% figure came out. But Bullock also highlighted strong labor market conditions, rising household expenditure, and a rebounding housing market. We're seeing price rises in housing across the country, which will need to be factored in-especially if CBA, NAB, or Westpac are right about a terminal rate around 3% or even 2.85%, and getting there quickly. However, the bigger driver for me is the weak GDP figure-just 0.2% in the March quarter and 1.3% annually. That's low by historical standards, though not unprecedented for Australia. That's where my concern lies and why I think a cut in July is justifiable. While many predict a 100% chance of a cut in July and 90% for August, I hold a slightly different view, which I'll explain further. But yes, in my opinion, the justification for a cut is there-more due to growth concerns than inflation. Chris Gosselin: Renny Ellis: I don't see pressing reasons to cut in July. That said, I suspect they probably will-bank bill swap rates are already trading around 3.6%. I agree with much of what Nick said, but I'd add that the RBA has indicated they'd look through the distortions caused by federal and state electricity subsidies, which have significantly impacted inflation data since March last year. Asset prices are strong, the share market is at a record high, credit margins are tight, and the yield curve is steep-all signs of a strong economy. Given unemployment is low, I don't see a need to cut. If they do, I doubt they'll follow with another. Chris Gosselin: Renny Ellis: Nicholas Chaplin: Renny Ellis:
The main downside risk she mentioned was geopolitical uncertainty. Nicholas Chaplin: Renny Ellis: Chris Gosselin: Nicholas Chaplin: Renny Ellis: Chris Gosselin: Nicholas Chaplin: Renny Ellis: The yield curve could flatten slightly, particularly in the 5- to 10-year segment. We'd also see a spike in the Australian dollar, which is disinflationary. I don't expect much impact on equity markets from the decision. Chris Gosselin: Nicholas Chaplin: Renny Ellis: But keep in mind, she's only one member of the board. The final decision is collective. Nicholas Chaplin: Chris Gosselin: Let's wrap it up there. The RBA's new two-day meeting format begins on Monday, with the decision due at 2:30 PM on Tuesday. We'll reconvene then to discuss the outcome. Nicholas Chaplin from Seed Funds Management, Renny Ellis from Arculus Funds Management-thank you both for your time. Watch the full video here. |
4 Jul 2025 - Expert analysis on what the RBA will do next Tuesday, July 8
|
Expert analysis on what the RBA will do next Tuesday, July 8 FundMonitors.com July 2025 |
|
Chris Gosselin, CEO of FundMonitors.com, speaks with Nicholas Chaplin, Director and Portfolio Manager at Seed Funds Management and Renny Ellis, Director & Head of Portfolio Management at Arculus Funds Management. With the RBA widely expected to cut rates next week, the discussion explores whether inflation, GDP weakness, and labor market strength justify a move--or argue for patience. Both managers weigh the risks of overstimulating the economy versus acting too late, in the context of local and global dynamics. |

4 Jul 2025 - FOMC: projections highlight heightened uncertainty in rate outlook
|
FOMC: projections highlight heightened uncertainty in rate outlook Nikko Asset Management June 2025 Fed keeps rates on hold, projects a mildly more optimistic outlookThe Federal Open Market Committee (FOMC) kept interest rates on hold as expected at its June meeting. The June monetary policy statement had a mildly more optimistic outlook compared to May. The latest statement noted that "heightened risks of both higher unemployment and inflation" cited in May "diminished but remain elevated". However, the June Summary of Economic Projections (SEP), compared to the March release, indicates that the direction of the economy has shifted to a lower-growth, higher inflation environment in the short term. Growth and employmentAt the post-FOMC press conference Federal Reserve (Fed) Chair Jerome Powell described current conditions as "solid", saying that the 4.2% unemployment rate "remains low". Powell pointed out that real wages are still in positive territory. However, he also cited the SEP's projection for the unemployment rate to reach 4.5% by the end of the year; conditions are expected to worsen. Meanwhile, recent GDP data have not been useful reference to gauge trend developments, with investment surging and net exports skewed by front-loaded imports ahead of anticipated tariffs. On the other hand, the consumption component was softer, and PDFP (private domestic financial purchases) growth was reliant on domestic investment to expand at a healthy rate of 2.5% in Q1. Because investment was driven by anticipation of tariffs, a temporary factor, its contribution is likely to decrease. Notably, growth expectations were shifted lower in June (1.4-1.5%) vs. March (1.6-1.7%). Projections for unemployment in 2025 remains at 4.4-4.5%, reflecting a more defined central tendency. Inflation: the big unknownPowell said inflation "eased significantly" from highs in 2022, but "remains somewhat elevated" compared to the Fed's 2% target. However, he also noted that near-term inflation expectations have "moved up" in recent months, with tariffs a big "driving factor". Although the SEP's total PCE inflation projection of 3% was higher than March, the Fed Chair expected the inflation rate to subside in the longer-term. The uncertainty associated with such an outlook, however, may make the FOMC's rate trajectory highly unpredictable. The mode in inflation expectations moved higher from 2.7-2.8% to 2.9-3%, with both upside and downside risks becoming more prominent. The full range of expectations remains clearly above 2% in 2025 and 2026, subsiding to around target level in 2027, albeit with some upside tail risks. We also note that while FOMC members' diffusion indices assessing uncertainties regarding unemployment and GDP decreased somewhat after March's substantial increase, uncertainty over inflation remained elevated at levels similar to those in March. Majority of members see two rate cuts in 2025 but outlook more disperseThe FOMC's median projection for the Fed Funds rate by the year-end remains 3.9%, unchanged from the March projection. The longer-term projection for 2027 was raised modestly to 3.4%. Ten of the 19 FOMC members see at least two rate cuts in 2025, while the number of those who do not expect the Fed to cut at all this year rose to seven from four in March. The varied projections highlight the elevated uncertainty in the outlook for the Fed Funds rate. For now, it appears that the FOMC remains data-dependent, with the main focus on the uncertainty over near-term inflation expectations. The FOMC's statement and SEP align with the central scenario of slower growth with trade détente outlined in our Global Investment Committee review: scenarios for a less certain global outlook. However, persistent uncertainty means that the probability of scenarios involving stagflation or recession with disinflation remains well above zero. Funds operated by this manager: Nikko AM Global Share Fund , Nikko AM ARK Global Disruptive Innovation Fund , Nikko AM NZ Cash Fund , Nikko AM NZ Corporate Bond Fund , Nikko AM Core Equity Fund (NZ) , Nikko AM Global Shares Hedged Fund (NZ) , Nikko AM KiwiSaver Scheme Balanced Fund (NZ) , Nikko AM ARK Disruptive Innovation Fund (NZ)
Important disclaimer information Please note that much of the content which appears on this page is intended for the use of professional investors only. |
3 Jul 2025 - How A Second-hand Car Salesman Taught Me About Stock Market Psychology
|
How A Second-hand Car Salesman Taught Me About Stock Market Psychology Marcus Today June 2025 |
|
I used to work for a second-hand car salesman called Alex who specialised in Classic Cars. Jaguar XKs, E-Types, Aston Martins, AC Cobras, Trans-Ams, Austin Healeys, anything that an investment banker would impulse purchase (or at least, used to, in the 1980s). The name of the game was a lesson in stock market psychology. There are two things you had to do right: buy the car and sell the car. But of course, things were different in the 1980s, and the big advantage for a good salesman like Alex was that the "true value" of Classic old cars didn't really exist. There was no internet in those days, and for a second-hand car salesman, the ignorance of his customers was bliss. It was much like the stock market today, people purport to put a 'value' on a stock but ultimately they rely on a lot of rubbery assumptions which means the valuation is not 'truth' it is simply a negotiating tool in a sale and all that really matters in the end is the price someone is prepared to pay and the price someone is prepared to sell. Making money trading Classic Cars was the same as making money trading stocks; it was all about taking advantage of other people's emotions by creating fear in a seller and selling into a buyer's euphoria. Buying First - Create FearBuying first. For Alex, the main game was to create 'depression' and to do that, you had to know your stuff or at least sound as if you did, and Alex had developed a 'naked script' he could pretty much rely on whatever the car. Confronted by an emotional amateur selling their pride and joy Alex's job, indeed his amusement, was to beat them down from a "Glorious example of a Classic Car" to a rusty old lump of crap owned by a deluded fool. In the second-hand classic car market, the skill is to generate fear. In the stock market, the money is in recognising it, recognising the points of maximum fear or euphoria. Selling Was Easy - Wait for the StarsAs far as selling was concerned, that was easier, in fact it was so easy Alex could delegate it to a Muppet like me. All he did was re-spray and re-chrome and tell us to wait for an investment banker with a bonus in their back pocket and (the expression was) "Stars in his eyes" to come along, be blinded by the shiny paintwork and new chrome and pay a lot more than the metal millstone had actually cost. And if someone came in with an Austin Healy owners Club T-Shirt and opened with the comment that "the next thing to go will be the tie rod ends", we were told to simply usher them politely off the showroom floor with a smile. You don't have to sell. Eventually, someone with "Stars in their eyes" always turned up. The Stock Market Is Just Like a Car YardMaking money in stocks is the same. It is not about fundamental value, as hordes of finance industry automatons would have you believe; it is about taking advantage of other people. People with stars in their eyes who have inflated a bubble, and people consumed by fear, dumping stocks at any price. It's about inaccurate pricing, not accurate pricing. It's about timing. It's about selling stocks as a bubble bursts and buying them at peak distress. It's about exploiting the herd, not joining the herd. As the Wolf of Wall Street says, investors are sheep, and sheep are for slaughter. Be the Wolf. Be Alex. DISCLAIMER: This content is for general information purposes only and does not constitute personal financial advice. Please consider your own circumstances or seek professional advice before making investment decisions. |
|
Funds operated by this manager: |