
NEWS

21 Nov 2022 - The Rate Debate: Storm clouds continue to gather in global markets
|
The Rate Debate - Episode 33 Storm clouds continue to gather in global markets Yarra Capital Management November 2022 The RBA hiked rates for the seventh consecutive month as it seeks to stifle inflation. Global central banks continue aggressive monetary tightening despite early signs of moderating inflation and weaker forward growth indicators. With the consumer bearing the brunt of high inflation and tighter financial conditions, the RBA has backed away from aggressive rate hikes for now. Will other central banks follow, or is this a temporary reprieve? Speakers: |
|
Funds operated by this manager: Yarra Australian Equities Fund, Yarra Emerging Leaders Fund, Yarra Enhanced Income Fund, Yarra Income Plus Fund |

18 Nov 2022 - Hedge Clippings |18 November 2022
|
|
|
|
Hedge Clippings | Friday, 18 November 2022 As we glide, slide or stagger towards the last few weeks of what will go down as a pretty forgettable year (unless you are Anthony Albanese who continues his dream start as PM) it is worth considering that thanks to a recent rally, the Australian equity market has performed well against its US equivalent. Australian managed funds - although as a whole positive in October - have found it a difficult year as well, with the average equity based fund on the FundMonitors.com data base down 11.31% over 12 months to the end of October, vs. a fall of just 2.01% for the ASX200 total return index. Over the same 12 months (based on 88% of the results to date) only 16% of equity funds managed to outperform the ASX 200, which will no doubt be taken as welcome news by the fans of index or passive funds. However, we believe that misses the point - namely that just as the performance of individual stocks within the index varies, so too will the performance of managed funds. The key, depending on one's strategy or objective, is to select the outperformers. For instance, over 12 months the performance of the Top 10 funds has ranged from 19.8% through to 43.7%, while over 3 years the range has been 17.97% to 44.67% per annum. Over 5 years the number drops, but the best performing fund - Glenmore Australian Equities - returned 19% pa. followed by Regal's Small Companies Fund at 18.25% and with Bennelong's Emerging Companies Fund in third place at 17.41%. Consistency is not always easy to achieve: Of the Top 10 funds over 5 years, only 5 funds were positive over 1, 2, 3 and 4 years as well (Glenmore, Samuel Terry, Regal Amazon, GQC Global, and Australian Eagle's Long Short Fund) which probably underlines how difficult 2022 has been, particularly in the small cap space. Added to the variability of returns has been the rise - and fall - of crypto funds, which took out 3 of the Top 10 spots over 2 and 3 years, but to the surprise of no one, take out 5 places among the 10 worst performing funds over 1 year. When it comes to investing in managed funds, success is a combination of careful research and diversification. |
|
|
Magellan Global Strategy Update | Magellan Asset Management Drawdowns and small stocks for God-like performance | Equitable Investors October 2022 Performance News Bennelong Australian Equities Fund Delft Partners Global High Conviction Strategy Insync Global Capital Aware Fund |
|
|
If you'd like to receive Hedge Clippings direct to your inbox each Friday
|

18 Nov 2022 - Get ready for a glass shortage - unexpected effects of the energy crisis
|
Get ready for a glass shortage - unexpected effects of the energy crisis abrdn October 2022 Plastic wine bottles, jam jars and long waiting lists for luxury glass items may all become part of daily life as a result of the energy crisis. Glass manufacturers are heavy energy users, so have been hard pressed by the rapidly escalating costs of oil and gas. They are currently having to put up the prices of their products by around 35%, although this may rise further. The concern is that passing this cost on to the consumer means prices will increase in a way that makes glass packaging, especially for food and drink, too expensive. Consumers will demand cheaper alternative packaging. Glass half emptyAlready, the luxury end of the glass market is bracing itself for much higher energy costs. Many of the Venetian glass workshops on the Italian island of Murano have already closed their doors because the cost of energy has made their decorative items too expensive. Customers looking to buy Venetian vases and fine crystal glasses could face extensive waiting lists this winter. The world-famous manufacturer of Riedel glass in Austria and Germany is also contemplating a shutdown. That's because furnaces can break if they cool, so pausing during periods when gas is rationed is not an option. Glass half fullNonetheless, glass is completely recyclable, so remains one of the greenest choices for storing food and drink. Given the challenges, we are seeing some surprising effects of the energy crisis as companies strive to develop innovative solutions and better opportunities. Virdrala is one of the leading glass container manufacturers in Western Europe, operating in Spain, Portugal, Italy, the UK and Ireland. It produces a full range of glass containers, selling eight billion per year. Of its products, 35% are for wine, 26% are for beer, and the balance is split between food, spirits and soft drinks. Adapting to the challenges, Vidrala is increasing its focus on glass recycling - in 2021, 48% of the glass it produced was recycled. It's also raised the collection rate of used glass to improve both manufacturing efficiency and earnings. Currently, the company is cooperating with a non-governmental organisation, which encourages people to recycle, collects the glass and delivers it to Vidrala for melting and recycling. Looking to the longer term, Vidrala is working together with other companies from the glass industry to investigate hybrid hydrogen furnaces that could power the industry in the future. Glass manufacturers are also exploring innovations such as reducing the melting temperature of glass by adding ash, allowing a more 'imperfect'-looking glass with less clarity and more bubbles, plus increasing the use of wind and solar energy at factories. What about the future?There's no doubt that the energy crisis will bring all kinds of innovative new solutions. Could we see milkman-style deliveries of wine in reusable bottles? Or more food and drink in aluminium cans? Will much more food move to recyclable plastic packaging or paper-based packaging? Dutch company Corbion is at the forefront of innovative packaging solutions. It produces PLA, a bio-based and biodegradable plastic packaging, made from renewable resources. PLA is strong enough to replace conventional plastics. And, once used, it can be composted, breaking down into CO2, water and biomass. To tackle the many challenges ahead, innovative thinking is needed alongside a more sustainable and, where possible, more traditional way of doing things. Inspired by the humble soap bar, shampoo is now available in solid bars, packaging free. Could the future see us taking our bottles to local shops and supermarkets for wine and oil refills, as is the norm in many parts of Southern Europe? What does all this mean for investors?As a society, we need to reduce our dependence on fossil-fuel energy. The current shortage could be the pressure we need to make dramatic changes. Meanwhile, many of the glass companies affected by the energy crisis are small caps. Due to their size, they are nimbler than their larger peers, putting them in pole position to both adapt quickly and create alternative solutions. So, challenging times can create opportunities for well-managed, innovative companies. Such businesses also create potential opportunities for diligent investors. Maybe it's time to raise a glass after all? Author: Tzoulianna Leventi, Investment and ESG Analyst |
|
Funds operated by this manager: Aberdeen Standard Actively Hedged International Equities Fund, Aberdeen Standard Asian Opportunities Fund, Aberdeen Standard Australian Small Companies Fund, Aberdeen Standard Emerging Opportunities Fund, Aberdeen Standard Ex-20 Australian Equities Fund (Class A), Aberdeen Standard Focused Sustainable Australian Equity Fund, Aberdeen Standard Fully Hedged International Equities Fund, Aberdeen Standard Global Absolute Return Strategies Fund, Aberdeen Standard Global Corporate Bond Fund, Aberdeen Standard International Equity Fund , Aberdeen Standard Life Absolute Return Global Bond Strategies Fund, Aberdeen Standard Multi Asset Real Return Fund, Aberdeen Standard Multi-Asset Income Fund
|

17 Nov 2022 - Performance Report: Delft Partners Global High Conviction Strategy
| Report Date | |
| Manager | |
| Fund Name | |
| Strategy | |
| Latest Return Date | |
| Latest Return | |
| Latest 6 Months | |
| Latest 12 Months | |
| Latest 24 Months (pa) | |
| Annualised Since Inception | |
| Inception Date | |
| FUM (millions) | |
| Fund Overview | The quantitative model is proprietary and designed in-house. The critical elements are Valuation, Momentum, and Quality (VMQ) and every stock in the global universe is scored and ranked. Verification of the quant model scores is then cross checked by fundamental analysis in which a company's Accounting policies, Governance, and Strategic positioning is evaluated. The manager believes strategy is suited to investors seeking returns from investing in global companies, diversification away from Australia and a risk aware approach to global investing. It should be noted that this is a strategy in an IMA format and is not offered as a fund. An IMA solution can be a more cost and tax effective solution, for clients who wish to own fewer stocks in a long only strategy. |
| Manager Comments | The Delft Partners Global High Conviction Strategy has a track record of 11 years and 3 months and has outperformed the Global Equity Index since inception in August 2011, providing investors with an annualised return of 14.45% compared with the index's return of 12.63% over the same period. On a calendar year basis, the fund has experienced a negative annual return on 2 occasions in the 11 years and 3 months since its inception. Over the past 12 months, the fund's largest drawdown was -9.85% vs the index's -15.77%, and since inception in August 2011 the fund's largest drawdown was -13.33% vs the index's maximum drawdown over the same period of -15.77%. The fund's maximum drawdown began in February 2020 and lasted 1 year, reaching its lowest point during July 2020. The fund had completely recovered its losses by February 2021. During this period, the index's maximum drawdown was -13.19%. The Manager has delivered these returns with 1.18% more volatility than the index, contributing to a Sharpe ratio which has fallen below 1 four times over the past five years and which currently sits at 1.06 since inception. The fund has provided positive monthly returns 88% of the time in rising markets and 14% of the time during periods of market decline, contributing to an up-capture ratio since inception of 99% and a down-capture ratio of 90%. |
| More Information |

17 Nov 2022 - Sustainable investing: Five steps to avoid greenwashing
|
Sustainable investing: Five steps to avoid greenwashing Pendal October 2022 |
|
AS DEMAND for sustainable investing grows, Australians are becoming more attuned to the threat of "greenwashing". What is greenwashing? Australian investments regulator ASIC defines it as "the practice of misrepresenting the extent to which a financial product or investment strategy is environmentally friendly, sustainable or ethical". The value of Australian assets managed using a "rigorous, leading approach to responsible investment" passed $1.5 trillion last year — 43% of the total market, the Responsible Investment Association Australasia reported earlier in the month of October. RIAA last year certified 225 products in Australia and New Zealand, representing $74 billion of assets under management — up $18 billion in a single year. (Pendal is named by RIAA as one of 74 responsible investment leaders in Australia.) But not all investment managers are as green as they may seem. So what steps can you take to avoid greenwashing? "It can be a real challenge to spot whether a product you've invested in is truly green versus one that's just claiming to be green," says Pendal senior risk and compliance manager Diana Zhou. In June, Australian Securities and Investments Commission published guidelines to help product issuers self-evaluate their sustainability-related products. But investors can still find it problematic separating financial products that are sustainable from the ones that just say they are. Elise McKay, an investment analyst with Pendal's Australian equities team, says there are broad global questions on what exactly represents best practice in ESG. Right now European regulators are leading the way with explicit regulations on disclosures, reporting and metrics. "My view is that ultimately Australia will head down a similar path towards greater regulation — but we are not there yet. "From an investor perspective, people are selecting these funds because they have an ethical desire to invest aligned with their beliefs. "Product issuers have an obligation to be 'true to label' and deliver them the solution they are after." How can investors be sure that the products they are investing in are delivering what they promise? McKay and Zhou offer these five steps for investors and advisers to avoid falling victim to greenwashing: 1. Dig deeper than the glossy marketing materialInvestment opportunities often come with glossy brochures, but behind the marketing material is a product disclosure statement (PDS), usually available on the product issuer's website. Zhou says "the PDS, by law, must disclose the extent to which ESG practices are taken into account in selecting, retaining or realising an investment. "Investors should read the offer documents (PDS and Additional Information Booklet) in detail rather than relying only on marketing. These documents should provide details on a manager's ESG practices. "A PDS needs to be submitted to ASIC and needs to comply with certain rules in the Corporations Act — so there is regulatory oversight." 2. Check up on a product issuer's governanceCompanies with strong governance frameworks are more likely to be in compliance with rules and regulations, says Zhou. "You're looking for a dedicated responsible investment page on the an issuer's website. "There will usually be policies and statements about responsible investing, climate change, human rights, modern slavery and stewardship. " "The proxy voting process is important for transparency. There should be a record of how the manager voted at the annual meetings of its portfolio companies. Investors should be able to see which resolutions were voted on and which way the investor voted. "Investors can also look at whether the manager is a signatory to the Principles for Responsible Investment (PRI) which gives an indication of the level of commitment a manager has on implementing its responsible investing strategies" 3. Understand how sustainability is integrated into the investment frameworkThere are a number of ways a manager can integrate ESG factors into the investment process - but some are more effective than others, says McKay. Some managers may simply screen out investments while others conduct detailed benchmarking of a portfolio company's ESG targets. "Look for detailed benchmarking on areas like climate change, diversity, biodiversity and natural resources, the circular economy and so on to identify who are really leading sustainability and ESG targets." 4. Look for evidence of stewardship activity.A fund manager that genuinely cares about making a difference will be actively engaged with portfolio companies. This goes beyond proxy voting, says McKay. "Spend time understanding what stewardship activities are done — what are the areas that a manager is working on with companies." You can read more here about what to expect from a modern investment manager's engagement activities. 5. Spend time with the investment teamFinally, and potentially most importantly, McKay urges investors to get to know their fund managers and get into a direct discussion with them to go behind the written word. "Go and talk to the fund manager — get them to explain the framework to you," says McKay. "Go beyond disclosure and get into a discussion to find out if they are really doing what they say they are doing." Author: Diana Zho, Senior Risk and Compliance Manager |
|
Funds operated by this manager: Pendal Focus Australian Share Fund, Pendal Global Select Fund - Class R, Pendal Horizon Sustainable Australian Share Fund, Pendal MicroCap Opportunities Fund, Pendal Sustainable Australian Fixed Interest Fund - Class R, Regnan Global Equity Impact Solutions Fund - Class R, Regnan Credit Impact Trust Fund |
|
This information has been prepared by Pendal Fund Services Limited (PFSL) ABN 13 161 249 332, AFSL No 431426 and is current as at December 8, 2021. PFSL is the responsible entity and issuer of units in the Pendal Multi-Asset Target Return Fund (Fund) ARSN: 623 987 968. A product disclosure statement (PDS) is available for the Fund and can be obtained by calling 1300 346 821 or visiting www.pendalgroup.com. The Target Market Determination (TMD) for the Fund is available at www.pendalgroup.com/ddo. You should obtain and consider the PDS and the TMD before deciding whether to acquire, continue to hold or dispose of units in the Fund. An investment in the Fund or any of the funds referred to in this web page is subject to investment risk, including possible delays in repayment of withdrawal proceeds and loss of income and principal invested. This information is for general purposes only, should not be considered as a comprehensive statement on any matter and should not be relied upon as such. It has been prepared without taking into account any recipient's personal objectives, financial situation or needs. Because of this, recipients should, before acting on this information, consider its appropriateness having regard to their individual objectives, financial situation and needs. This information is not to be regarded as a securities recommendation. The information may contain material provided by third parties, is given in good faith and has been derived from sources believed to be accurate as at its issue date. While such material is published with necessary permission, and while all reasonable care has been taken to ensure that the information is complete and correct, to the maximum extent permitted by law neither PFSL nor any company in the Pendal group accepts any responsibility or liability for the accuracy or completeness of this information. Performance figures are calculated in accordance with the Financial Services Council (FSC) standards. Performance data (post-fee) assumes reinvestment of distributions and is calculated using exit prices, net of management costs. Performance data (pre-fee) is calculated by adding back management costs to the post-fee performance. Past performance is not a reliable indicator of future performance. Any projections are predictive only and should not be relied upon when making an investment decision or recommendation. Whilst we have used every effort to ensure that the assumptions on which the projections are based are reasonable, the projections may be based on incorrect assumptions or may not take into account known or unknown risks and uncertainties. The actual results may differ materially from these projections. For more information, please call Customer Relations on 1300 346 821 8am to 6pm (Sydney time) or visit our website www.pendalgroup.com |

16 Nov 2022 - Performance Report: L1 Capital Long Short Fund (Monthly Class)
| Report Date | |
| Manager | |
| Fund Name | |
| Strategy | |
| Latest Return Date | |
| Latest Return | |
| Latest 6 Months | |
| Latest 12 Months | |
| Latest 24 Months (pa) | |
| Annualised Since Inception | |
| Inception Date | |
| FUM (millions) | |
| Fund Overview | |
| Manager Comments | The L1 Capital Long Short Fund (Monthly Class) has a track record of 8 years and 2 months and has outperformed the ASX 200 Total Return Index since inception in September 2014, providing investors with an annualised return of 19.73% compared with the index's return of 6.78% over the same period. On a calendar year basis, the fund has only experienced a negative annual return once in the 8 years and 2 months since its inception. Over the past 12 months, the fund's largest drawdown was -19.5% vs the index's -11.9%, and since inception in September 2014 the fund's largest drawdown was -39.11% vs the index's maximum drawdown over the same period of -26.75%. The fund's maximum drawdown began in February 2018 and lasted 2 years and 9 months, reaching its lowest point during March 2020. The fund had completely recovered its losses by November 2020. The Manager has delivered these returns with 6.53% more volatility than the index, contributing to a Sharpe ratio which has fallen below 1 four times over the past five years and which currently sits at 0.91 since inception. The fund has provided positive monthly returns 79% of the time in rising markets and 62% of the time during periods of market decline, contributing to an up-capture ratio since inception of 86% and a down-capture ratio of 27%. |
| More Information |

16 Nov 2022 - Energy system stability: risks, opportunities & the decarbonised future
|
Energy system stability: risks, opportunities & the decarbonised future (Adviser & Wholesale Investors Only) Merlon Capital Partners October 2022 Introduction Being able to turn on a light is dependent on the stability of each link in what is a long, complex energy supply chain. An issue affecting any of these links can have an outsized impact on the energy system. And as we have witnessed in 2022, the impact that the manifestation of these risks has resulted in high energy prices, and in turn, global inflation. In this paper, we discuss:
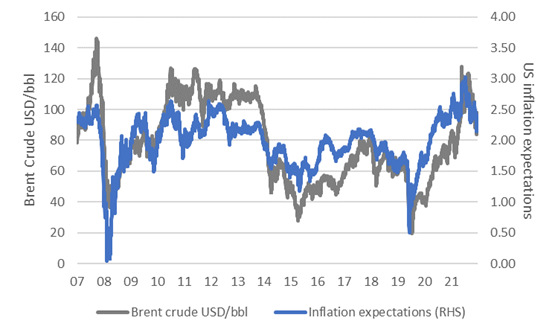
1. System risks: origins If efforts are not made to ensure the integrity of every link of a supply chain, it will be vulnerable to a complex range of risks. In the period post the onset of COVID in 2020, we have seen three examples of the manifestation of these risks in energy markets, all of which have contributed to the significant return of inflation (see Chart 1):
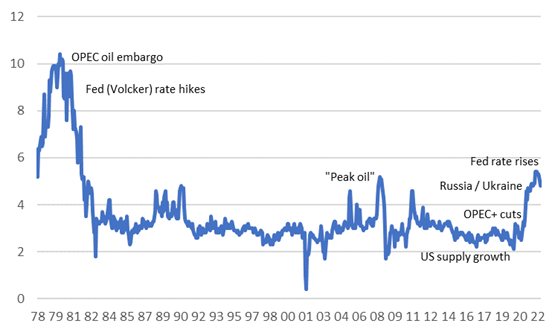
Chart 1: oil prices vs inflation expectations
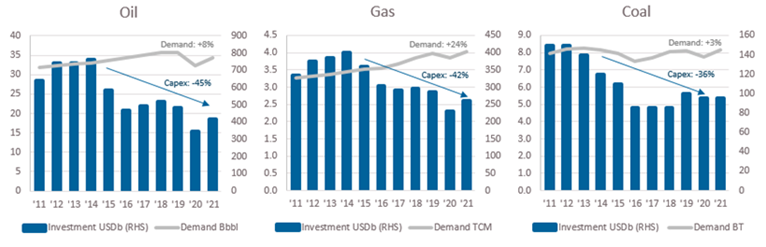
Sources: Bloomberg. Federal Reserve of St. Louis. Calculations: Merlon Capital. Risk 1: constrained capital flows Despite our longer-term objectives of decarbonisation, roughly two-thirds of electricity is still generated through the burning of oil, gas and coal. As such, generating electricity is heavily reliant on the secure supply of these fuels. Yet with capital for carbon-intensive fuel investment increasingly difficult to obtain due to the pivot towards renewables investment, capital expenditure across these fuels has declined by more than 40% on average over the past decade. This compares to an average demand growth across these fuels of more than 10%. Chart 2: underinvestment in carbon-intensive fuels
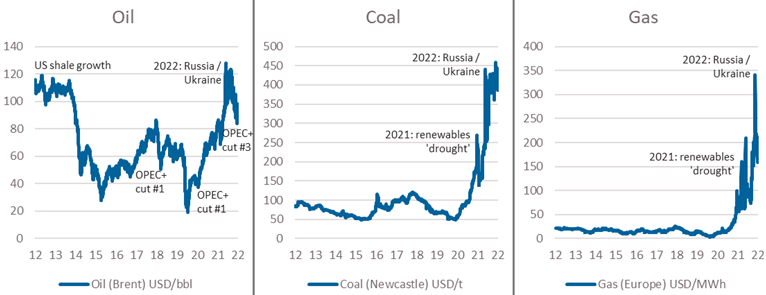
Source: International Energy Agency. Calculations: Merlon Capital. This persistent underinvestment has seen an increasingly vulnerable supply chain across all traditional fuels, which, given renewables variability (see below), the COVID-stimulus-driven demand recovery, and Russia's military activities, have all combined to increase demands on this weakened supply chain, which can only be resolved through higher prices as per the charts below, or ultimately demand destruction. Chart 3: pricing of carbon intensive fuels
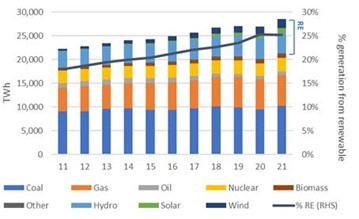
Source: Bloomberg. Calculations: Merlon Capital. Considering each of these commodities in more detail uncovers some interesting nuances. In the cased of oil, given Russia's importance to the global oil supply (~10%), it appears surprising that although oil has rallied, it has significantly underperformed gas and coal since the beginning of the year. This has been a function of the 3-5% of additional supply which was still to come from OPEC as it entered 2022. While the cartel has not met this supply normalisation, it has still represented an overhang on market pricing, despite the recent announced cuts. It has also been muted by Russia's ability - to date - to redirect oil to other destinations such as China, India, and Turkey. In addition, supply was boosted by US President Biden's direction to sell roughly 1mbpd from the US Strategic Petroleum Reserves. These have all combined to result in adequately supplied oil markets. In the case of gas, on the other hand, supply has been tight since 2021, when northern hemisphere renewable energy experienced prolonged underperformance, and demand for gas rose to backstop electricity grids. Exacerbating this market dynamic was Russia's invasion of Ukraine in early 2022. Russia is a large supplier of gas into Europe at roughly 50% of gas imported. In response to Western sanctions on Russian oil, Russia has responded by significantly constraining the supply of Russian gas flows into Europe. As a result, gas prices have risen to unprecedented levels. And coal? Coal and gas are close substitutes in electricity generation, with coal prices influenced heavily by the availability and price of gas. The gas flow disruptions from Russia into Europe noted previously are resulting in previously idled coal-plants restarted, and the demand for coal rising. Yet sanctions have also been applied to Russian coal, meaning the greater demand for coal has been met by lower supply. The key nuance to consider is that Russian coal, and European demand for it, are related to specifically to high calorific value (CV) coal (6,000 kcal). High CV coal is only a small part of the global coal market. There is no significant shortage of the more abundant low energy coals from Indonesia. Thus, the high coal prices we are seeing relate primarily to high CV Australian coal as the only other supplier of this product in scale, thereby benefiting Australian producers of this product, and impacting other consumers, most notably Japan, South Korea and Taiwan. Risk 2: unbacked intermittent renewables growth Globally, renewable energy represents one-quarter of total electricity generated, having grown 79% over the past decade. In the reverse effect of what we noted in the section above, these high levels of investment resulting in high levels of supply saw a market balanced through declining electricity prices. Chart 4: electricity generation by source (global)
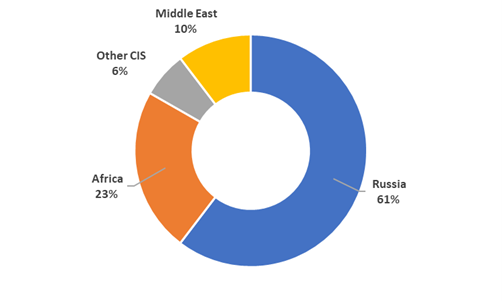
Source: BP Statistical Yearbook. Calculations: Merlon Capital. Yet underneath this politically and environmentally favourable trend was a latent and growing risk: if a system becomes more reliant on a more variable source of supply, and the ability to backstop the system through similarly growing 'firming' capacity (whether carbon intensive or otherwise) is not evident, the system as a whole will have been weakened. In fact, not only was new firming capacity not sufficiently developed, existing baseload capacity was in fact removed. And in the early 2021 period, we saw this risk manifest, as wind and solar 'droughts' in the northern hemisphere resulted in a system short of energy, and a market forced to pay up for coal and gas fuels to firm up the supply of electricity (https://www.merloncapital.com.au/whos-got-the-energy/), in the absence of batteries, pumped hydro, hydrogen, and other zero-carbon firming capacity. In the case of Australia - energy self-sufficient, and far from the weather patterns of the northern hemisphere - we have witnessed the relatively easy phase of the transition phase. We have a system that had excess baseload capacity, which despite closures of some coal fired capacity, has been sufficient to backstop the intermittency of our renewables growth. From here on, however, as coal fired generation capacity retirements accelerate (see Chart 8, below), and with renewables penetration already at around 25%, the absence of firming capacity to backstop the continued growth exposes Australia to similar risks to those seen in the northern hemisphere in 2021. Risk 3: reliability of key suppliers Risks to supply can also manifest in the level of exposure to a single supplier and their reliability. Given its wealth of natural resources, in particular energy, and its proximity to Europe it is no surprise that Russia is the dominant supplier to the region. This supplier concentration is most evident in the case of Germany, relying on Russia for more than half of its coal and gas supplies. This relationship began in a small scale in the 1950s, before gathering pace from the 1970s onwards, cemented further through the development of large-scale oil and gas pipelines to service the region. Chart 5: European gas supply by source
Source: BP Statistical Yearbook. Calculations: Merlon Capital. From Germany's perspective, the availability of large volumes of cheap and reliable supplies was essential to the development of a globally competitive industrial powerhouse. In short, German industrial economics won over the geopolitical considerations associated with such a large supplier. For a number of decades, this risk lay dormant. In 2014, however, with Russia's annexation of Crimea, these risks began to reveal themselves. Despite this, Germany's energy procurement policy remained unchanged. And yet this lack of responsiveness to Germany's implicit funding of Russia's military adventures is not new. Russia's invasion of Afghanistan in 1979 was followed in 1980 by an agreement to construct a dedicated 4,500km pipeline from Western Siberia to Germany, doubling Germany's imports of Russian gas. In this way, Germany has both funded Russian military, and exposed itself to the whims of an increasingly belligerent Russia. Germany is now left with the unenviable task of rapidly building out alternative gas supply arrangements to replace a supply chain which took decades to develop, and which was relatively cheap due to pipeline infrastructure. This supply chain replacement will be costly at many levels:
2. Investing in the context of risk We have been following Risk 1 (constrained capital flows) for some time (see https://www.merloncapital.com.au/oil-pricing-in-a-more-realistic-recovery/). In identifying this risk, coupled with declining energy prices, we grew increasingly confident that there was the likelihood of a tightening pricing environment (see chart 2). At the risk of repeating ourselves, we expected energy markets to tighten because any demand or supply shock to an underinvested (read, 'undermaintained') system would be magnified. And the nature and timing of the shock itself does not necessarily need to be forecast explicitly due to the inherent randomness of economies, geopolitics and increasingly, the environment. With supply unresponsive, in the short-term at least, the only shock absorber to restore balance is price. In essence underinvestment creates the opportunity for higher future returns. At Merlon, we constantly look for these situations, where conditions of growing risk can be accompanied by potential opportunities, some of which may more than compensate for these risks - that is, an increasingly favourable risk / return trade off. We often find that the positive trade-off is most pronounced where the media and industry participants have become overly negative. Although conditions may be negative, and a litany of reasons why 'the end is nigh', it rarely turns out as bad. In fact, if conditions improve to only being less bad, the degree of negativity embedded in equity prices can result in appealing returns. In the case of commodities, what we specifically look for are the combination of defined conditions. While seemingly counterintuitive, these conditions include:
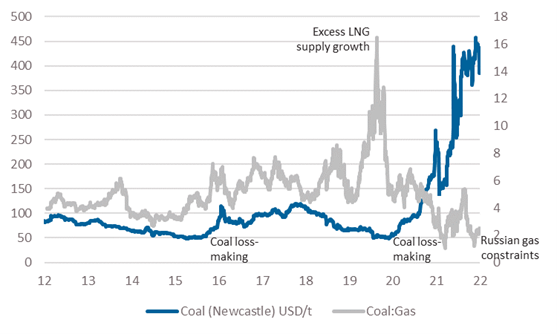
The combination of these two conditions is particularly powerful, as underinvestment, often triggered by low prices and a loss-making industry, in turn leads to reduced risk of further price falls and eventually price recovery as supply tightens from both underinvestment and the exit of loss-making participants. While not a certainty, the odds at this point of a cycle are most heavily in an investor's favour relative to any other point of the cycle. We want to invest when the risk / return skew is most heavily in our favour, noting that 100% certainty is not a possibility in markets. Possible scenarios for energy prices: Where in 2019/20 excess LNG supply growth saw gas prices collapse, pushing coal prices down also, albeit less that gas, driving an historically high coal-to-gas ratio. Today we see the inverse of this situation, with gas supply constrained by Russia, driving the gas and coal prices higher, albeit with coal prices less so, driving the historically low coal to gas price ratio. Chart 6: coal pricing dynamics
Source: Bloomberg. Calculations: Merlon Capital. From here, we are monitoring the trade-off between downside risks from demand destruction (likely), gas supply returns (possible), and increased coal supply (unlikely), relative to the upside risk from a continuation of underinvestment (likely) whereby carbon-intensive commodities become increasingly scarce in the process of decarbonisation. Inflation? It is interesting to note that as fears of recession have grown, and oil prices have declined, inflation expectations have shown signs of a turning point. Little wonder then, Biden's negative response to the most recent OPEC+ 2mbpd production target cut. We would note, however that this 'cut' is unlikely to alter the current market balance given underperformance of OPEC members relative to their targets, coupled with the likelihood that demand is possibly worse than those outside the market realise - OPEC sees daily customer demand nominations which are not visible to the broader investment community. Chart 7: University of Michigan Inflation Expectations survey
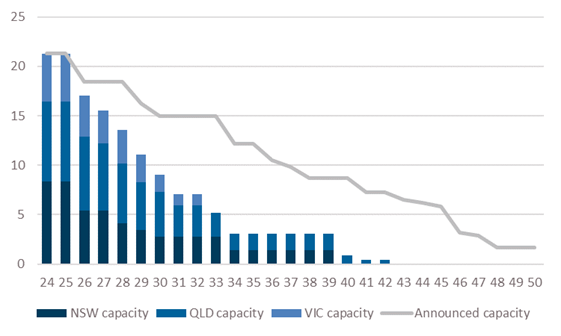
Source: Surveys of Consumers, University of Michigan, University of Michigan: Inflation Expectation©[1] 3. Future risks Australia's global position in the decarbonised future stands in stark contrast to Australia's privileged position in an industrialised, carbon-intensive global economy. While the changing relevance globally is clear, the changing nature (read, 'growing') of our risks should be considered. In many ways, the path forward for Australia (and globally) appears clear: invest heavily in renewable energy generation, alongside the development of firming capacity (batteries, pumped hydro, hydrogen, and gas), in order to meet our net zero 2050 targets (albeit with the largest emitters in China, and third largest in India pushing, their own net zero target dates to 2060 and 2070 respectively). Yet again, underneath this accepted path lie significant risks, all of which we noted above, and reiterate below in the context of our future path towards a decarbonised economy: Risk 1: constrained capital flows In some ways, this risk looks unlikely to change as we decarbonise. In the face of our coal fleet retirement, and the increasing likelihood of this path accelerating (Chart 8, below), the incentive to invest capital to maintain coal mines and coal fired power stations is diminishing further. The risk here, then is seemingly clear: system reliability underpinning 75% of our electricity is declining. The number of coal-fired generations outages seen over the past 12 months is indicative of this trend. Chart 8: AEMO forecast coal capacity (step-change scenario) vs announced capacity (GW)
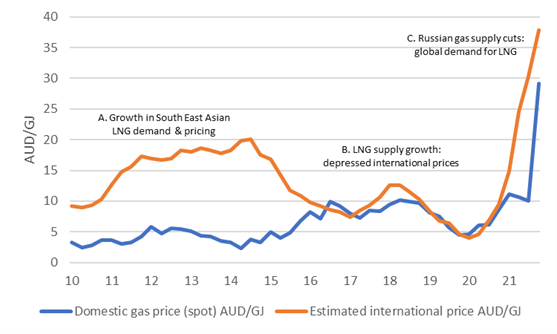
Source: AEMO. As governments become more nervous (state and federal) in the face of an accelerating retirement path, and rapid, but not rapid enough build out of renewable generation to backfill the departing coal-fired generation, we are potentially moving into the phase of knee-jerk reactions in order to regain a sense of control. As we have seen in the Federal government's increasingly over-budget, over-time Snowy Hydro 2.0, NSW's 2021-announced 'Electricity Infrastructure Roadmap' and the recently announced Victorian government's decision to re-establish the State Electrical Commission, government at all levels is growing in size in Australia's future electricity generation. While this gives a sense of greater certainty, the budgetary over-runs in Snowy Hydro 2.0, coupled with the reduction in private investment that has occurred since intervention gathered pace under the previous federal government, ultimately crowds out investment, introduces the tax payer to cost over-runs, and risks reduced accountability as the political cycle continues. Risk 2: unbacked intermittent renewables growth: Outside of these risks, which have been acknowledged at the highest level of government, we have an additional supply risk, in the form of managing what is an intermittent source of energy. Our acceleration in the removal of coal-fired generation - again, as we have seen in the case of Europe - means these risks are increasing. To date, the growth of intermittent renewable capacity has been largely backstopped by an oversupply of baseload and peaking generation. Looking ahead, however, as the retirement of coal fired capacity continues (Chart 8), renewable generation growth will form an increasingly large percentage of our energy mix, necessitating a solution to intermittency outside of baseload plants, or else face a 2021-like situation seen in the northern hemisphere. Risk 3.0: reliability of key suppliers: In a manner similar to that of Germany today and its supply of gas energy today, Australia's future renewable energy supply chain has already become highly reliant on a politically questionable supplier. China is currently the manufacturer of 80% of the world's panel supply (IEA, July 2022). This is level is similar in the case of lithium-ion batteries and other renewable generation and storage components and processed raw materials such as lithium. Our exposure to this supplier will only grow as our coal retirement path rolls on (Chart 8, below), our generation fleet becomes more renewable, and our car fleet becomes increasingly electric, and our housing stock replaces its gas supply with electricity, demanding significantly greater imports of photo-voltaic panels, electrolysers, wind turbines, lithium and other 'critical minerals' from China. Furthermore, we will be competing with the rest of the world to secure this supply, delivering even greater geopolitical leverage to China. And, in turn, like Russia's invasion of Ukraine, Australia's (and the world's) growing reliance on China for renewable energy generation and storage inputs may facilitate an escalation of tensions between China and Taiwan. In such a situation, and should Australia object in any way, it is not hard to see risks to this supply. We have already seen how China is readily willing to 'punish' Australia should it wish, as we have seen in 2021 with their banning of Australian coal. Energy has always been a geopolitical issue, and likely to increasingly be the case. And as such, we may witness more supply shocks contributing to energy disruption as well as inflation going forward. Risk 3.1: reliability of key suppliers In the industrialised, carbon-intensive economic era post the 1850s, Australia has been 'energy-advantaged' with large volumes of cheap domestic gas supplies. In a similar way to Germany's key supplier of cheap energy being Russia, we have been our own key supplier, and hence the reliability of this supply is still a critical question. The chart below shows that before the commencement of large-scale LNG exports from Australia's east coast in 2015, Australia enjoyed significant energy competitiveness. From this point onwards, however, we can see how Australian spot gas prices have converged on international prices. It is important to note that despite this spot price convergence, contract prices (which affect the large-scale domestic electricity and industrial user base) have yet to fully converge. This is due to the lagged effects of long-term contracts rolling, as well as being a market that has been, until very recently, well-supplied with gas. Chart 9: Australian domestic spot gas price vs international netback equivalent AUD/GJ
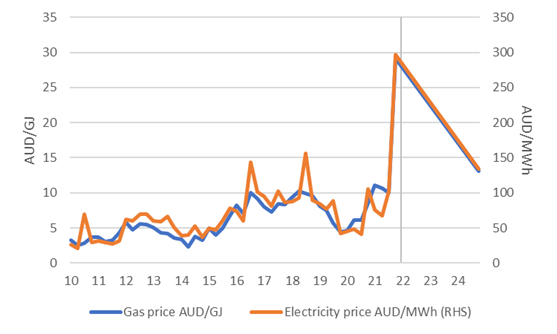
Source: St Louis Federal Reserve. Australian Energy Regulator. Calculations: Merlon Capital. As noted originally, the cost to Germany of what was a reliable source of cheap gas, becoming an unreliable supplier, has been the need to construct a second gas supply infrastructure, including large scale LNG import terminals. According to the ACCC, Australia could also be facing a shortage of domestic gas from 2023, albeit not to the same scale as Germany currency faces. Yet given the lack of investment in new capacity to service the lower priced (historically) domestic market, coupled with growing ESG-driven restrictions, Australia is now faced, like Germany, with the need to invest in a gas import infrastructure, beginning with import terminals in Geelong and potentially Port Kembla also. With this new infrastructure comes the new direct link via imports to international market pricing (in addition to links via export hubs). Where to for Australian electricity prices Given the key role of gas in electricity price formation (see chart below), we are now able to model what could happen to our electricity price forecasts when we are increasingly exposed to a regional (rather than domestic) gas pricing regime. Using a relatively neutral international LNG price forecast of USD9.50/mmbtu (based on Brent oil futures of USD74/bbl), converting this into a domestic 'netback' gas price of AUD13/GJ, and then using the historical relationship between gas and electricity prices, we forecast a possible wholesale electricity price of AUD130/MWh. In short this implies a 'normal' future electricity pricing environment 60% higher than the average over the period since 2010. It is important to note that this forecast is not based on today's elevated spot international gas prices, but a return to a pre-COVID, pre-Russia / Ukraine 'normal' oil-linked contract environment (if such an environment is possible). Not only is this inflationary, but it also may signal the end of Australia's era of energy advantage. Chart 10: domestic gas prices vs electricity prices
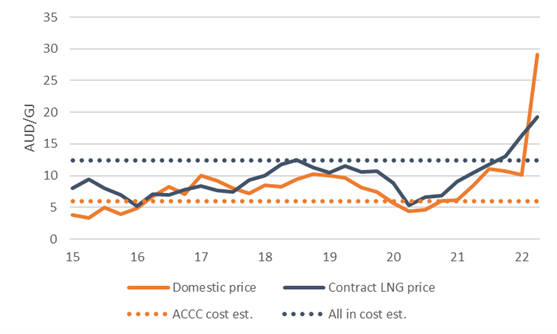
Source: Australian Energy Regulator. Calculations & forecasts: Merlon Capital. Who to blame? Although the export of large volumes of what is effectively 'unconventional' (read, costlier) gas via the Curtis Island LNG hub implies that we are exporting gas from a nation that is set to be short gas, this gas is only flowing due to investments that were only worth making due to their ability to sell it at higher international prices (see point A. in Chart 9 above). Selling into the domestic market at the prevailing pricing regime would have rendered the investment loss- making, hence a disincentive from making this investment. Chart 11 (below) shows the true, all-in cost that needs to be covered 'through the cycle' for the project to have been worth making. The widely publicised ACCC operating cost line is not wrong, yet it ignores other costs including the cost of the project's original construction, the cost of financing this project, and the additional 'return' required to compensate for the risk of the investment. Chart 11: gas price vs true project economics
Source: Company Reporting (sample QLD LNG producer). ACCC. Calculations: Merlon Capital. In other words, this gas would not have reached the ground had it not been for a higher priced export opportunity, rendering these projects economic. Its existence now does not imply it necessarily should be made 'available' to any party, given the need for it to generate a return on the investment required to bring it to the ground. As such, forcing the re-routing of contracted export volumes into the domestic market at economically loss-making prices poses a sovereign risk for future large-scale investment in Australia. And this debate, necessarily suffers as a result of its politicisation. And the cost of this debate includes reduced focus on avoiding the future energy supply crunch, a reduced incentive for domestic and international parties to invest large scale sums of capital into new energy projects, and poor decisions made by governments reluctant to rely on markets and feel it necessary to more directly control investment (as noted above), in a style more reminiscent to centrally planned economies, and all the associated inefficiency that this involves. So, does linking domestic gas prices to international markets mean future investment in large scale gas capacity is now incentivised? While potentially making new investment attractive, our original point on constrained capital flows is considered likely to prevent such capital flowing into new domestic east coal gas investment at a scale likely to resolve the anticipated shortage. However, one positive in terms of actual availability of gas is Viva Energy's Geelong terminal project, which, if it proceeds, is expected to source gas from Woodside's west coast supplies, including its recently sanctioned Scarborough project. While possibly priced at internationally referenced markets, it will at least mean we may be able to backstop our decarbonising electricity system, a positive in an increasingly complex and costly energy transition. Conclusions & portfolio considerations Having previously identified and invested in the opportunities made available through prolonged underinvestment in traditional energy fuels and invested on the basis of the estimated risk / return trade-offs, we have been steadily reducing exposures as companies in this space have outperformed. These positions have included Ampol, Viva Energy, Woodside, Santos, New Hope, and Whitehaven. We continue to look for new opportunities through this lens, regardless of their sector, and demonstrate patience in waiting for such opportunities to become truly compelling. Conversely, we look for situations where capital flows are relatively unconstrained and seek to avoid these given the likelihood of excess supply and low future returns. Australia's increasingly constrained energy future, as we have shown, contains many risks. Yet we do expect to see opportunities for a sensible government, industry and financial level debate in order to manage these risks as early as possible. And from an investment perspective, as we have shown, with risk can come opportunity. Author: Ben Goodwin, Analyst/Portfolio Manager |
|
Funds operated by this manager: Merlon Australian Share Income Fund, Merlon Concentrated Australian Share Fund [1] Surveys of Consumers, University of Michigan, University of Michigan: Inflation Expectation© [MICH], retrieved from FRED, Federal Reserve Bank of St. Louis https://fred.stlouisfed.org/series/MICH/, (Accessed on 12/10/22) This material has been prepared by Merlon Capital Partners Pty Ltd ABN 94 140 833 683, AFSL 343 753 (Merlon), the investment manager of the Merlon Australian Share Income Fund and the Merlon Concentrated Australian Share Fund (Funds). It is general information only and is not intended to provide you with financial advice or take into account your objectives, financial situation or needs. To the extent permitted by law, no liability is accepted for any loss or damage as a result of any reliance on this information. Any projections are based on assumptions which we believe are reasonable but are subject to change and should not be relied upon. Past performance is not a reliable indicator of future performance. Neither any particular rate of return nor capital invested are guaranteed. |

15 Nov 2022 - Performance Report: Insync Global Quality Equity Fund
| Report Date | |
| Manager | |
| Fund Name | |
| Strategy | |
| Latest Return Date | |
| Latest Return | |
| Latest 6 Months | |
| Latest 12 Months | |
| Latest 24 Months (pa) | |
| Annualised Since Inception | |
| Inception Date | |
| FUM (millions) | |
| Fund Overview | Insync invests in a concentrated portfolio of high quality companies that possess long 'runways' of future growth benefitting from Megatrends. Megatrends are multiyear structural and disruptive changes that transform the way we live our daily lives and result from a convergence of different underlying trends including innovation, politics, demographics, social attitudes and lifestyles. They provide important tailwinds to individual stocks and sectors, that reside within them. Insync believe this delivers exponential earnings growth ahead of market expectations. Insync screens the universe of 40,000 listed global companies to just 150 that it views as superior. This includes profitability, balance sheet performance, shareholder focus and valuations. 20-40 companies are then chosen for the portfolio. These reflect the best outcomes from further analysis using a proprietary DCF valuation, implied growth modelling, and free cash flow yield; alongside management, competitor, and industry scrutiny. The Fund may hold some cash (maximum of 5%), derivatives, currency contracts for hedging purposes, and American and/or Global Depository Receipts. It is however, for all intents and purposes, a 'long-only' fund, remaining fully invested irrespective of market cycles. |
| Manager Comments | The Insync Global Quality Equity Fund has a track record of 13 years and 1 month and has outperformed the Global Equity Index since inception in October 2009, providing investors with an annualised return of 11.48% compared with the index's return of 10.48% over the same period. On a calendar year basis, the fund has only experienced a negative annual return once in the 13 years and 1 month since its inception. Over the past 12 months, the fund's largest drawdown was -28.54% vs the index's -15.77%, and since inception in October 2009 the fund's largest drawdown was -28.54% vs the index's maximum drawdown over the same period of -15.77%. The fund's maximum drawdown began in January 2022 and has so far lasted 9 months, reaching its lowest point during September 2022. The Manager has delivered these returns with 1.58% more volatility than the index, contributing to a Sharpe ratio which has fallen below 1 five times over the past five years and which currently sits at 0.79 since inception. The fund has provided positive monthly returns 82% of the time in rising markets and 19% of the time during periods of market decline, contributing to an up-capture ratio since inception of 85% and a down-capture ratio of 89%. |
| More Information |

15 Nov 2022 - Magellan Global Strategy Update
|
Magellan Global Strategy Update Magellan Asset Management October 2022 |
|
Nikki Thomas, CFA, Portfolio Manager, discusses the market's reaction to the volatile macro environment, how Magellan's Global Portfolios are positioned and which quality companies are well placed to deliver growth in the years ahead. Speaker: Nikki Thomas, CFA, Portfolio Manager |
|
Funds operated by this manager: Magellan Global Fund (Hedged), Magellan Global Fund (Open Class Units) ASX:MGOC, Magellan High Conviction Fund, Magellan Infrastructure Fund, Magellan Infrastructure Fund (Unhedged), MFG Core Infrastructure Fund Important Information: This material has been delivered to you by Magellan Asset Management Limited ABN 31 120 593 946 AFS Licence No. 304 301 ('Magellan') and has been prepared for general information purposes only and must not be construed as investment advice or as an investment recommendation. This material does not take into account your investment objectives, financial situation or particular needs. This material does not constitute an offer or inducement to engage in an investment activity nor does it form part of any offer documentation, offer or invitation to purchase, sell or subscribe for interests in any type of investment product or service. You should read and consider any relevant offer documentation applicable to any investment product or service and consider obtaining professional investment advice tailored to your specific circumstances before making any investment decision. A copy of the relevant PDS relating to a Magellan financial product or service may be obtained by calling +61 2 9235 4888 or by visiting www.magellangroup.com.au. Past performance is not necessarily indicative of future results and no person guarantees the future performance of any strategy, the amount or timing of any return from it, that asset allocations will be met, that it will be able to be implemented and its investment strategy or that its investment objectives will be achieved. This material may contain 'forward-looking statements'. Actual events or results or the actual performance of a Magellan financial product or service may differ materially from those reflected or contemplated in such forward-looking statements. This material may include data, research and other information from third party sources. Magellan makes no guarantee that such information is accurate, complete or timely and does not provide any warranties regarding results obtained from its use. This information is subject to change at any time and no person has any responsibility to update any of the information provided in this material. Statements contained in this material that are not historical facts are based on current expectations, estimates, projections, opinions and beliefs of Magellan. Such statements involve known and unknown risks, uncertainties and other factors, and undue reliance should not be placed thereon. Any trademarks, logos, and service marks contained herein may be the registered and unregistered trademarks of their respective owners. This material and the information contained within it may not be reproduced, or disclosed, in whole or in part, without the prior written consent of Magellan. |
14 Nov 2022 - Performance Report: Insync Global Capital Aware Fund
| Report Date | |
| Manager | |
| Fund Name | |
| Strategy | |
| Latest Return Date | |
| Latest Return | |
| Latest 6 Months | |
| Latest 12 Months | |
| Latest 24 Months (pa) | |
| Annualised Since Inception | |
| Inception Date | |
| FUM (millions) | |
| Fund Overview | Insync invests in a concentrated portfolio of high quality companies that possess long 'runways' of future growth benefitting from Megatrends. Megatrends are multiyear structural and disruptive changes that transform the way we live our daily lives and result from a convergence of different underlying trends including innovation, politics, demographics, social attitudes and lifestyles. They provide important tailwinds to individual stocks and sectors, that reside within them. Insync believe this delivers exponential earnings growth ahead of market expectations. The fund uses Put Options to help buffer the depth and duration that sharp, severe negative market impacts would otherwide have on the value of the fund during these events. Insync screens the universe of 40,000 listed global companies to just 150 that it views as superior. This includes profitability, balance sheet performance, shareholder focus and valuations. 20-40 companies are then chosen for the portfolio. These reflect the best outcomes from further analysis using a proprietary DCF valuation, implied growth modelling, and free cash flow yield; alongside management, competitor, and industry scrutiny. The Fund may hold some cash (maximum of 5%), derivatives, currency contracts for hedging purposes, and American and/or Global Depository Receipts. It is however, for all intents and purposes, a 'long-only' fund, remaining fully invested irrespective of market cycles. |
| Manager Comments | The Insync Global Capital Aware Fund has a track record of 13 years and 1 month and has underperformed the Global Equity Index since inception in October 2009, providing investors with an annualised return of 9.52% compared with the index's return of 10.48% over the same period. On a calendar year basis, the fund has experienced a negative annual return on 2 occasions in the 13 years and 1 month since its inception. Over the past 12 months, the fund's largest drawdown was -29.45% vs the index's -15.77%, and since inception in October 2009 the fund's largest drawdown was -29.45% vs the index's maximum drawdown over the same period of -15.77%. The fund's maximum drawdown began in January 2022 and has so far lasted 9 months, reaching its lowest point during September 2022. The Manager has delivered these returns with 0.91% more volatility than the index, contributing to a Sharpe ratio which has fallen below 1 five times over the past five years and which currently sits at 0.67 since inception. The fund has provided positive monthly returns 81% of the time in rising markets and 21% of the time during periods of market decline, contributing to an up-capture ratio since inception of 59% and a down-capture ratio of 85%. |
| More Information |