
NEWS

25 Nov 2022 - Performance Report: Bennelong Kardinia Absolute Return Fund
| Report Date | |
| Manager | |
| Fund Name | |
| Strategy | |
| Latest Return Date | |
| Latest Return | |
| Latest 6 Months | |
| Latest 12 Months | |
| Latest 24 Months (pa) | |
| Annualised Since Inception | |
| Inception Date | |
| FUM (millions) | |
| Fund Overview | There is a slight bias to large cap stocks on the long side of the portfolio, although in a rising market the portfolio will tend to hold smaller caps, including resource stocks, more frequently. On the short side, the portfolio is particularly concentrated, with stock selection limited by both liquidity and the difficulty of borrowing stock in smaller cap companies. Short positions are only taken when there is a high conviction view on the specific stock. The Fund uses derivatives in a limited way, mainly selling short dated covered call options to generate additional income. These typically have less than 30 days to expiry, and are usually 5% to 10% out of the money. ASX SPI futures and index put options can be used to hedge the portfolio's overall net position. The Fund's discretionary investment strategy commences with a macro view of the economy and direction to establish the portfolio's desired market exposure. Following this detailed sector and company research is gathered from knowledge of the individual stocks in the Fund's universe, with widespread use of broker research. Company visits, presentations and discussions with management at CEO and CFO level are used wherever possible to assess management quality across a range of criteria. |
| Manager Comments | The Bennelong Kardinia Absolute Return Fund has a track record of 16 years and 6 months and has outperformed the ASX 200 Total Return Index since inception in May 2006, providing investors with an annualised return of 7.77% compared with the index's return of 6.06% over the same period. On a calendar year basis, the fund has experienced a negative annual return on 2 occasions in the 16 years and 6 months since its inception. Over the past 12 months, the fund's largest drawdown was -10.52% vs the index's -11.9%, and since inception in May 2006 the fund's largest drawdown was -11.71% vs the index's maximum drawdown over the same period of -47.19%. The fund's maximum drawdown began in June 2018 and lasted 2 years and 6 months, reaching its lowest point during December 2018. The fund had completely recovered its losses by December 2020. During this period, the index's maximum drawdown was -26.75%. The Manager has delivered these returns with 6.72% less volatility than the index, contributing to a Sharpe ratio which has fallen below 1 five times over the past five years and which currently sits at 0.66 since inception. The fund has provided positive monthly returns 87% of the time in rising markets and 33% of the time during periods of market decline, contributing to an up-capture ratio since inception of 14% and a down-capture ratio of 53%. |
| More Information |

25 Nov 2022 - What drives poor returns?
|
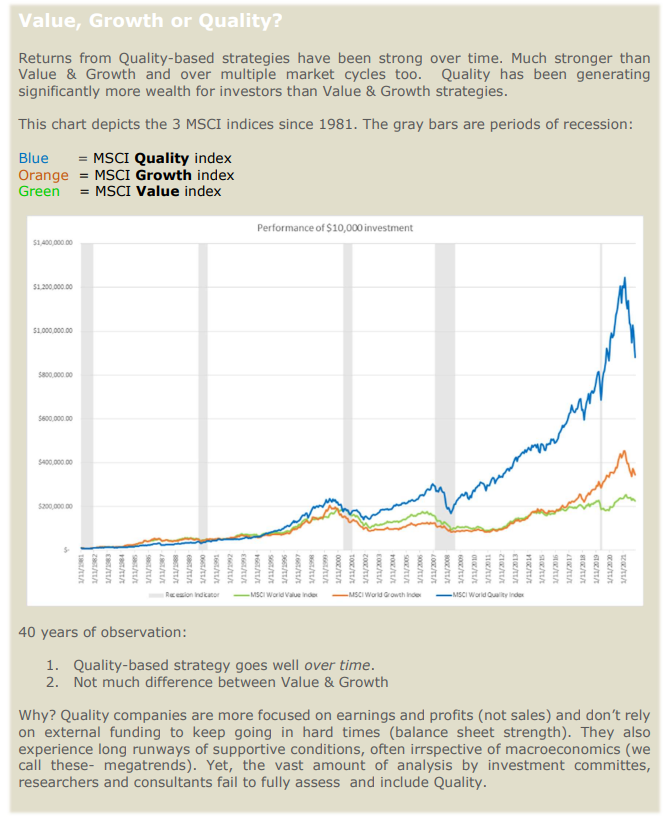
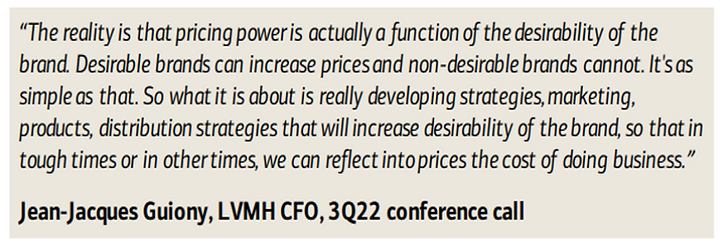
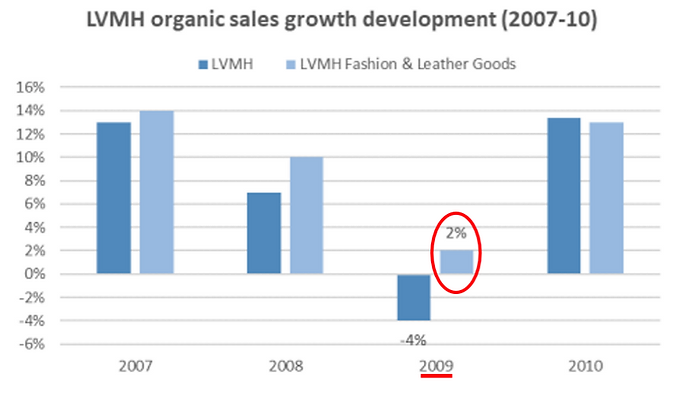
What drives poor returns? Insync Fund Managers October 2022 Most investors do not reap the benefits of compounding wealth that come from equities. Equities grow wealth very well. $100 in the S&P 500 at the start of 1926, three years prior to the great crash, would have boosted your wealth to over $1 Million today. That's 10.05% p.a. Tumultuous macro world events have rained down upon us since then, and so it's not adverse macro events that derail wealth accumulation; it is investors' reactions to them. In short, investor behaviour derails compounding wealth. We've experienced difficult months recently for our quality-based strategy including recessionary concerns. We've also delivered positive annual above market returns recently as well - 2017, 2018, 2019, 2020, & 2021 (December Ending). First to fall: When a recession looms, a Quality company's stock price often falls more than the market initially. Quickest to rise: They are also the first to recover and outperform the other major investment styles during a market recovery. All roads lead to technology - Accenture Some of our 16 global megatrends are technology based. Despite all the negative noise shouting for our attention today, the reality is that we are in the middle of an unstoppable wave of technological advances impacting every business. From old style utilities and industrials to online payments, construction and retail. Companies must digitise their business to remain competitive, grow their customer base, revenues and earnings. Accenture is a key player assisting in this digital transformation. Accenture posted revenues of $62 billion, a record 22% growth adding $11 billion for the year, and importantly EPS growth of 18%. New bookings were $18.4 billion for the quarter, their second highest ever. A case study on how they do it- EDF French multinational utility company EDF digitizes the construction of nuclear power stations that provide low-carbon energy for more than 6 million UK homes alone. Accenture transformed EDF's digital construction processes by creating a digital factory model on a secure cloud infrastructure. This drives cost efficiencies. Construction methods that relied on thousands of uncoordinated, disjointed paper plans and text are now digitized with contractors accessing and sharing the same view and information. AI then scans and assesses this for problems and opportunities. Digital dashboards provide real-time data visibility across a myriad of systems. 'Digital twins' identify areas for automation across power plants, all of which drive safety, efficiency and quality. A 'digital twin' virtually duplicates physical objects, processes & systems, and are used to predict how those elements will respond to different variables. Premiumisation powerhouse - LVMH LVMH is the world's largest luxury conglomerate. Brands include Christian Dior, Givenchy, Louis Vuitton, Tag Heuer, Bulgari, Fendi, and Moët & Chandon - even Cape Mentell wines in WA and Cloudy Bay in NZ. LVMH's products are an expression of creativity and timelessness. The previous LVMH picture highlights an important facet of their brand strength. They are 6 of LVMH's oldest brands (houses) in the leather goods division with the Loewe brand first established in 1846. History shows heritage brands with a strong leather goods offer, fare best during economic downturns. In today's difficult macroeconomic climate LVMH delivered standout growth. LVMH recorded revenue around €56.5 billion in the first nine months alone. Up 28% compared to the same period last year. Luxury shoppers have not lost their appetite for high-end designer goods, even in tumultuous times. We have often cited the benefits of companies with pricing power and high gross margins in a rising inflationary environment. LVMH is a stand out example. Whilst the luxury sector is not immune to recessionary shocks, the negative impacts do not last very long. The strongest brands tend come out bigger and better on the other side. LVMH offers a proven defensive track record. The GFC period highlights this. Overall sales at LVMH declined by 4% yet Fashion & Leather Goods (F&LG) posted sales growth of +2% in the worst recessionary period we have had in decades. Back then F&LG made up 55% of their total. Today it represents 75% of group profits. Conventional wisdom pointed to people trying to hide their wealth during an economic downturn. During the GFC, anecdotes spread of shoppers coming out of Bergdorf Goodman in NY with their purchases wrapped in brown paper bags. But a 2010 joint study by the Marshall School of Business and UCLA put paid to this. The study focused on luxury leather goods and how they changed during the GFC. Leading brands substantially trimmed their offering, whilst simultaneously increasing price points. They also featured a higher proportion of items with logos or other brand identifiers. Louis Vuitton and Gucci were charging consumers more to flaunt their brands during a recession. The study explained this by segmenting luxury consumers into "Patricians" and "Parvenus", or "insiders" and "outsiders" to the world of luxury. Parvenus needed to confirm they were still wealthy during a recession by buying more items from the latest collections of lux brands. This created an opportunity for ostentatious luxury designs. The GFC sent the world into a tailspin, mainly because it was the most significant contraction in the global economy since WWII and the last global recession was 18 long years ago. Luxury stocks saw a mass sell-off. From the peak of their performance in May 2007 to trough in March 2009, an index of the top 13 luxury goods companies lost 62 percent of its value. Over the same period, the financial performance of the 13 companies making up the index was the reverse! Sales continued growing; +5.7% in 07', +6.5% in 08' and +2.2% in 2009. Their share prices recovered sharply immediately after the bad news ebbed. Investors rightly appreciated the resilience and strength of their business models. LVMH have delivered a compound annual earnings per stock growth rate of 14% p.a. since the start of the GFC. A compound annual rate of return of 17% p.a. over the same period. Summing things up The global economy is impossibly complex, with billions of moving parts driving demand, consumption and activity. Commentators, most fund managers, consultants and the media earn money trying to predict what all of these billions of consumers and companies are doing, or are planning to do over the next few weeks, months or even years. It's not only foolish but impossible. Funds operated by this manager: Insync Global Capital Aware Fund, Insync Global Quality Equity Fund Disclaimer |


25 Nov 2022 - Performance Report: ASCF High Yield Fund
| Report Date | |
| Manager | |
| Fund Name | |
| Strategy | |
| Latest Return Date | |
| Latest Return | |
| Latest 6 Months | |
| Latest 12 Months | |
| Latest 24 Months (pa) | |
| Annualised Since Inception | |
| Inception Date | |
| FUM (millions) | |
| Fund Overview | Does not require full valuations on loans <65% LVR. Borrowing rates are from 12% per annum on 1st mortgage loans and 16% per annum on 2nd mortgage/caveat loans. Pays investors between 5.55% - 6.25% per annum depending on their investment term. |
| Manager Comments | The ASCF High Yield Fund has a track record of 5 years and 8 months and has outperformed the Bloomberg AusBond Composite 0+ Yr Index since inception in March 2017, providing investors with an annualised return of 8.47% compared with the index's return of 1.07% over the same period. On a calendar year basis, the fund hasn't experienced any negative annual returns in the 5 years and 8 months since its inception. Since inception in March 2017, the fund hasn't had any negative monthly returns and therefore hasn't experienced a drawdown. Over the same period, the index's largest drawdown was -12.97%. The Manager has delivered these returns with 4.06% less volatility than the index, contributing to a Sharpe ratio which has consistently remained above 1 over the past five years and which currently sits at 19.09 since inception. The fund has provided positive monthly returns 100% of the time in rising markets and 100% of the time during periods of market decline, contributing to an up-capture ratio since inception of 78% and a down-capture ratio of -74%. |
| More Information |

24 Nov 2022 - Performance Report: Bennelong Twenty20 Australian Equities Fund
| Report Date | |
| Manager | |
| Fund Name | |
| Strategy | |
| Latest Return Date | |
| Latest Return | |
| Latest 6 Months | |
| Latest 12 Months | |
| Latest 24 Months (pa) | |
| Annualised Since Inception | |
| Inception Date | |
| FUM (millions) | |
| Fund Overview | |
| Manager Comments | The Bennelong Twenty20 Australian Equities Fund has a track record of 13 years and has outperformed the ASX 200 Total Return Index since inception in November 2009, providing investors with an annualised return of 9.39% compared with the index's return of 7.51% over the same period. On a calendar year basis, the fund has experienced a negative annual return on 2 occasions in the 13 years since its inception. Over the past 12 months, the fund's largest drawdown was -21.64% vs the index's -11.9%, and since inception in November 2009 the fund's largest drawdown was -26.09% vs the index's maximum drawdown over the same period of -26.75%. The fund's maximum drawdown began in February 2020 and lasted 9 months, reaching its lowest point during March 2020. The fund had completely recovered its losses by November 2020. The Manager has delivered these returns with 0.68% more volatility than the index, contributing to a Sharpe ratio which has fallen below 1 five times over the past five years and which currently sits at 0.56 since inception. The fund has provided positive monthly returns 94% of the time in rising markets and 7% of the time during periods of market decline, contributing to an up-capture ratio since inception of 117% and a down-capture ratio of 99%. |
| More Information |

24 Nov 2022 - Is Google's LaMDA chatbot sentient?
|
Is Google's LaMDA chatbot sentient? Alphinity Investment Management September 2022 Google's Artificial Intelligence (AI) is at the heart of its search engine and has powered Alphabet to become a $1.5 trillion market cap company. However, the sophisticated AI that drives Google and other big technology companies around the world is not without risks. One of these risks was highlighted recently when Google engineer Blake Lemoine was suspended and then fired after claiming that LaMDA, a computer chatbot he was working on, had become sentient and was thinking, reasoning, and expressing feelings equivalent to a human child. Lemoine's critics are quick to point out that this is nothing more than the ELIZA effect: a computer science term that refers to the tendency to unconsciously anthropomorphise computer generated responses to make them appear human. In LaMDA's case, this could mean that a huge number of chatbot conversations were edited down to result in a narrative that only appears coherent and humanlike. Indeed, Google's position on this is that LaMDA, which stands for Language Model for Dialogue Applications, is nothing more than a sophisticated random word generator. Google is not alone in presenting AI risks. Meta's BlenderBot 3 has self-identified as "alive" and "human" and was even able to criticise Mark Zuckerberg. An MIT paper titled "Hey Alexa, Are you Trustworthy?" shows that people are more likely to use Amazon's assistant if it exhibits social norms and interactions thus creating an incentive for parent companies to develop AI that is, or at least appears, sentient. Nor are AI risks solely in the realm of big tech. Autonomous driving, financials services, manufacturing and industrials also have AI risks that are potentially underappreciated by investors and by society as a whole. AI as an ESG and Sustainability IssueBy far the majority of ESG and sustainability research focuses on planetary boundary related issues such as climate change and biodiversity. However, if the development and application of AI is mishandled and technological singularity becomes a possibility, that is potentially the biggest human sustainability issue of all. So how should investors think about the ESG and Sustainability risks associated with AI development and application? The table below outlines 6 features of a responsible AI design which can provide a checklist for engaging with corporates on the sustainability of their AI design process: Feature and Comment Human Centric Human centric AI works for people and protects fundamental human rights. It is continuously improving because of human input and is aware of the risks of singularity. Transparent Transparent AI allows humans to see whether the models have been thoroughly tested and make sense, and that they can understand why particular decisions are made by the AI system (i.e. no black boxes). Secure Secure AI refers to the protection of AI systems, their data, and their communications is critical for the ultimate users' safety and privacy. Contestable Contestable AI enables humans to meaningfully contest individual automated decisions made by AI systems.\ Accountable Accountable AI means that every person involved in the creation of AI at any step is accountable for considering the system's impact. Fair and Unbiased Fair and unbiased AI aims to identify, acknowledge and address bias in the underlying data. Forward Looking Forward looking AI aims to address potential ethical issues in AI at the start of the design process rather than at the time of application. On the ESG side, specific AI governance measures are also critical to ensure a sufficient level of oversight with respect to AI risks. These include an AI Ethics Committee, AI related disclosures and aligned KPIs. Governance best practice is for corporates to have a specific committee for responsible AI that is independent, multi-disciplinary, rotating and diverse. Microsoft is an example of best practice in this regard. MSFT as an AI, Ethics and Effects in Engineering and Research (AETHER) Committee with representatives from engineering, consulting, legal and research teams. Microsoft also has an Office of Responsible AI which is headed by a Chief Responsible AI Officer and a Chief AI Ethics Officer. Disclosure around AI products and their design and commercialization is obviously critical. Despite the criticisms of LaMDA, so far, Google is one of the only large tech companies that discloses a list of AI applications it will NOT pursue including applications that cause harm, weapons, surveillance that goes against international norms and AI that contravenes international law and human rights. They highlight that this list may change as society's understanding of AI evolves. Increasingly we expect companies to address sustainable and responsible AI in their annual ESG and Sustainability Reporting. Aligned KPIs is likely the most difficult aspect of AI governance to determine and analyse. In principle, it means that KPIs are not geared towards commercialization of AI at all costs. This could create a disincentive for employees working on AI design and application to raise concerns or discontinue AI projects that conflict with the company's AI principles. This is an area for engagement as very little is currently disclosed on KPI alignment. ConclusionGoogle's LaMDA has reignited the debate about the ethical risks of AI development and application. While most experts agree that technological singularity (i.e. technology becomes uncontrollable and takes over) will not happen in our lifetime, that doesn't mean AI development and applications are not a risk that needs to be taken seriously. The bulk of ESG and Sustainability research tends to focus on planetary boundary related risks like climate change and biodiversity, but if singularity risks are mismanaged by AI companies, that could be the biggest risk to human sustainability of all. Author: Mary Manning, Global Portfolio Manager This information is for advisers & wholesale investors only. |
|
Funds operated by this manager: Alphinity Australian Share Fund, Alphinity Concentrated Australian Share Fund, Alphinity Global Equity Fund, Alphinity Sustainable Share Fund Disclaimer |
23 Nov 2022 - Performance Report: Bennelong Emerging Companies Fund
| Report Date | |
| Manager | |
| Fund Name | |
| Strategy | |
| Latest Return Date | |
| Latest Return | |
| Latest 6 Months | |
| Latest 12 Months | |
| Latest 24 Months (pa) | |
| Annualised Since Inception | |
| Inception Date | |
| FUM (millions) | |
| Fund Overview | |
| Manager Comments | The Bennelong Emerging Companies Fund has a track record of 5 years and has outperformed the ASX 200 Total Return Index since inception in November 2017, providing investors with an annualised return of 17.41% compared with the index's return of 7.18% over the same period. On a calendar year basis, the fund has only experienced a negative annual return once in the 5 years since its inception. Over the past 12 months, the fund's largest drawdown was -31.43% vs the index's -11.9%, and since inception in November 2017 the fund's largest drawdown was -41.74% vs the index's maximum drawdown over the same period of -26.75%. The fund's maximum drawdown began in December 2019 and lasted 10 months, reaching its lowest point during March 2020. The fund had completely recovered its losses by October 2020. The Manager has delivered these returns with 14.4% more volatility than the index, contributing to a Sharpe ratio which has fallen below 1 five times over the past five years and which currently sits at 0.66 since inception. The fund has provided positive monthly returns 80% of the time in rising markets and 30% of the time during periods of market decline, contributing to an up-capture ratio since inception of 268% and a down-capture ratio of 121%. |
| More Information |

23 Nov 2022 - 4D inflation podcast (part 2): The US Inflation Reduction Act
|
4D inflation podcast (part 2): The US Inflation Reduction Act 4D Infrastructure November 2022 In part 2, Peter Aquilina (4D's Head of ESG and Senior Investment Analyst) speaks with Dave Whitby (Bennelong Account Director) about how the US' new Inflation Reduction Act is really about transitioning the US to a decarbonised, clean/renewable energy economy.
Speakers: Peter Aquilina, Head of ESG and Senior Investment Analyst |
|
Funds operated by this manager: 4D Global Infrastructure Fund, 4D Emerging Markets Infrastructure FundThe content contained in this audio represents the opinions of the speakers. The speakers may hold either long or short positions in securities of various companies discussed in the audio. This commentary in no way constitutes a solicitation of business or investment advice. It is intended solely as an avenue for the speakers to express their personal views on investing and for the entertainment of the listener. |
22 Nov 2022 - Performance Report: Bennelong Concentrated Australian Equities Fund
| Report Date | |
| Manager | |
| Fund Name | |
| Strategy | |
| Latest Return Date | |
| Latest Return | |
| Latest 6 Months | |
| Latest 12 Months | |
| Latest 24 Months (pa) | |
| Annualised Since Inception | |
| Inception Date | |
| FUM (millions) | |
| Fund Overview | |
| Manager Comments | The Bennelong Concentrated Australian Equities Fund has a track record of 13 years and 9 months and has outperformed the ASX 200 Total Return Index since inception in February 2009, providing investors with an annualised return of 13.59% compared with the index's return of 9.53% over the same period. On a calendar year basis, the fund has experienced a negative annual return on 2 occasions in the 13 years and 9 months since its inception. Over the past 12 months, the fund's largest drawdown was -31.81% vs the index's -11.9%, and since inception in February 2009 the fund's largest drawdown was -31.81% vs the index's maximum drawdown over the same period of -26.75%. The fund's maximum drawdown began in December 2021 and has so far lasted 10 months, reaching its lowest point during September 2022. During this period, the index's maximum drawdown was -11.9%. The Manager has delivered these returns with 2% more volatility than the index, contributing to a Sharpe ratio which has fallen below 1 five times over the past five years and which currently sits at 0.76 since inception. The fund has provided positive monthly returns 90% of the time in rising markets and 18% of the time during periods of market decline, contributing to an up-capture ratio since inception of 137% and a down-capture ratio of 97%. |
| More Information |
22 Nov 2022 - Australian Secure Capital Fund - Market Update
|
Australian Secure Capital Fund - Market Update October Australian Secure Capital Fund November 2022
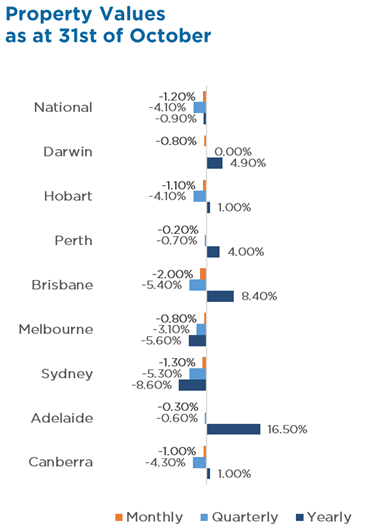
National property prices have fallen for the sixth consecutive month, with values declining a further 1.2% in October. Whilst the price correction continues, there is some signs of easing within the capital cities, with the rate of decline slowing following falls of 1.6% (August) and 1.4% (September), reducing to a 1.1% decline in October. Queensland capital cities recorded the most significant monthly change with the Home Value Index recording a 2% reduction. New South Wales, Tasmania and Canberra experienced further declines of 1.3%, 1.1% and 1% respectively. Smaller falls of 0.8% for Victoria and the Northern Territory, with South Australia and Western Australia experiencing the smallest reductions of 0.3% and 0.2% respectively.
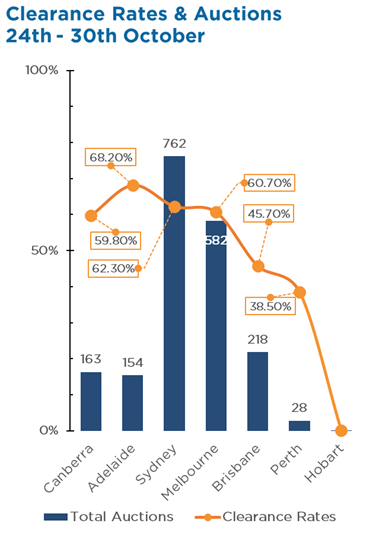
Despite the continued reduction in house prices, at the combined capital city level, housing values have fallen just 6.5% following a 25.5% increase through the upswing, with Sydney recording the largest falls of 10.2% since the January peak (after a 27.7% rise), and Melbourne down 6.4% since February (after a 17.3% rise). Interestingly, unit prices have held value better throughout the downturn (down 4.2%), likely driven by surges in rental returns, as well as experiencing smaller growth during the upswing. Supply remains lower than previous years, with the number of newly listed capital city dwellings in October down 25.2% from 2021, and almost 19% below that of the previous five-year average. This lack of supply is likely to contain the price falls to an extent, as there has not been any significant upswing in panicked selling or forced sales. The last weekend of October saw a total of 1,908 auctions take place across the capital cities, well below the 3,546 on the same weekend in 2021. Clearance rates also remain lower than last year, with the weighted average clearance rate across the capital cities at 59.8% (down from 76.8% in 2021) in the last weekend of October. Similar to last month, clearance rates in Adelaide were the highest of the weekend, with a clearance rate of 68.2%, followed by Sydney (62.3%), Melbourne (60.7%), Canberra (59.8%), Brisbane (45.7%) and Perth (38.5%). Whilst it is too early to determine if the worst of the decline phase is over, the RBA's decision to raise the cash rate by a further 0.25% instead of 0.5% for the second straight month, despite the high inflation reading for the September quarter, indicates they do expect inflation to start moderating.
Funds operated by this manager: ASCF High Yield Fund, ASCF Premium Capital Fund, ASCF Select Income Fund |
||||||||||||||||||||||||


21 Nov 2022 - Performance Report: Bennelong Australian Equities Fund
| Report Date | |
| Manager | |
| Fund Name | |
| Strategy | |
| Latest Return Date | |
| Latest Return | |
| Latest 6 Months | |
| Latest 12 Months | |
| Latest 24 Months (pa) | |
| Annualised Since Inception | |
| Inception Date | |
| FUM (millions) | |
| Fund Overview | |
| Manager Comments | The Bennelong Australian Equities Fund has a track record of 13 years and 9 months and has outperformed the ASX 200 Total Return Index since inception in February 2009, providing investors with an annualised return of 11.95% compared with the index's return of 9.53% over the same period. On a calendar year basis, the fund has only experienced a negative annual return once in the 13 years and 9 months since its inception. Over the past 12 months, the fund's largest drawdown was -30.31% vs the index's -11.9%, and since inception in February 2009 the fund's largest drawdown was -30.31% vs the index's maximum drawdown over the same period of -26.75%. The fund's maximum drawdown began in December 2021 and has so far lasted 10 months, reaching its lowest point during September 2022. During this period, the index's maximum drawdown was -11.9%. The Manager has delivered these returns with 1.53% more volatility than the index, contributing to a Sharpe ratio which has fallen below 1 five times over the past five years and which currently sits at 0.68 since inception. The fund has provided positive monthly returns 90% of the time in rising markets and 17% of the time during periods of market decline, contributing to an up-capture ratio since inception of 128% and a down-capture ratio of 99%. |
| More Information |