
NEWS

29 Nov 2022 - Performance Report: Cyan C3G Fund
| Report Date | |
| Manager | |
| Fund Name | |
| Strategy | |
| Latest Return Date | |
| Latest Return | |
| Latest 6 Months | |
| Latest 12 Months | |
| Latest 24 Months (pa) | |
| Annualised Since Inception | |
| Inception Date | |
| FUM (millions) | |
| Fund Overview | Cyan C3G Fund is based on the investment philosophy which can be defined as a comprehensive, clear and considered process focused on delivering growth. These are identified through stringent filter criteria and a rigorous research process. The Manager uses a proprietary stock filter in order to eliminate a large proportion of investments due to both internal characteristics (such as gearing levels or cash flow) and external characteristics (such as exposure to commodity prices or customer concentration). Typically, the Fund looks for businesses that fit one or more of the following criteria: a) under researched, b) fundamentally undervalued, c) have a catalyst for re-rating. The Manager seeks to achieve this investment outcome by actively managing a portfolio of Australian listed securities. When the opportunity to invest in suitable securities cannot be found, the manager may reduce the level of equities exposure and accumulate a defensive cash position. Whilst it is the company's intention, there is no guarantee that any distributions or returns will be declared, or that if declared, the amount of any returns will remain constant or increase over time. The Fund does not invest in derivatives and does not use debt to leverage performance. However, companies in which the Fund invests may be leveraged. |
| Manager Comments | The Cyan C3G Fund has a track record of 8 years and 3 months and has outperformed the ASX Small Ordinaries Total Return Index since inception in August 2014, providing investors with an annualised return of 6.31% compared with the index's return of 5.78% over the same period. On a calendar year basis, the fund has only experienced a negative annual return once in the 8 years and 3 months since its inception. Over the past 12 months, the fund's largest drawdown was -44.03% vs the index's -24.12%, and since inception in August 2014 the fund's largest drawdown was -45.18% vs the index's maximum drawdown over the same period of -29.12%. The fund's maximum drawdown began in November 2021 and has so far lasted 11 months, reaching its lowest point during September 2022. During this period, the index's maximum drawdown was -24.24%. The Manager has delivered these returns with 0.96% more volatility than the index, contributing to a Sharpe ratio which has fallen below 1 five times over the past five years and which currently sits at 0.36 since inception. The fund has provided positive monthly returns 85% of the time in rising markets and 35% of the time during periods of market decline, contributing to an up-capture ratio since inception of 57% and a down-capture ratio of 83%. |
| More Information |

29 Nov 2022 - Performance Report: DS Capital Growth Fund
| Report Date | |
| Manager | |
| Fund Name | |
| Strategy | |
| Latest Return Date | |
| Latest Return | |
| Latest 6 Months | |
| Latest 12 Months | |
| Latest 24 Months (pa) | |
| Annualised Since Inception | |
| Inception Date | |
| FUM (millions) | |
| Fund Overview | The investment team looks for industrial businesses that are simple to understand, generally avoiding large caps, pure mining, biotech and start-ups. They also look for: - Access to management; - Businesses with a competitive edge; - Profitable companies with good margins, organic growth prospects, strong market position and a track record of healthy dividend growth; - Sectors with structural advantage and barriers to entry; - 15% p.a. pre-tax compound return on each holding; and - A history of stable and predictable cash flows that DS Capital can understand and value. |
| Manager Comments | The DS Capital Growth Fund has a track record of 9 years and 10 months and has outperformed the ASX 200 Total Return Index since inception in January 2013, providing investors with an annualised return of 12.46% compared with the index's return of 8.46% over the same period. On a calendar year basis, the fund has only experienced a negative annual return once in the 9 years and 10 months since its inception. Over the past 12 months, the fund's largest drawdown was -21.56% vs the index's -11.9%, and since inception in January 2013 the fund's largest drawdown was -22.53% vs the index's maximum drawdown over the same period of -26.75%. The fund's maximum drawdown began in February 2020 and lasted 6 months, reaching its lowest point during March 2020. The fund had completely recovered its losses by August 2020. The Manager has delivered these returns with 1.59% less volatility than the index, contributing to a Sharpe ratio which has fallen below 1 five times over the past five years and which currently sits at 0.9 since inception. The fund has provided positive monthly returns 88% of the time in rising markets and 33% of the time during periods of market decline, contributing to an up-capture ratio since inception of 66% and a down-capture ratio of 66%. |
| More Information |

29 Nov 2022 - Investing in climate adaptation for a resilient world
|
Investing in climate adaptation for a resilient world abrdn November 2022 Key takeaways
The urgent need for adaptation Whilst much of the climate narrative focuses on achieving 'net zero' in the decades ahead, it is becoming increasingly apparent just how dramatically our climate is already changing. The last year has once again delivered record climate events with devastating impacts - deadly heatwaves across Southern Asia, severe flooding in Pakistan, South Africa and Brazil, drought across China and south-western states in the US, and ice shelf collapse in Antarctica, to name a few. 2021 losses from climate related events were estimated by Munich Re to be the second highest in history and this is likely to be exceeded this year- with clear risks to society, businesses and the economy. Adapting to these physical impacts of climate change is therefore absolutely critical. A year on from COP26, and Climate Action Tracker shows that country pledges will still fail to limit warming to below 2°C, let alone the 1.5°C target. But even the most optimistic climate scenarios result in an increase in warming and therefore a continuation of the rise in frequency and severity of extreme events and a worsening of chronic changes. It is therefore too late to focus on climate mitigation (i.e. decarbonisation) alone. We need to ensure that our communities, businesses and economies are resilient to these impacts. The widening adaptation gap The 2022 Adaptation Gap Report identifies that, whilst adaptation finance is rising as a proportion of total climate financing (34% in 2020 compared to 14% in 2019), combined mitigation and adaptation flows have actually fallen over the last reporting period. The UNEP report estimates that the annual adaptation costs in developing countries alone to be in the range of $160-340 billion by 2030, and almost doubling again by 2050. By this assessment, adaptation finance needs are currently between 5 to 10 times higher than adaptation finance flows, and growing. We highlight this adaptation gap as one of four critical interconnected gaps that need to be adequately addressed at COP27. In addition, it was agreed at COP15 in 2009 that developed nations would provide climate finance of $100 billion a year by 2020 to developing nations for mitigation and adaptation. That promise was broken. A key minimum requirement for COP27 is ensuring that this commitment to public financing is met. However, even if this was met and it was all allocated to adaptation it would still fall far short of what is required. There needs to be a more integrated approach to mainstream adaptation finance- as current approaches tend to be piecemeal, localised and responsive to current impacts. Lessons learned from the pandemic need to be applied to ensure coordinated global, national and local response to improve resilience and adaptation financing. The Global Commission on Adaptation has identified $1.8 trillion in adaptation investments that could deliver net benefits of $7.1 trillion by 2030. Despite this growing evidence of the benefits, less than 2% of adaptation finance currently comes from private sources. There are a number of reasons why private investment in adaptation has been limited to date:
It is clear that public finance alone is not going to close the widening gap. So existing barriers to mobilising private finance need to be addressed to grow opportunities for private investors.
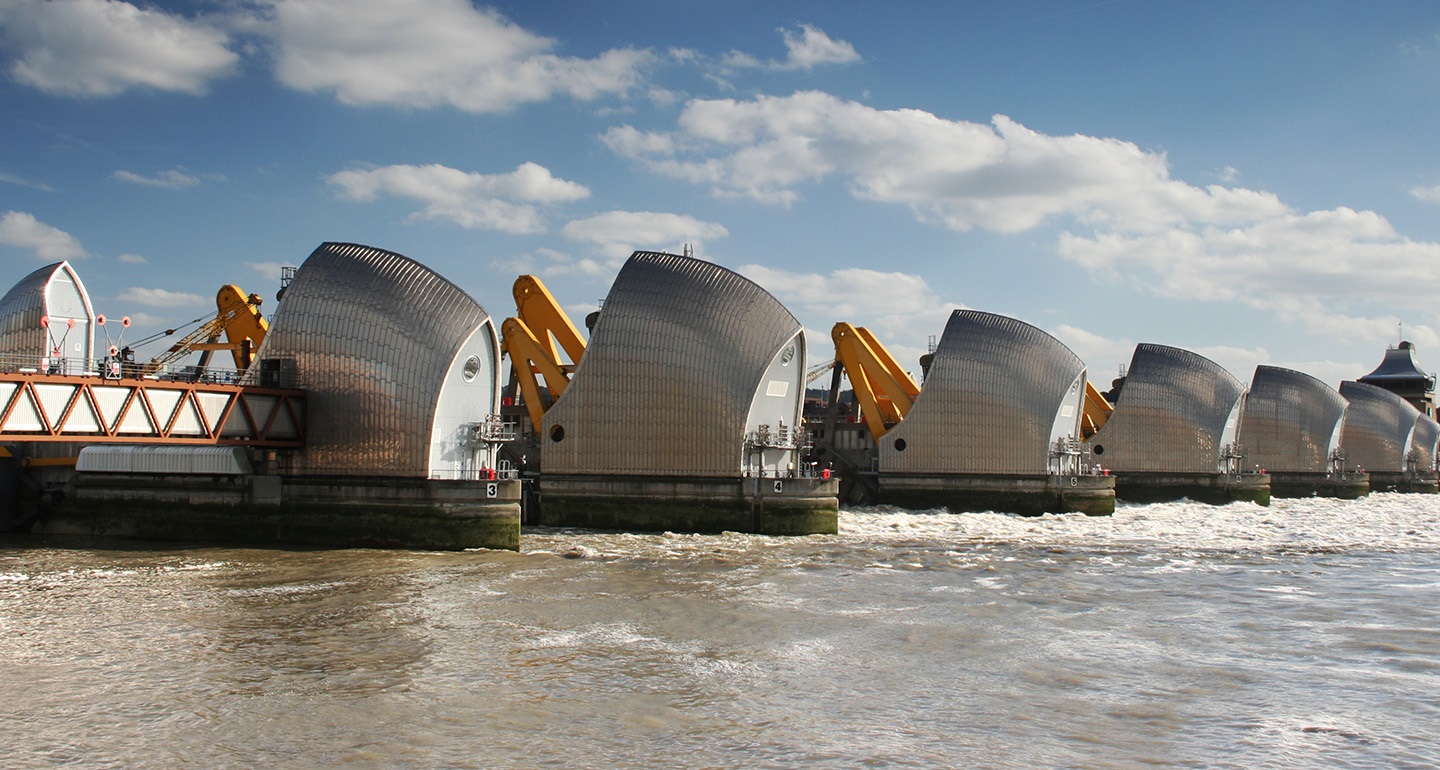
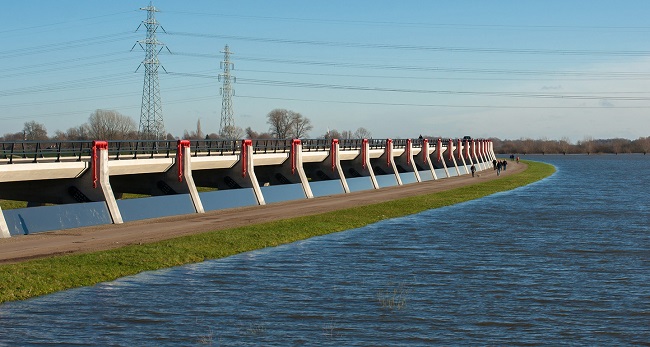
The importance of investing in adaptation Physical impacts of climate change affect every sector and region on the planet. Some however are more severely impacted than others and we highlight three particular sectors below:
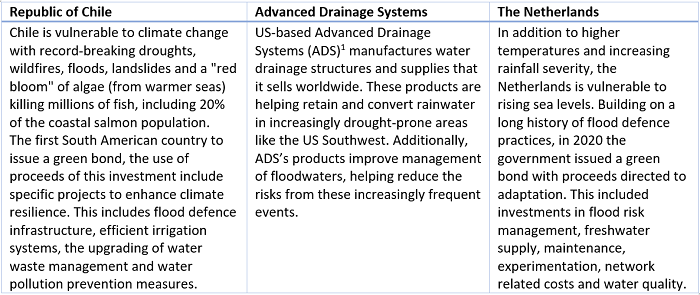
Without adaptation, businesses face physical damage and power outages. Extreme weather may also interfere with renewables providing a reliable energy source. It's likely there will also be more supply-chain disruptions, insurance losses, commodity shortages and inflation. This provides a clear financial case for incorporating climate adaptation into investment decisions to build resilience. Investment opportunities for adaptation and resilience 1. Understanding and incorporating the physical risks of climate change into decision-making Financial institutions need to understand how the assets they invest in assess and manage the physical risks of climate change in line with the recommendations of the TCFD and integrate this into asset valuations. The Coalition for Climate Resilient Investment (CCRI) is a private sector-led initiative launched in 2019 which abrdn are members of and aims to ensure that physical climate risks are systematically integrated into all investment decisions by 2025. The goal is to improve the pricing in of climate change in order to de-risk the investment for financial partners, provide investor confidence and help mobilise capital towards climate resilient investment. A key output of the initiative is the PCRAM framework which provides a methodology for pricing physical climate risks into infrastructure investments. Incorporating an assessment of acute and chronic physical risks is a core part of our due diligence process for new infrastructure investments, but this can differ considerably depending on the type of asset and its location. This is equally important for publicly-listed assets. Our bespoke climate scenario analysis framework provides a forward-looking view of the impact of climate change on asset values. Our approach to scenarios allows us to disaggregate the company-level results from different scenarios into the impact drivers, including physical risk and adaptation. This provides an indication of the potential direct physical impact on assets that companies are facing. Given the location-specific nature of physical risks, this then needs to be explored in more detail at individual-asset level. For this reason we are focussing on in-depth scenario analysis at building-level for our own real estate portfolio. 2. Investing in adaptation solutions There are vast opportunities for investors to become involved in helping countries and businesses strengthen resilience against climate extremes. This includes utility companies creating more weather-resistant grids; homebuilders specialising in heat- and flood-resistant designs; and governments with innovative resilience projects. These opportunities will only expand in the years ahead. Research by Munich Re has shown that linking adaptation and insurance, for example by restoring coral reefs that reduce storm damage, or by planting to alleviate flooding, could lead to reduced premiums and a six-fold return on investment. Adaptation investments should be a growing and important part of the investment universe for climate-focused strategies. By including these opportunities alongside climate change mitigation ideas, thematic investors can diversify their exposures while contributing to a critically underfunded part of the solution to climate change. In fixed income at abrdn, this process seeks to determine an understanding of the link between a bond issuer and its impact on adaptation. Assessing the nature and extent of the relevant physical risks and how these are being addressed by the issuer's actions has led to several investment ideas that contribute to climate change adaptation. Three examples of bond issuers and their approaches to adaptation are highlighted in the table below. It is time for investors to wake up to the reality of climate change today and invest not just in mitigating its causes, but also in adapting to its consequences. The need for adaptation solutions will only expand in the years ahead as temperatures continue to rise. Author: Tzoulianna Leventi, Investment and ESG Analyst |
|
Funds operated by this manager: Aberdeen Standard Actively Hedged International Equities Fund, Aberdeen Standard Asian Opportunities Fund, Aberdeen Standard Australian Small Companies Fund, Aberdeen Standard Emerging Opportunities Fund, Aberdeen Standard Ex-20 Australian Equities Fund (Class A), Aberdeen Standard Focused Sustainable Australian Equity Fund, Aberdeen Standard Fully Hedged International Equities Fund, Aberdeen Standard Global Absolute Return Strategies Fund, Aberdeen Standard Global Corporate Bond Fund, Aberdeen Standard International Equity Fund , Aberdeen Standard Life Absolute Return Global Bond Strategies Fund, Aberdeen Standard Multi Asset Real Return Fund, Aberdeen Standard Multi-Asset Income Fund 1 Discussion of individual securities in this article is for informational purposes only and not meant as a buy or sell recommendation nor as an indication of any holdings in our products. |


28 Nov 2022 - Performance Report: PURE Income & Growth Fund
| Report Date | |
| Manager | |
| Fund Name | |
| Strategy | |
| Latest Return Date | |
| Latest Return | |
| Latest 6 Months | |
| Latest 12 Months | |
| Latest 24 Months (pa) | |
| Annualised Since Inception | |
| Inception Date | |
| FUM (millions) | |
| Fund Overview | For fund investors, The PURE Income & Growth Fund offers a unique risk/return profile. This includes a high yield, yet retains equity exposure to successful growth stories. The Fund's superior position in the investee Company's capital structure insulates investors from capital loss. PURE targets a return of 15% per annum through the investment cycle from a mixture of Income (7-9%) and capital growth. While most investments involve ASX listed companies, the Fund's mandate retains some flexibility to capitalise on attractive pre-IPO opportunities. |
| Manager Comments | The PURE Income & Growth Fund has a track record of 3 years and 11 months and therefore comparison over all market conditions and against its peers is limited. However, the fund has outperformed the S&P/ASX Small Industrials TR Index since inception in December 2018, providing investors with an annualised return of 14.45% compared with the index's return of 3.31% over the same period. On a calendar year basis, the fund has only experienced a negative annual return once in the 3 years and 11 months since its inception. Over the past 12 months, the fund's largest drawdown was -3.81% vs the index's -26.59%, and since inception in December 2018 the fund's largest drawdown was -5.86% vs the index's maximum drawdown over the same period of -29.79%. The fund's maximum drawdown began in February 2020 and lasted 3 months, reaching its lowest point during March 2020. The fund had completely recovered its losses by May 2020. The Manager has delivered these returns with 9.55% less volatility than the index, contributing to a Sharpe ratio which has fallen below 1 two times over the past three years and which currently sits at 1.09 since inception. The fund has provided positive monthly returns 72% of the time in rising markets and 50% of the time during periods of market decline, contributing to an up-capture ratio since inception of 22% and a down-capture ratio of -25%. |
| More Information |
28 Nov 2022 - Performance Report: Collins St Value Fund
| Report Date | |
| Manager | |
| Fund Name | |
| Strategy | |
| Latest Return Date | |
| Latest Return | |
| Latest 6 Months | |
| Latest 12 Months | |
| Latest 24 Months (pa) | |
| Annualised Since Inception | |
| Inception Date | |
| FUM (millions) | |
| Fund Overview | The managers of the fund intend to maintain a concentrated portfolio of investments in ASX listed companies that they have investigated and consider to be undervalued. They will assess the attractiveness of potential investments using a number of common industry based measures, a proprietary in-house model and by speaking with management, industry experts and competitors. Once the managers form a view that an investment offers sufficient upside potential relative to the downside risk, the fund will seek to make an investment. If no appropriate investment can be identified the managers are prepared to hold cash and wait for the right opportunities to present themselves. |
| Manager Comments | The Collins St Value Fund has a track record of 6 years and 9 months and has outperformed the ASX 200 Total Return Index since inception in February 2016, providing investors with an annualised return of 14.17% compared with the index's return of 9.16% over the same period. On a calendar year basis, the fund hasn't experienced any negative annual returns in the 6 years and 9 months since its inception. Over the past 12 months, the fund's largest drawdown was -20.25% vs the index's -11.9%, and since inception in February 2016 the fund's largest drawdown was -27.46% vs the index's maximum drawdown over the same period of -26.75%. The fund's maximum drawdown began in February 2020 and lasted 7 months, reaching its lowest point during March 2020. The fund had completely recovered its losses by September 2020. The Manager has delivered these returns with 3.79% more volatility than the index, contributing to a Sharpe ratio which has fallen below 1 five times over the past five years and which currently sits at 0.77 since inception. The fund has provided positive monthly returns 83% of the time in rising markets and 61% of the time during periods of market decline, contributing to an up-capture ratio since inception of 75% and a down-capture ratio of 55%. |
| More Information |

28 Nov 2022 - Performance Report: Bennelong Long Short Equity Fund
| Report Date | |
| Manager | |
| Fund Name | |
| Strategy | |
| Latest Return Date | |
| Latest Return | |
| Latest 6 Months | |
| Latest 12 Months | |
| Latest 24 Months (pa) | |
| Annualised Since Inception | |
| Inception Date | |
| FUM (millions) | |
| Fund Overview | In a typical environment the Fund will hold around 70 stocks comprising 35 pairs. Each pair contains one long and one short position each of which will have been thoroughly researched and are selected from the same market sector. Whilst in an ideal environment each stock's position will make a positive return, it is the relative performance of the pair that is important. As a result the Fund can make positive returns when each stock moves in the same direction provided the long position outperforms the short one in relative terms. However, if neither side of the trade is profitable, strict controls are required to ensure losses are limited. The Fund uses no derivatives and has no currency exposure. The Fund has no hard stop loss limits, instead relying on the small average position size per stock (1.5%) and per pair (3%) to limit exposure. Where practical pairs are always held within the same sector to limit cross sector risk, and positions can be held for months or years. The Bennelong Market Neutral Fund, with same strategy and liquidity is available for retail investors as a Listed Investment Company (LIC) on the ASX. |
| Manager Comments | The Bennelong Long Short Equity Fund has a track record of 20 years and 9 months and has outperformed the ASX 200 Total Return Index since inception in February 2002, providing investors with an annualised return of 12.68% compared with the index's return of 7.85% over the same period. On a calendar year basis, the fund has experienced a negative annual return on 3 occasions in the 20 years and 9 months since its inception. Over the past 12 months, the fund's largest drawdown was -19.13% vs the index's -11.9%, and since inception in February 2002 the fund's largest drawdown was -30.59% vs the index's maximum drawdown over the same period of -47.19%. The fund's maximum drawdown began in September 2020 and has so far lasted 2 years and 1 month, reaching its lowest point during June 2022. During this period, the index's maximum drawdown was -15.05%. The Manager has delivered these returns with 0.44% less volatility than the index, contributing to a Sharpe ratio which has fallen below 1 five times over the past five years and which currently sits at 0.74 since inception. The fund has provided positive monthly returns 65% of the time in rising markets and 59% of the time during periods of market decline, contributing to an up-capture ratio since inception of 4% and a down-capture ratio of -113%. |
| More Information |

28 Nov 2022 - New Funds on Fundmonitors.com
|
New Funds on FundMonitors.com |
|
Below are some of the funds we've recently added to our database. Follow the links to view each fund's profile, where you'll have access to their offer documents, monthly reports, historical returns, performance analytics, rankings, research, platform availability, and news & insights. |
|
|
|||||||||||||||||||
| Frame Long Short Australian Equity Fund | |||||||||||||||||||
|
|||||||||||||||||||
|
|
|||||||||||||||||||
 |
|||||||||||||||||||
| Balmoral Digital Momentum Fund Two | |||||||||||||||||||
|
|||||||||||||||||||
| View Profile | |||||||||||||||||||
|
Want to see more funds? |
|||||||||||||||||||
|
Subscribe for full access to these funds and over 700 others |


28 Nov 2022 - 10k Words
|
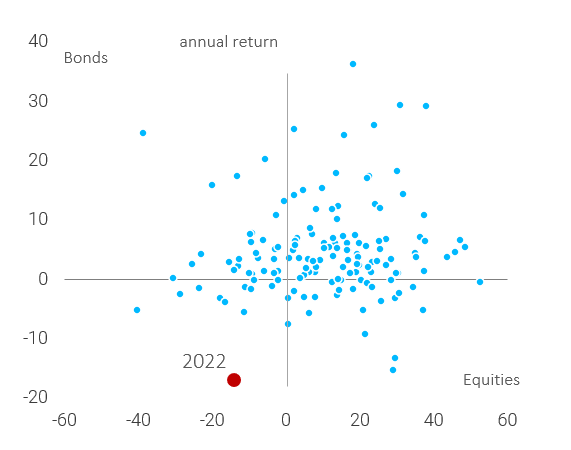
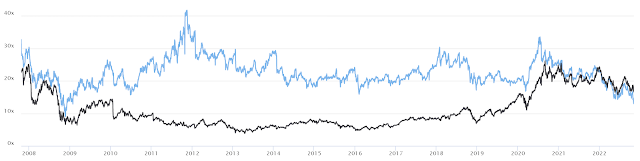
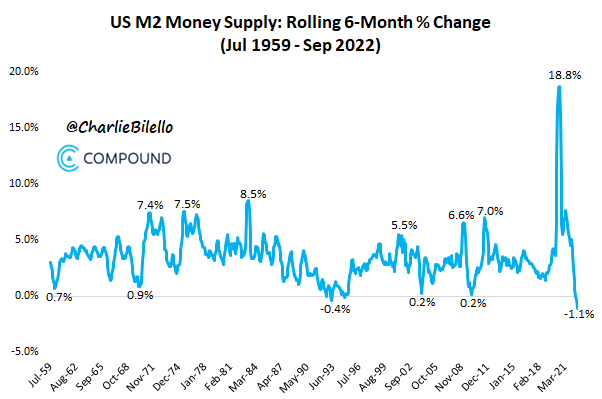
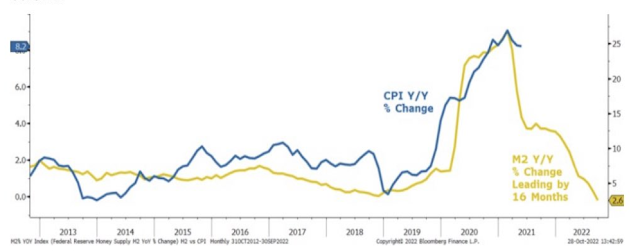
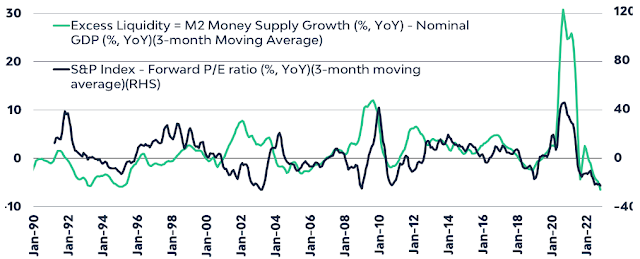
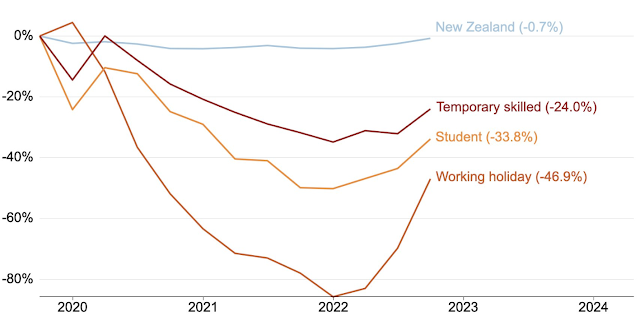
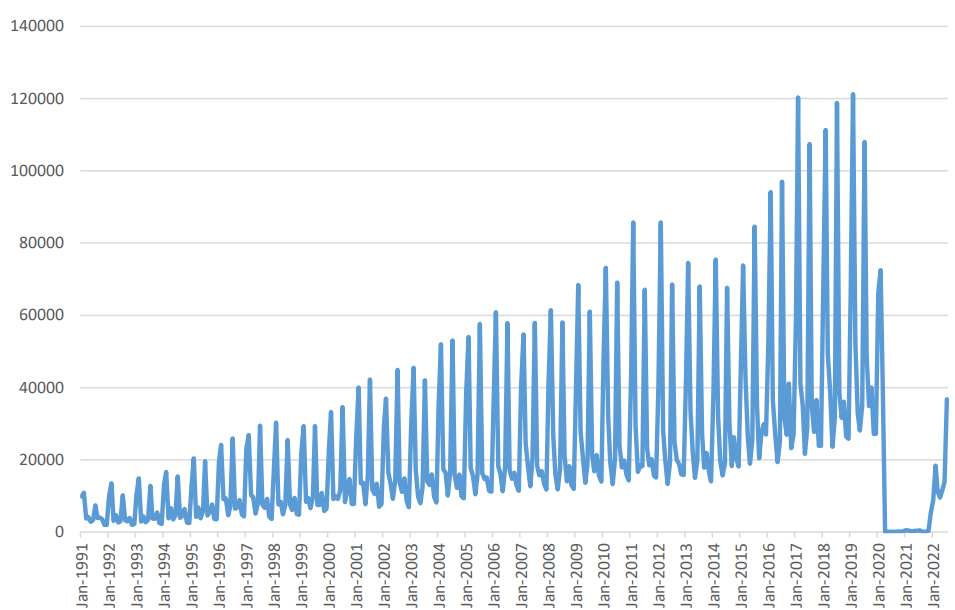
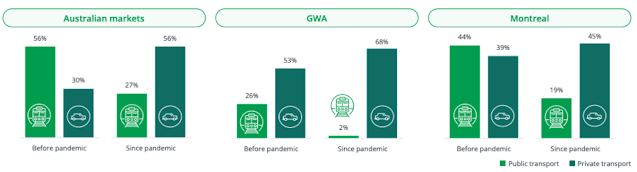
10k Words Equitable Investors November 2022 There hasn't been a year quite like this one for investment markets - just look at where @darioperkins plots 2022's returns. While we are sticking with that theme, CNBC tallies $US3 trillion in lost market cap from just seven companies in one year. As a valuation check, Amazon is now trading well below its long-term average EV/EBITDA multiple - while Apple remains above its own. With the "M2" measure of money supply in the US plunging the most on record in a six month period, as highlighted by @CharlieBillelo, Morgan Stanley chartered the historical correlation between M2 and inflation; and True Insights looked at the correlation with stock valuations. An exploration of the pre-and-post COVID worlds has us looking at Australian temporary visas through Grattan Institute's chart, student arrivals in Australia via Pac Partners and finally, a significant shift in communter preferences that suits toll road operator Transurban just fine. Annual US bond and equity returns since 1870 Source: @darioperkins $US3 trillion lost in seven companies in one year
Forward EV/EBITDA of Amazon and Apple
US "M2" money supply experienced its largest decline over a six month period on record Source: @CharlieBilello Inflation relative to changes in the "M2" money supply for the United States Source: Morgan Stanley, Bloomberg S&P 500 Forward PE change relative to changes in "M2" money supply Source: True Insights Change in temporary visa-holders in Australia since pre-COVID Source: Grattan Institute Student arrivals per month into Australia Source: ABS, PAC Partners Preferences for commuting mode before and after COVID Source: Transurban November Edition Funds operated by this manager: Equitable Investors Dragonfly Fund Disclaimer Nothing in this blog constitutes investment advice - or advice in any other field. Neither the information, commentary or any opinion contained in this blog constitutes a solicitation or offer by Equitable Investors Pty Ltd (Equitable Investors) or its affiliates to buy or sell any securities or other financial instruments. Nor shall any such security be offered or sold to any person in any jurisdiction in which such offer, solicitation, purchase, or sale would be unlawful under the securities laws of such jurisdiction. The content of this blog should not be relied upon in making investment decisions. Any decisions based on information contained on this blog are the sole responsibility of the visitor. In exchange for using this blog, the visitor agree to indemnify Equitable Investors and hold Equitable Investors, its officers, directors, employees, affiliates, agents, licensors and suppliers harmless against any and all claims, losses, liability, costs and expenses (including but not limited to legal fees) arising from your use of this blog, from your violation of these Terms or from any decisions that the visitor makes based on such information. This blog is for information purposes only and is not intended to be relied upon as a forecast, research or investment advice. The information on this blog does not constitute a recommendation, offer or solicitation to buy or sell any securities or to adopt any investment strategy. Although this material is based upon information that Equitable Investors considers reliable and endeavours to keep current, Equitable Investors does not assure that this material is accurate, current or complete, and it should not be relied upon as such. Any opinions expressed on this blog may change as subsequent conditions vary. Equitable Investors does not warrant, either expressly or implied, the accuracy or completeness of the information, text, graphics, links or other items contained on this blog and does not warrant that the functions contained in this blog will be uninterrupted or error-free, that defects will be corrected, or that the blog will be free of viruses or other harmful components. Equitable Investors expressly disclaims all liability for errors and omissions in the materials on this blog and for the use or interpretation by others of information contained on the blog |


25 Nov 2022 - Hedge Clippings |25 November 2022
|
|
|
|
Hedge Clippings | Friday, 25 November 2022 "One swallow doth not a summer make" So goes the old saying - just how old might surprise some readers, given its origin can be traced back to the Greek philosopher Aristotle, (384-322 BC) following which its first recorded use in the English language was more recently in 1539. But we digress, because we're using the phrase to describe the economy, and markets, which following a dismal year to date, not only had a welcome bounce or spring in October but have continued onward and upward in November. Time will tell if that's two "swallows" in a row, but it is certainly welcome. |
|
|
New Funds on FundMonitors.com Australian Secure Capital Fund - Market Update October | Australian Secure Capital Fund What drives poor returns? | Insync Fund Managers 4D inflation podcast (part 2): The US Inflation Reduction Act | 4D Infrastructure October 2022 Performance News Glenmore Australian Equities Fund Digital Asset Fund (Digital Opportunities Class) Bennelong Emerging Companies Fund |
|
|
If you'd like to receive Hedge Clippings direct to your inbox each Friday
|

25 Nov 2022 - Performance Report: Argonaut Natural Resources Fund
| Report Date | |
| Manager | |
| Fund Name | |
| Strategy | |
| Latest Return Date | |
| Latest Return | |
| Latest 6 Months | |
| Latest 12 Months | |
| Latest 24 Months (pa) | |
| Annualised Since Inception | |
| Inception Date | |
| FUM (millions) | |
| Fund Overview | At times, ANRF may consider holding higher levels of cash (max 30%) if valuations are full and it is difficult to find attractive investment opportunities. The Fund does not borrow for investment or any other purposes, but it may short sell securities as part of its portfolio protection strategies. |
| Manager Comments | The Argonaut Natural Resources Fund has a track record of 2 years and 10 months and therefore comparison over all market conditions and against its peers is limited. However, the fund has outperformed the ASX 200 Total Return Index since inception in January 2020, providing investors with an annualised return of 42.39% compared with the index's return of 4.73% over the same period. On a calendar year basis, the fund hasn't experienced any negative annual returns in the 2 years and 10 months since its inception. Over the past 12 months, the fund's largest drawdown was -19.06% vs the index's -11.9%, and since inception in January 2020 the fund's largest drawdown was -19.06% vs the index's maximum drawdown over the same period of -26.75%. The fund's maximum drawdown began in April 2022 and has so far lasted 6 months, reaching its lowest point during June 2022. During this period, the index's maximum drawdown was -11.9%. The Manager has delivered these returns with 3.69% more volatility than the index, contributing to a Sharpe ratio for performance over the past 12 months of 1.14 and for performance since inception of 1.64. The fund has provided positive monthly returns 83% of the time in rising markets and 36% of the time during periods of market decline, contributing to an up-capture ratio since inception of 201% and a down-capture ratio of 37%. |
| More Information |