
NEWS

1 Aug 2025 - The Evolution and Benefits of Equity Income Funds in Australia's Growing Retirement Market
|
The Evolution and Benefits of Equity Income Funds in Australia's Growing Retirement Market Merlon Capital Partners July 2025
|
|
.Australia's growing retirement-age population has seen an increase in demand for and the availability of equity income funds over the last few decades. Australia's unique dividend imputation system means investors can successfully derive meaningful income as well as capital growth from holding Australian equities. Equity income strategies regularly make up a large component of the equity allocation for income-focused clients who seek a more defensive asset mix. Equity income funds have evolved significantly over time, beginning in the 1990s, with MLC and Colonial First State (now First Sentier Investors) launching equity income products. These initial products were not specifically focused on paying a regular, smoothed, tax-effective income but rather designed to grow capital before retirement to provide income once in retirement. The mid-2000s saw the equity income fund reimagined, designed specifically to meet retiree's key objectives - income generation, volatility management and capital growth over time. A number of managers developed products to meet these objectives at this time. The wake of the GFC saw growing recognition of the importance of total return generation from income, limiting the need to sell down holdings during market downturns. As a result, the equity income space continued to grow and through the 2010s, various managers launched new income funds, often with full market exposure. Additionally, with the rising popularity in passive investing through the 2010s, income-focused ETFs also emerged from leading ETF providers with the goal of generating income that exceeds the dividend yield offered by the broader market. With an aging population, the addressable market for equity income funds is only growing. Whilst not all equity income funds remain in existence today, there are a variety to choose from with over 15 Australian fund managers offering a product in this space. The need for regular income in retirement is well known and there are various ways to meet cashflow requirements. However, many of these tend to overlook the particularities of retirement. While fixed income products can help to meet an income objective, they fail to provide capital growth to protect against the impacts of inflation. A diminishing capital value on a real basis is inconsistent with the desire of many retirees for a growing capital base for both peace of mind and to leave an inheritance. Another option is to pursue an equity strategy centred solely on capital growth and simply selling down holdings when cashflow is required, rather than investing in income-generating investments. Yet, this ignores the fact that retirees are much more impacted by periods of drawdown than other investors, especially early in their retirement, amplified by their obligation to draw out from accounts when in pension phase. The GFC market crash and COVID-19 selloff in early 2020 demonstrated the serious consequences of needing to sell at an inopportune time and its long-term impact on total return. Skewing the components of equity total return to income removes the need to sell investments to raise cash when required. Proposed alternatives to equity income also ignore the value of franked dividends, which for retirees in pension phase present significantly more value than unfranked income or capital gains. Australian equity income strategies, when structured and executed appropriately, can provide strong total returns over time through attractive dividend yields and without sacrificing capital growth. The Merlon Australian Share Income Fund was launched in 2005 and led the innovation of contemporary equity income funds. It was the first product of its kind, aiming to provide above-market income with franking, grow capital over time with lower risk than the market. The non-benchmark portfolio has a high active share, blending well with both passive and direct share portfolios which are typically overweight large cap stocks. The Fund delivers above market income, the majority from franked dividends, paid monthly and has demonstrated strong risk-adjusted returns over multiple time periods. The strategy features a risk reduction overlay to insulate the Fund during periods of drawdown whilst retaining 100% of the franked dividend income generated from the underlying portfolio. Merlon's investment philosophy is based on the idea that behavioural biases create opportunities, even in markets considered "efficient". In particular, Merlon focuses on investing in companies where the market has become overly pessimistic, investing in undervalued companies with a focus on downside/bear case valuation to preserve capital. Merlon believes that buying companies when the market is overly pessimistic at low end of valuation range should result in growth of the capital base. Companies are valued on the basis of sustainable free cash flow, not dividend yield alone which is often a poor indicator of future performance and can lead to destruction of capital value. History has shown that investing in quality companies with sustainable free cash |
|
Funds operated by this manager: Merlon Australian Share Income Fund , Merlon Concentrated Australian Share Fund |
|
This material has been prepared by Merlon Capital Partners Pty Ltd (ABN 94 140 833 683 AFSL 343 753) (Merlon), the investment manager of The Merlon Australian Share Income Fund (Fund). Fidante Partners Limited ABN 94 002 835 592 AFSL 234668 | Fidante Partners Services Limited ABN 44 119 605 373 AFSL 320505] (Fidante) is a member of the Challenger Limited group of companies (Challenger Group) and is the responsible entity of the Fund. Other than information which is identified as sourced from Fidante in relation to the Fund, Fidante is not responsible for the information in this material, including any statements of opinion.It is general information only and is not intended to provide you with financial advice or take into account your objectives, financial situation or needs. You should consider, with a financial adviser, whether the information is suitable to your circumstances. The Fund's Target Market Determination and Product Disclosure Statement (PDS) available at www.fidante.com should be considered before making a decision about whether to buy or hold units in the Fund. To the extent permitted by law, no liability is accepted for any loss or damage as a result of any reliance on this information. Past performance is not a reliable indicator of future performance. Merlon and Fidante have entered into arrangements in connection with the distribution and administration of financial products to which this material relates. In connection with those arrangements, Merlon and Fidante may receive remuneration or other benefits in respect of financial services provided by the parties. Investments in the Fund are subject to investment risk, including possible delays in repayment and loss of income or principal invested. Accordingly, the performance, the repayment of capital or any particular rate of return on your investments are not guaranteed by any member of the Challenger Group. |

31 Jul 2025 - Unemployment's up. Is it just noise or a sign of things to come?
|
Unemployment's up. Is it just noise or a sign of things to come? Pendal July 2025 |
|
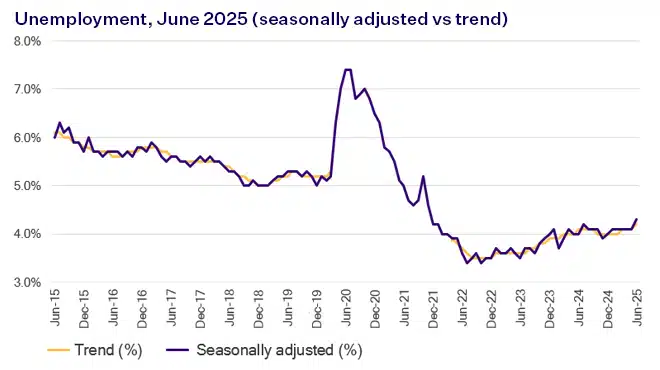
THE unemployment rate jumped to 4.3 % for June - the highest rate since late 2021. Job growth was a very tepid 2000. Hours worked fell by 0.9%. In trend terms - which we prefer over the more volatile, seasonally adjusted data - job growth was 22,800 while unemployment rose from 4.1% to 4.2%. Unemployment, June 2025 (seasonally adjusted vs trend):
Source: Australian Bureau of Statistics June was a relatively clean month - no elections or weather events - and the Bureau of Statistics offered no one-off excuses for the poor outcome. The Reserve Bank expected unemployment to end 2025 at 4.3%, having revised it up from 4.2% in May. Interestingly their forecast at the start of the year was 4.5%, but they lost patience as results earlier in the year were strong. Noise or new trend?The obvious question is whether this is just noise or the start of a new, upwards trend. Every month one eighth of the survey is rotated as respondents are surveyed over eight months - so there is some impact or noise to consider. However, as students of statistics will know, since each sample size is 3000 households (24,000 in the survey), the impact should be small. We won't get a breakdown by profession until the quarterly numbers, but rapid growth in non-market jobs (mainly education and healthcare) has masked softer market job growth for some time. There are signs this non-market job growth may be slowing, so unemployment may drift a bit higher into the end of year. However, forward indicators such as job vacancies and employment indicators in NAB's monthly business survey, do not suggest a sharp or rapid rise. August rate cut looks likelyThe Reserve Bank next meets on Tuesday, August 12. Today's data should all but seal a rate cut - only a massive quarterly inflation surprise at the end of July would stop it. The Q2 wage data and the next Labour force survey do not come out till after the meeting. The market has two-and-a-half cuts by year end and a terminal cash rate just above 3%. We still think bonds are range-bound by this data. Together with bonds sitting at the cheaper end of the range, we have added some duration to our portfolios. |
|
Funds operated by this manager: Pendal MicroCap Opportunities Fund , Pendal Global Select Fund - Class R , Pendal Sustainable Australian Fixed Interest Fund - Class R , Pendal Focus Australian Share Fund , Pendal Horizon Sustainable Australian Share Fund , Regnan Credit Impact Trust Fund , Pendal Sustainable Australian Share Fund , Pendal Sustainable Balanced Fund - Class R , Pendal Multi-Asset Target Return Fund |
|
This information has been prepared by Pendal Fund Services Limited (PFSL) ABN 13 161 249 332, AFSL No 431426 and is current as at December 8, 2021. PFSL is the responsible entity and issuer of units in the Pendal Multi-Asset Target Return Fund (Fund) ARSN: 623 987 968. A product disclosure statement (PDS) is available for the Fund and can be obtained by calling 1300 346 821 or visiting www.pendalgroup.com. The Target Market Determination (TMD) for the Fund is available at www.pendalgroup.com/ddo. You should obtain and consider the PDS and the TMD before deciding whether to acquire, continue to hold or dispose of units in the Fund. An investment in the Fund or any of the funds referred to in this web page is subject to investment risk, including possible delays in repayment of withdrawal proceeds and loss of income and principal invested. This information is for general purposes only, should not be considered as a comprehensive statement on any matter and should not be relied upon as such. It has been prepared without taking into account any recipient's personal objectives, financial situation or needs. Because of this, recipients should, before acting on this information, consider its appropriateness having regard to their individual objectives, financial situation and needs. This information is not to be regarded as a securities recommendation. The information may contain material provided by third parties, is given in good faith and has been derived from sources believed to be accurate as at its issue date. While such material is published with necessary permission, and while all reasonable care has been taken to ensure that the information is complete and correct, to the maximum extent permitted by law neither PFSL nor any company in the Pendal group accepts any responsibility or liability for the accuracy or completeness of this information. Performance figures are calculated in accordance with the Financial Services Council (FSC) standards. Performance data (post-fee) assumes reinvestment of distributions and is calculated using exit prices, net of management costs. Performance data (pre-fee) is calculated by adding back management costs to the post-fee performance. Past performance is not a reliable indicator of future performance. Any projections are predictive only and should not be relied upon when making an investment decision or recommendation. Whilst we have used every effort to ensure that the assumptions on which the projections are based are reasonable, the projections may be based on incorrect assumptions or may not take into account known or unknown risks and uncertainties. The actual results may differ materially from these projections. For more information, please call Customer Relations on 1300 346 821 8am to 6pm (Sydney time) or visit our website www.pendalgroup.com |

30 Jul 2025 - The Rise of Gamified Fandom: Why Gen Z Is Reshaping the Sports Industry

29 Jul 2025 - Trip Insights: Europe

28 Jul 2025 - New Funds on Fundmonitors.com
|
New Funds on FundMonitors.com |
|
Below are some of the funds we've recently added to our database. Follow the links to view each fund's profile, where you'll have access to their offer documents, monthly reports, historical returns, performance analytics, rankings, research, platform availability, and news & insights. |
|
|
||||||||||||||||||||||
| Savana US Small Caps Active ETF | ||||||||||||||||||||||
|
||||||||||||||||||||||
| View Profile | ||||||||||||||||||||||
|
|
||||||||||||||||||||||
| System Capital Long Short Fund - Class A | ||||||||||||||||||||||
|
||||||||||||||||||||||
| View Profile | ||||||||||||||||||||||
 |
||||||||||||||||||||||
| Harbourside All Weather Wholesale Investment | ||||||||||||||||||||||
|
||||||||||||||||||||||
| View Profile | ||||||||||||||||||||||
|
Harbourside Multi Strategy Wholesale Investment |
||||||||||||||||||||||
|
||||||||||||||||||||||
| View Profile | ||||||||||||||||||||||
 |
||||||||||||||||||||||
| Artisan Global Value Fund | ||||||||||||||||||||||
|
||||||||||||||||||||||
| View Profile | ||||||||||||||||||||||
|
Want to see more funds? |
||||||||||||||||||||||
|
Subscribe for full access to these funds and over 900 others |

25 Jul 2025 - Five things successful ETF investors do in volatile times
|
Five things successful ETF investors do in volatile times Janus Henderson Investors July 2025 Because Exchange Traded Funds (ETFs) are traded on stock exchanges and are available across several asset classes, they too are exposed to the same market movements as ordinary shares and managed funds. While volatility is a natural part of market cycles, nobody likes seeing their ETF or investment portfolio fall in value. Sharemarket turbulence can lead to investors making panicked or rash decisions, but those who are successful remain composed and use downturns to reassess their position and search for opportunities to strengthen their portfolio. Here are five key strategies successful ETF investors employ during volatile times: 1. Clear goals that shape investment strategyThe first step to any investment strategy starts with having a clear understanding of what you want to achieve and establishing a plan to reach it. Whether it is building a retirement nest egg, saving for children, looking to buy your first apartment or family home, or any other wealth accumulation purpose, successful investors have a plan. These goals are usually well defined, have step-by-step instructions and are recorded to give investors a reference point during volatile markets. For example, an instruction could be to create a stop-loss order on your ETF or other shares - this potentially limits your losses (or realises gains) by automatically selling when your asset reaches a pre-determined price. By having clear goals and sharp investment strategies, investors are less likely to make impulsive decisions based on short-term market fluctuations. Instead, they remain focused on their long-term plans, adjusting their portfolios only when necessary. 2. Diversification: The shield against uncertaintyInvesting in ETFs are a simple and potentially cost-effective way to spread your portfolio across different asset classes, specific sectors and geographic regions. Successful investors diversify their portfolio to mitigate the impact of a downturn in any single area. It is tough to predict which asset class will outperform as nobody can accurately predict the future, but good investors ensure they are well-diversified to protect against sudden market movements. 3. Dollar-cost averaging: Regular top-ups spread the loadDollar-cost averaging is common among successful investors because it aims to reduce the impact of market volatility. By investing a fixed amount regularly, you can average out the purchase price of your investment over time. Here is an example: Imagine you decide to invest about $100 in a particular ETF every month for six months. Here is how it might look:
After six months, you have invested $610 and purchased a total of 62 units. The average cost per unit is approximately $9.84, which is lower than the highest price you paid ($12) and higher than the lowest price ($8). 4. Long-term perspective: Patience pays offAnother key trait of successful ETF investors is to maintain a long-term perspective, especially during periods of volatility. These investors understand that markets over the shorter term can be unpredictable and trying to time the market can be near impossible. If you invested $10,000 in June 1994 and tracked the S&P/ASX All Ordinaries Total Return Index (the top 500 companies in the ASX), you would now have more than $135,0001. This is even though the market went through a dot.com bubble burst, the global financial crisis and most recently the COVID-19 pandemic. By staying invested and patient, investors benefit from the compounding returns. This perspective allows them to ride out market downturns with confidence, knowing that over time, the market has historically trended upwards. Their focus remains on the long-term growth of their portfolio rather than short-term gains or losses. 5. Bear markets as opportunities for future gainsWhile a bear market can test an investor's patience, those who have a successful mindset see it as an opportunity over a setback. These investors believe long-term markets will continue to rise, meaning after a period of volatility there is usually a strong recovery. By remaining invested during the downturn and even adding to their portfolios when in a bear market, these investors position themselves to benefit as asset prices recover. Moreover, bear markets provide opportunities to buy high-quality assets at lower prices, which can lead to significant gains when the market rebounds. Successful investors maintain their conviction during these periods, understanding that patience and a well-thought-out strategy will lead to strong returns. |
|
Funds operated by this manager: Janus Henderson Australian Fixed Interest Fund , Janus Henderson Conservative Fixed Interest Fund , Janus Henderson Diversified Credit Fund , Janus Henderson Global Natural Resources Fund , Janus Henderson Tactical Income Fund , Janus Henderson Australian Fixed Interest Fund - Institutional , Janus Henderson Conservative Fixed Interest Fund - Institutional , Janus Henderson Cash Fund - Institutional , Janus Henderson Global Multi-Strategy Fund , Janus Henderson Global Sustainable Equity Fund , Janus Henderson Sustainable Credit Fund All opinions and estimates in this information are subject to change without notice and are the views of the author at the time of publication. Janus Henderson is not under any obligation to update this information to the extent that it is or becomes out of date or incorrect. The information herein shall not in any way constitute advice or an invitation to invest. It is solely for information purposes and subject to change without notice. This information does not purport to be a comprehensive statement or description of any markets or securities referred to within. Any references to individual securities do not constitute a securities recommendation. Past performance is not indicative of future performance. The value of an investment and the income from it can fall as well as rise and you may not get back the amount originally invested. Whilst Janus Henderson believe that the information is correct at the date of publication, no warranty or representation is given to this effect and no responsibility can be accepted by Janus Henderson to any end users for any action taken on the basis of this information. |

24 Jul 2025 - AI vs the AI Expert: A conversation about the future of investing
|
AI vs the AI Expert: A conversation about the future of investing abrdn July 2025 What happens when you ask artificial intelligence (AI) to predict how it might change the job of fund management - and then invite a leading AI researcher to respond? That's the premise behind this article, which explores how AI could reshape the investment management process within the next five years. Portfolio construction gets a sidekickAI's take: AI will assist fund managers by rapidly generating optimised portfolios based on real-time data, investor preferences, and risk constraints -- not replacing the manager, but acting as a tireless quant assistant. Sentiment as a signalAI's take: Natural language processing will mine news, earnings calls, and social media to detect shifts in sentiment before they show up in prices. But beware: signal or noise? Forecasting gets a faceliftAI's take: AI models will enhance macroeconomic forecasting by identifying nonlinear patterns and hidden correlations -- though they may still struggle with black swan events and regime shifts. Human bias, meet machine biasAI's take: AI may reduce some behavioural biases -- but introduce new ones. Overfitting, data drift, and model opacity could create false confidence in flawed outputs. The rise of the 'explainable AI' arms raceAI's take: As AI becomes more embedded in decision-making, the pressure to explain its logic to clients, regulators, and boards will intensify. Transparency will be a competitive edge. |
|
Funds operated by this manager: abrdn Sustainable Asian Opportunities Fund , abrdn Emerging Markets Equity Fund , abrdn Sustainable International Equities Fund , abrdn Global Corporate Bond Fund (Class A) |

22 Jul 2025 - Investment Perspectives: Six themes impacting GREITs right now

Clint Maddock, Director at Digital Asset Funds Management and Simone Haslinger, CEO at East Coast Capital Management.
21 Jul 2025 - Insights into the Alternatives Sector
|
Insights into the Alternatives Sector FundMonitors.com July 2025 |
|
Chris Gosselin interviews Simone Haslinger from East Coast Capital Management and Clint Maddock from Digital Asset Funds Management to explore how their alternative investment strategies offer diversification from traditional markets. Simone outlines ECCM's systematic, trend-following quant approach across global futures markets, boasting low correlation with equities. Clint presents DAFM's market-neutral, high-frequency trading in digital assets, delivering strong returns even during equity drawdowns. The discussion covers AI adoption, the impact of Trump-era uncertainty, and challenges like investor education and crypto counterparty risk. Both managers highlight how their strategies enhance portfolio efficiency and thrive in volatile or dislocated markets.
|

16 Jul 2025 - Glenmore Asset Management - Market Commentary
|
Market Commentary - June Glenmore Asset Management July 2025 Globally equity markets rallied strongly in June. In the US, the S&P 500 increased +5.0%, the Nasdaq rose +6.6%, whilst in the UK, the FTSE fell -0.1%. Domestically, the All-Ordinaries Accumulation index underperformed its US peers, rising +1.4%. On the ASX, the top performing sector was energy, as the Middle East conflict pushed up energy prices. The worst performing sector was gold, as investors took profits following a 6-12 month period of strong outperformance. In global news, the conflict in the Middle East continued to create volatility in financial markets, with the Brent crude oil price rising +6% in June. In Australia, the key piece of news was a lower than expected inflation data point which has resulted in expectations of a 25 basis point reduction in the official cash rate (currently 3.85%) in July. In bond markets, the US 10-year bond yield fell -19 basis points (bp) to 4.25%, whilst its Australian counterpart declined -11bp to close at 4.16%. The Australian dollar was stronger in June, closing at US$0.658, up 1.5 cents. Funds operated by this manager: |