
NEWS

3 Jun 2026 - Future Supply Chains ETF: reflecting on one year
|
Future Supply Chains ETF: reflecting on one year abrdn May 2026 (Duration: 7 Mins) Our two thematic future exchange-traded funds (ETFs) - raw materials and supply chains - have just turned one. To mark the anniversary, we sat down with Blair Couper and Jamie Mills O'Brien, investment directors of our Future Supply Chains ETF. They reflected on what they've learned over the past year, how the strategy has evolved, and why they believe the case for resilient supply chains looks stronger than ever. Q1. The Future Supply Chains ETF launched just over a year ago. Take us back to that moment - what was the original thinking behind launching the strategy?Blair Couper: A lot of it came down to what we were seeing in the real world. We think the next 10 years are likely to be characterised by lower growth and stickier inflation than the last decade, driven by the inexorable forces of demographics, debt and deglobalisation. Against this backdrop, we wanted to position our investors behind growth trends that can thrive even in a weaker macro environment. The changing nature of supply chains - and the structural forces underpinning them - was one such area. Supply chains have gone from being something investors barely thought about to something that suddenly mattered every day - whether it was because of shortages, delays, or geopolitical tension. We felt that wasn't a short�'term disruption, but the start of a much bigger, longer�'lasting shift. The fund was really about giving investors a way to access that change in a considered, long�'term way, rather than reacting to the latest headline. Q2. "Supply chains" can mean a lot of different things. How do you define future supply chains when you're thinking about it as an investment opportunity?Jamie Mills O'Brien: That's exactly the opportunity - one that touches so many parts of global markets. For us, future supply chains aren't just about moving goods from A to B. They're about how countries, companies and industries are rethinking where things are made, how secure they are, and how sustainable they need to be. In that sense, it represents a broad reshaping of the global economy, spanning technology, energy, manufacturing, and infrastructure. A good example is defence and reindustrialisation (two themes we favour). After more than 20 years of underinvestment in its capital stock, the US is leaning far more heavily on its treaty allies in the Indo-Pacific, particularly Korea and Japan, to help bridge the gap with China across defence and automation. The unifying idea here is adaptation: states and companies responding to a world that's becoming more fragmented and certainly more challenging. Q3. Why did you decide an ETF - and an actively managed one at that - was the right structure for this idea?Jamie Mills O'Brien: An ETF gives investors transparency, flexibility and ease of access, which we think really suits a thematic allocation. But we were equally clear that this couldn't just be rules�'based or static. Supply chains are evolving all the time, so active management allows us to adjust exposures, lean into areas we believe are gaining momentum, and step back when conditions change. It's about keeping the strategy relevant - and an active approach allows us to do that. Q4. The strategy is built around three key drivers: national security, resilient supply chains, and decarbonisation. How did those pillars emerge?Blair Couper: They really came out of looking at what's driving decision�'making at government and corporate level. National security has become central to economic policy. Resilience is about reducing vulnerability and disruption. And decarbonisation is reshaping how energy and infrastructure are built. These forces overlap and reinforce one another. We saw them less as separate themes and more as different angles on the same structural shift. Q5. Automation, reshoring and localisation are big themes globally. How do you avoid simply chasing the loudest trends or headlines?Jamie Mills O'Brien: It comes back to discipline. At the heart of our thematic process is a focus on identifying those themes - and, within them, those companies - that can create value from the most powerful structural growth trends shaping the global economy. As a result, we spend a lot of time focusing on business quality and long�'term fundamentals. At the same time, we are wary of areas where narrative and hype are driving enthusiasm, rather than company fundamentals. A company benefiting from reshoring or rising defence spending still needs a robust balance sheet, strong competitive positioning and a business model that supports attractive economics. Being aligned with the theme gets a company onto the radar - but it doesn't automatically earn it a place in the portfolio. Q6. One year on, what have you learned since launch? Have any aspects of the strategy evolved as markets - and geopolitics - have shifted?Blair Couper: If anything, the past year has reinforced our original thinking. The scale of policy intervention, defence spending and industrial support has been striking. At the same time, we've learned the importance of flexibility - some developments move faster than expected, others take time. The framework hasn't changed, but our understanding of how and when value emerges has definitely deepened. Q7. Supply chains feel even more prominent in today's headlines than they did a year ago. Why do you think they've become more relevant, not less?Blair Couper: Recent events have shown that the underlying pressures haven't gone away - they've intensified. Geopolitical uncertainty, energy security concerns and trade tensions are now structural features of the global economy. We're seeing the last 50 years of globalisation give way to a world shaped by competing spheres of influence, fragmenting across China, the US and Europe. Governments are actively encouraging domestic production and demand, and companies are responding. In this world supply chains remain front and centre - not just as an operational issue, but as a strategic one. Q8. For investors thinking about portfolio construction, how does a supply�'chain strategy sit alongside traditional global equity exposure?Jamie Mills O'Brien: We see it as a complement rather than a replacement. Traditional indices reflect where the world has been; thematic strategies are about where it's going. Supply chains touch many sectors and regions, but they're driven by different forces than broad market cycles. That can make them a useful diversifier for investors who are looking to build resilience into their portfolios. Q9. What type of companies tend to stand out when supply chains are being redesigned rather than simply maintained?Jamie Mills O'Brien: Often, it's companies enabling change rather than resisting it. That might be firms providing automation, infrastructure, energy solutions or specialist components. What they tend to share is an ability to adapt - they're helping others become more efficient, more secure or more sustainable, rather than clinging to older models. Q10. Finally, if you had to sum up what the Future Supply Chains ETF is really about, how would you describe it?Blair Couper: At its heart, it's about investing in how the global economy is being rebuilt. Supply chains are no longer just about cost efficiency - they're about security, resilience and long�'term sustainability. This strategy is designed to capture that transformation as it unfolds.
Fund-specific risks The fund invests in equity and equity related securities. These are sensitive to variations in the stock markets which can be volatile and change substantially in short periods of time. A concentrated portfolio may be more volatile and less liquid than a more broadly diversified one. The fund's investments are concentrated in a particular country or sector, or closely related group of industries or sectors. The fund invests in emerging market equities and / or bonds. Investing in emerging markets involves a greater risk of loss than investing in more developed markets due to, among other factors, greater political, tax, economic, foreign exchange, liquidity and regulatory risks. The shares of small and mid-cap companies may be less liquid and more volatile than those of larger companies. The fund may invest in companies with Variable Interest Entity (VIE) structures in order to gain exposure to industries with foreign ownership restrictions. There is a risk that investments in these structures may be adversely affected by changes in the legal and regulatory framework. Investing in China A shares involves special considerations and risks, including greater price volatility, a less developed regulatory and legal framework, exchange rate risk/controls, settlement, tax, quota, liquidity and regulatory risks. The use of derivatives carries the risk of reduced liquidity, substantial loss and increased volatility in adverse market conditions, such as a failure amongst market participants. The use of derivatives may result in the fund being leveraged (where market exposure and thus the potential for loss by the fund exceeds the amount it has invested) and in these market conditions the effect of leverage will be to magnify losses. |
|
Funds operated by this manager: abrdn Sustainable Asian Opportunities Fund , abrdn Emerging Markets Equity Fund , abrdn Sustainable International Equities Fund , abrdn Global Corporate Bond Fund (Class A) |

1 Jun 2026 - Manager Insights | Digital Asset Funds Management
|
Chris Gosselin, CEO of FundMonitors.com, speaks with Clint Maddock, Director and Co-Founder at Digital Asset Funds Management. Clint discussed how the fund has remained profitable despite Bitcoin's recent decline, highlighting its market-neutral arbitrage strategy across multiple digital asset exchanges. He also shares his outlook on crypto market catalysts, including regulatory developments in the US, and the fund's growth following its distribution partnership with Montgomery Funds Management.
|

28 May 2026 - Good intentions. Unintended outcomes?

26 May 2026 - AI needs more than chips: Why power and grid buildout matter

25 May 2026 - 10k Words | May 2026
|
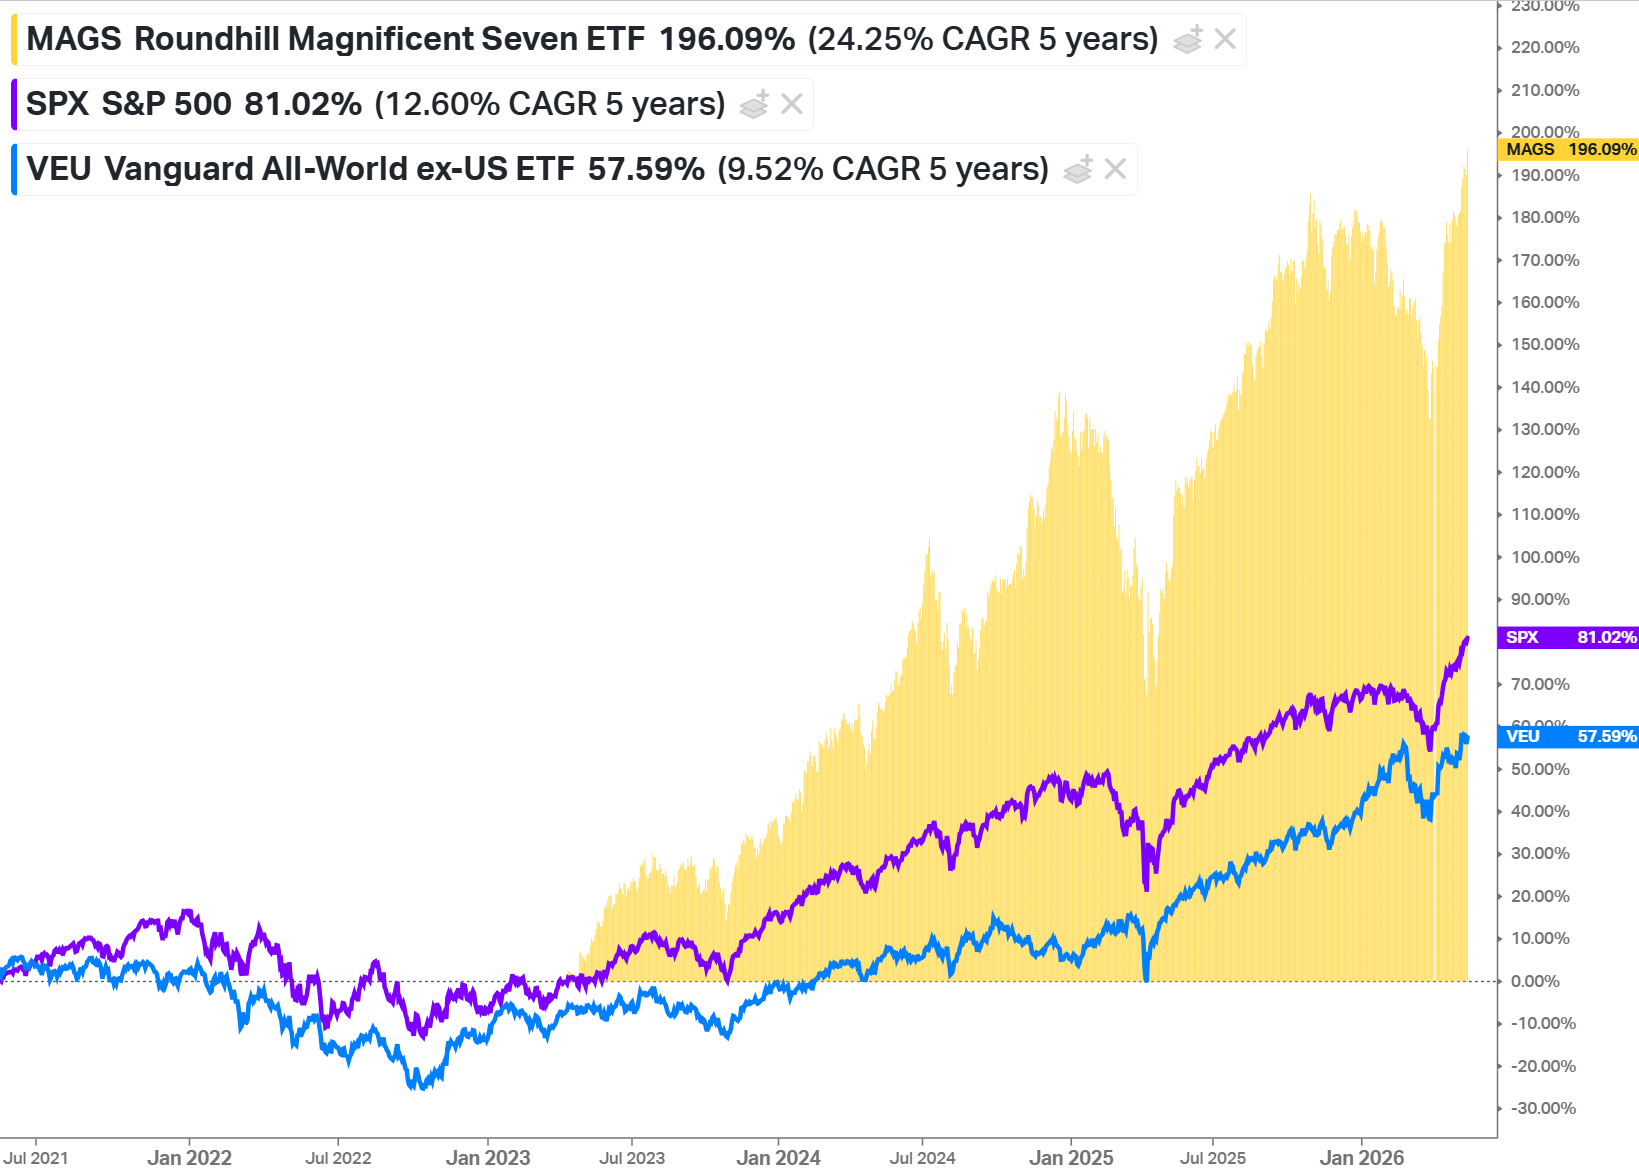
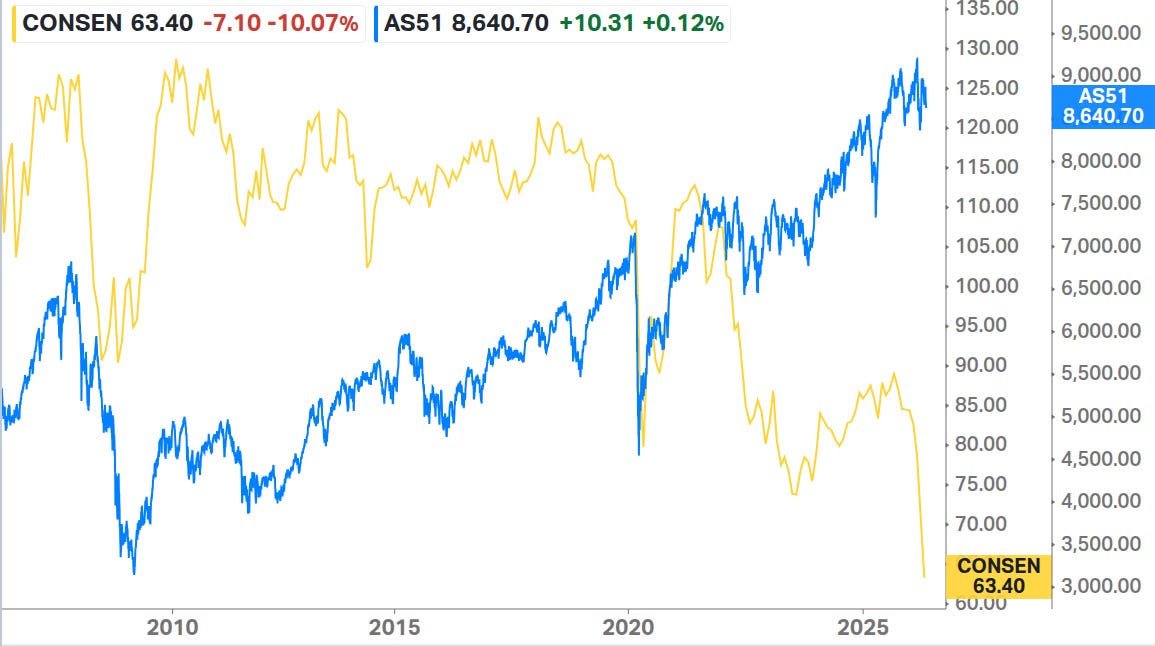
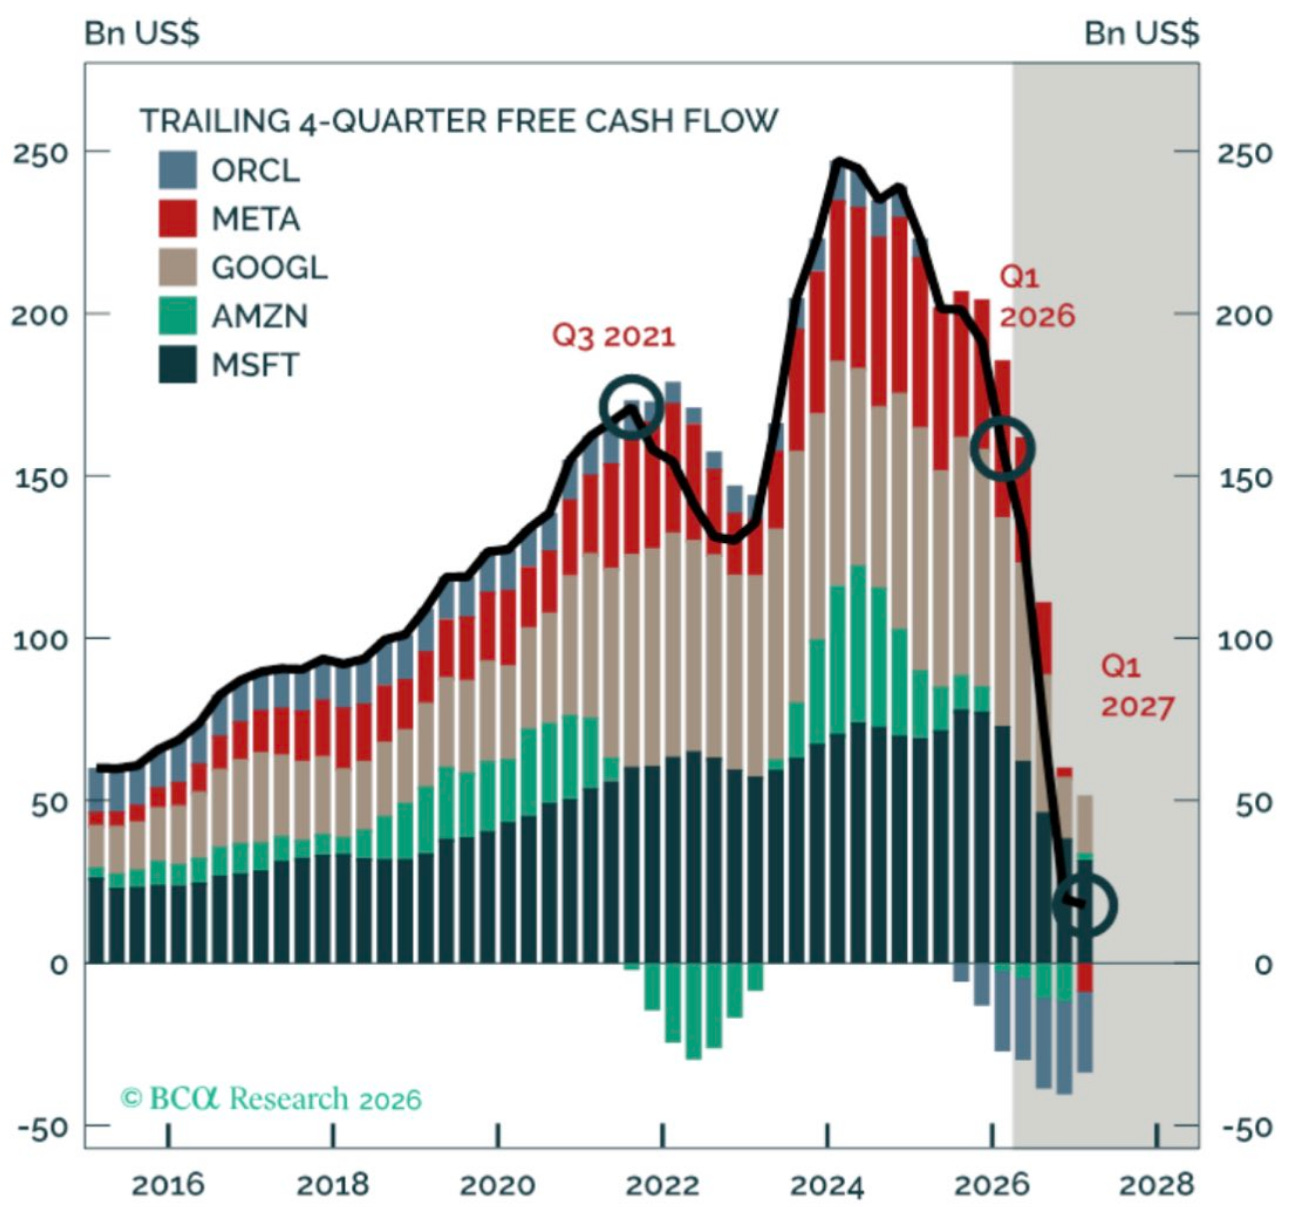
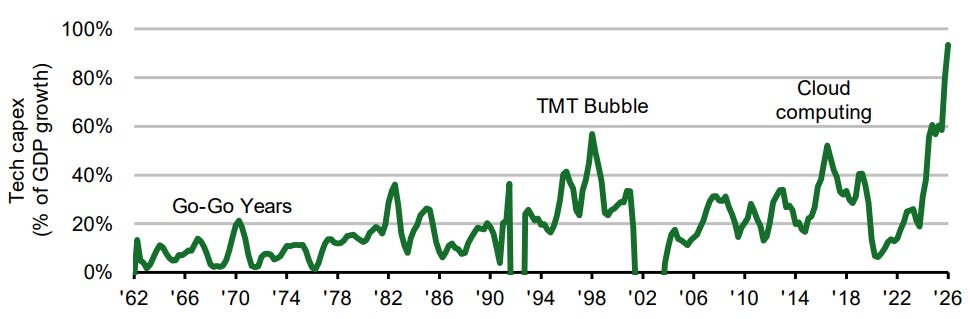
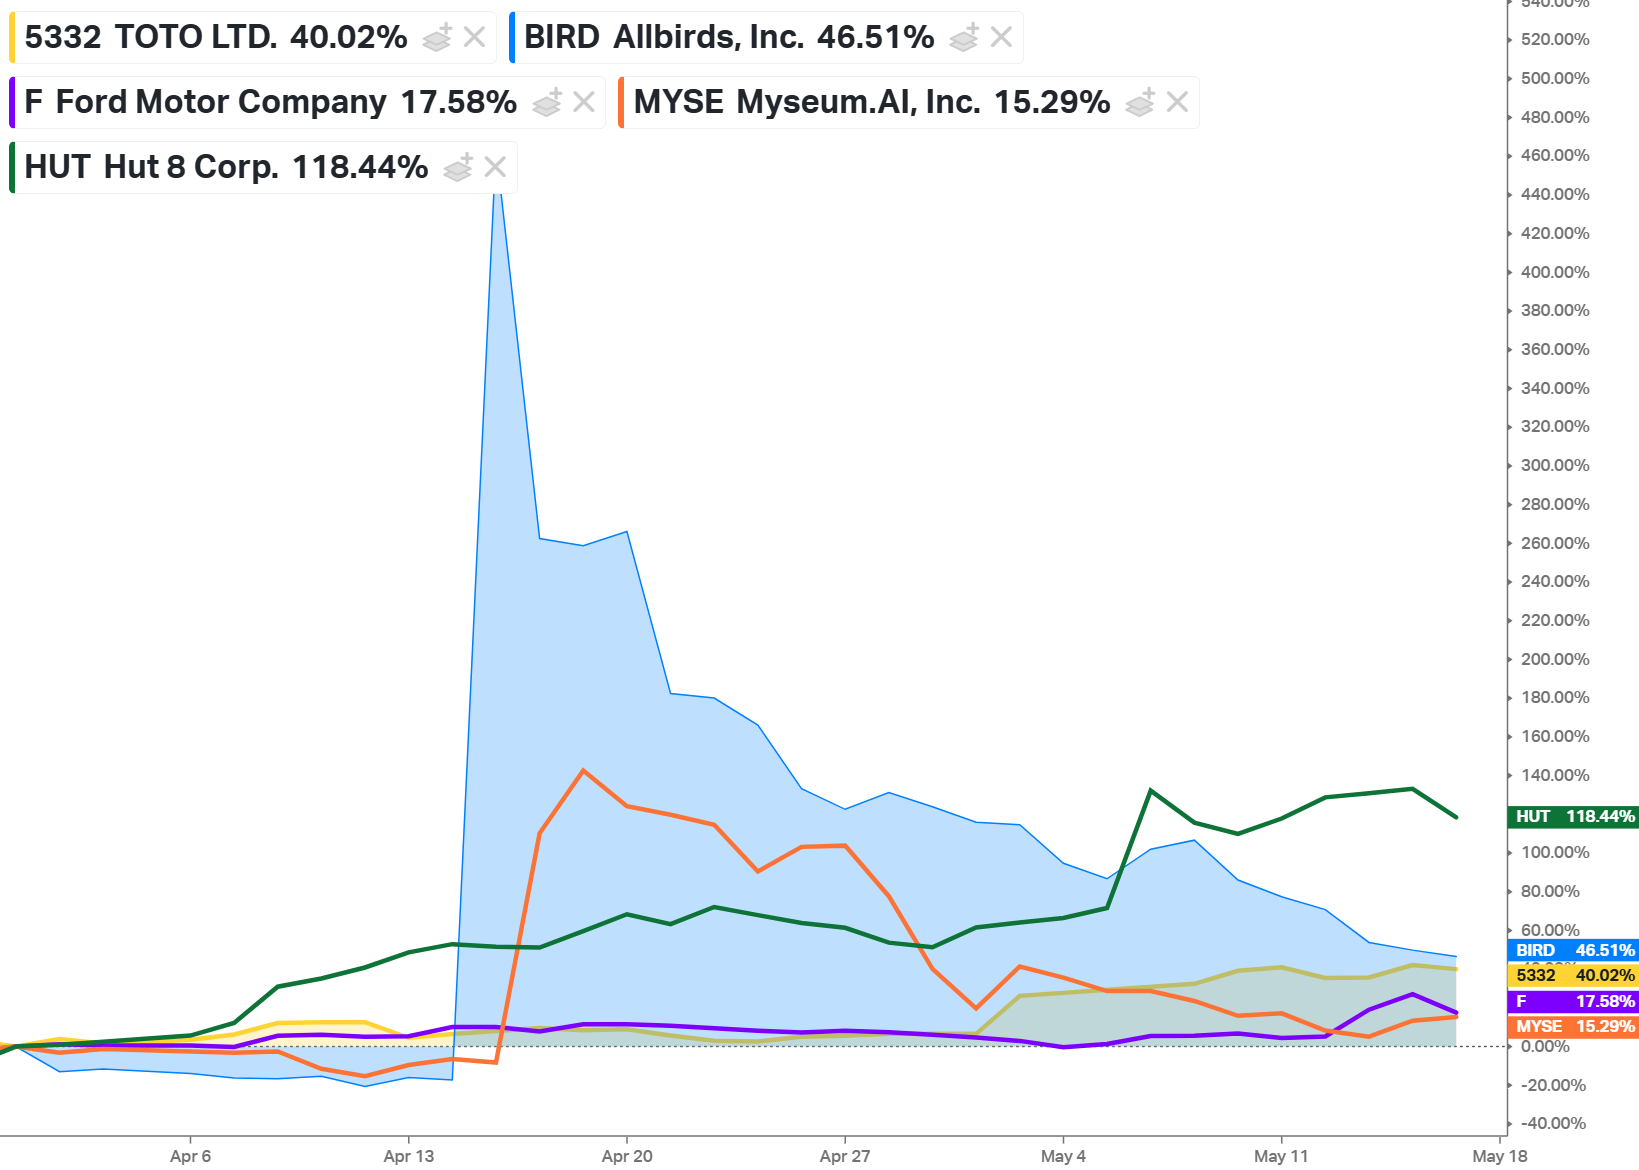
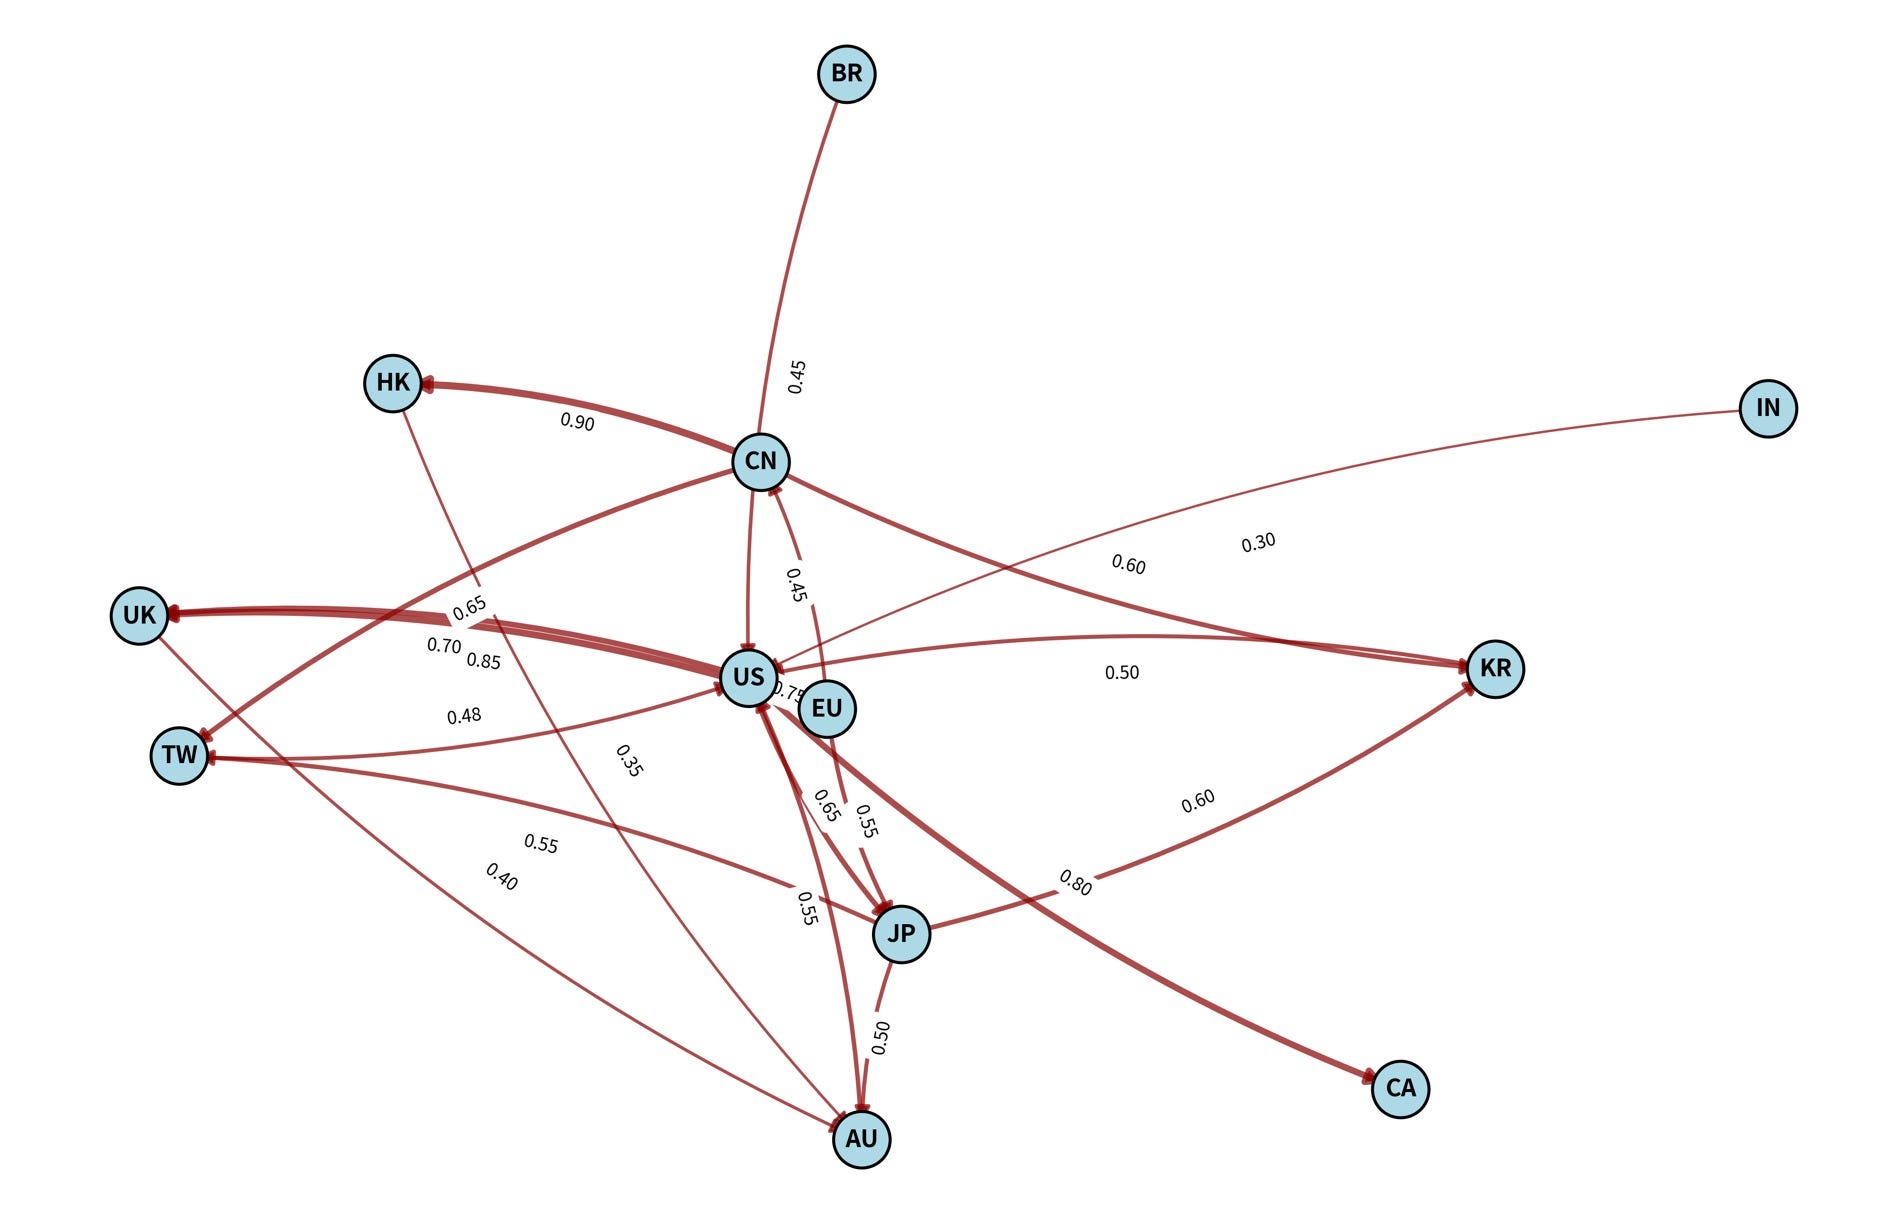
10k Words Equitable Investors May 2026 (2-minute read) The "Magnficient 7" continue to lead the charge with investors exhibiting a strong appetite for risk. But global oil inventories are tracking low and so is consumer sentiment in Australia and the US. And so is the free cash flow of those large tech companies as tech capex approaches 100% of US GDP. The game of pivoting to the hot space has fired up with a shoe maker and a range of others associating themselves with "AI" and receiving a share price bump. We map the interconnectedness of global equity markets - and look at the long-term shift away from asset bases in Australian valuations. Finally, CEOs are getting older! Magnificent 7 v the world
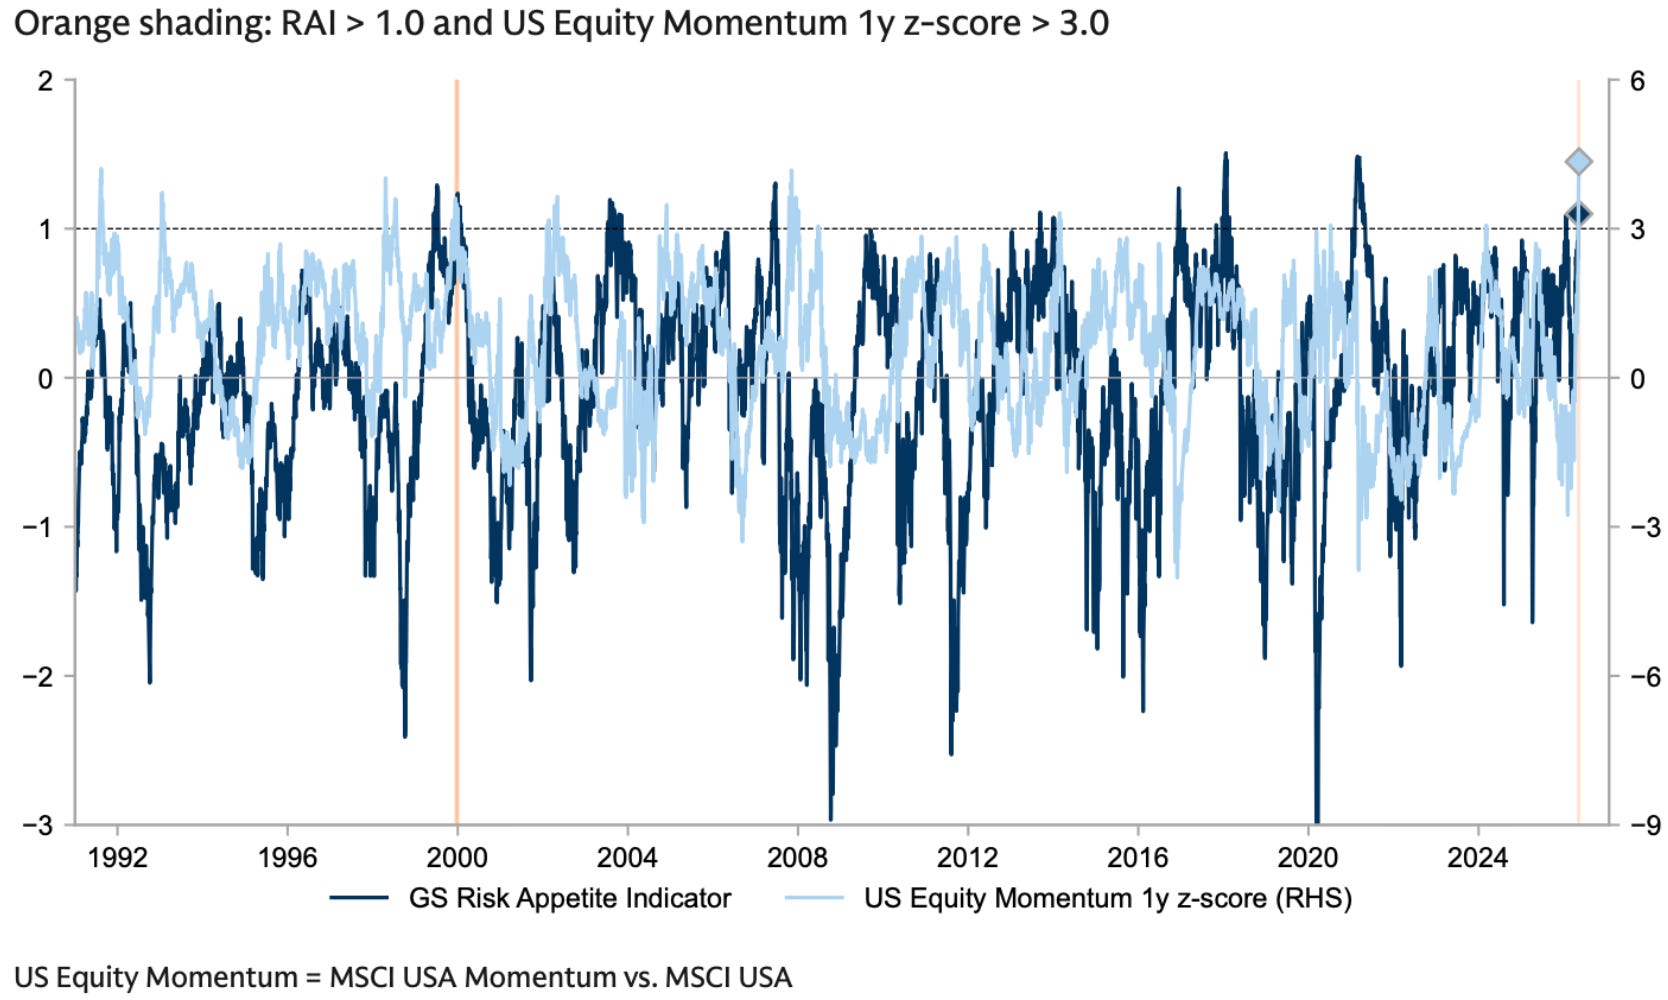
Source: Koyfin US risk appetite and equity momentum - hitting levels last seen in 2020
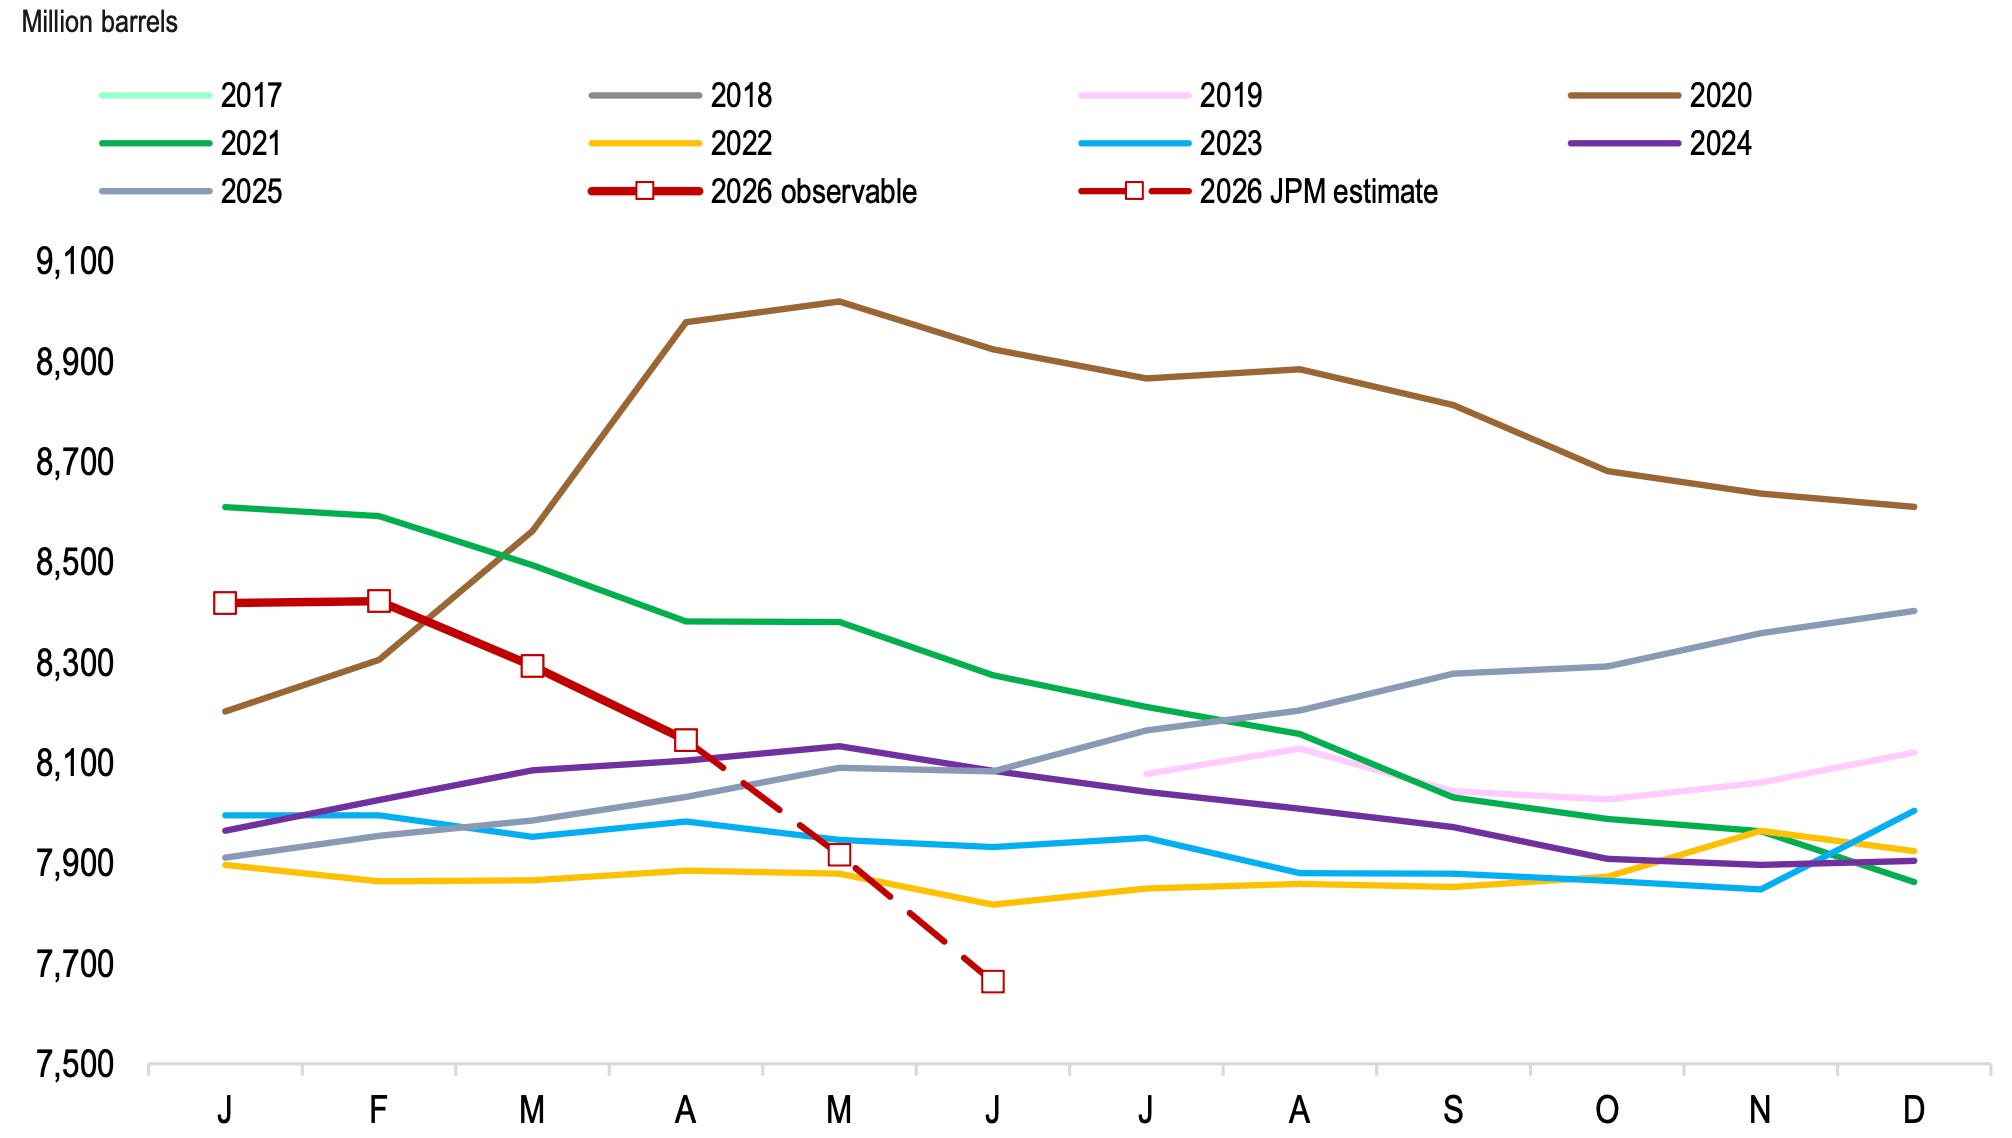
Source: Goldman Sachs Investment Research Global oil inventories
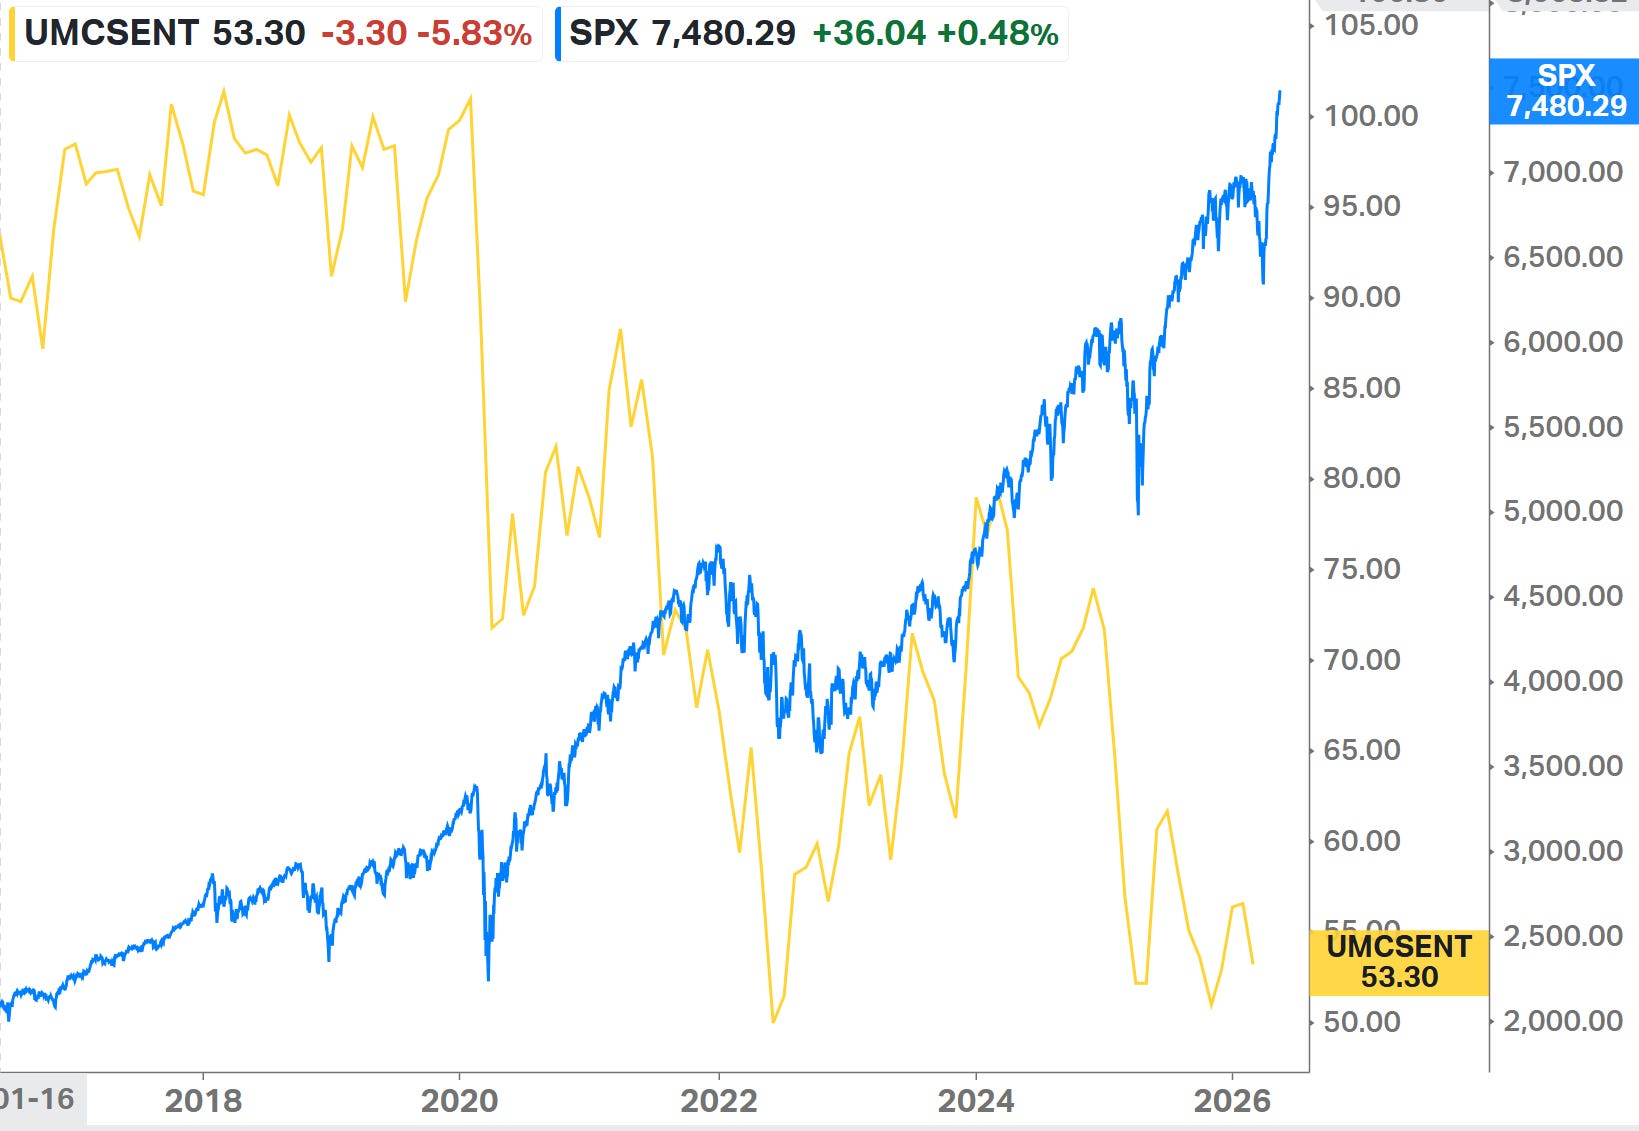
Source: JP Morgan Commodities Research US consumer sentiment v. equities
Source: Koyfin Australian consumer sentiment v equities
Source: Iress, Koyfin "Mega Tech" free cash flow diminished - "capital light" model gone
Source: BCA Research Tech capex approaching 100% of US GDP
Source: Panmure Liberum AI pivot or pump?
Source: Equitable Investors, Koyfin Global equity interconnectedness network (simulted via piecewise Network VAR Spillover Coefficients)
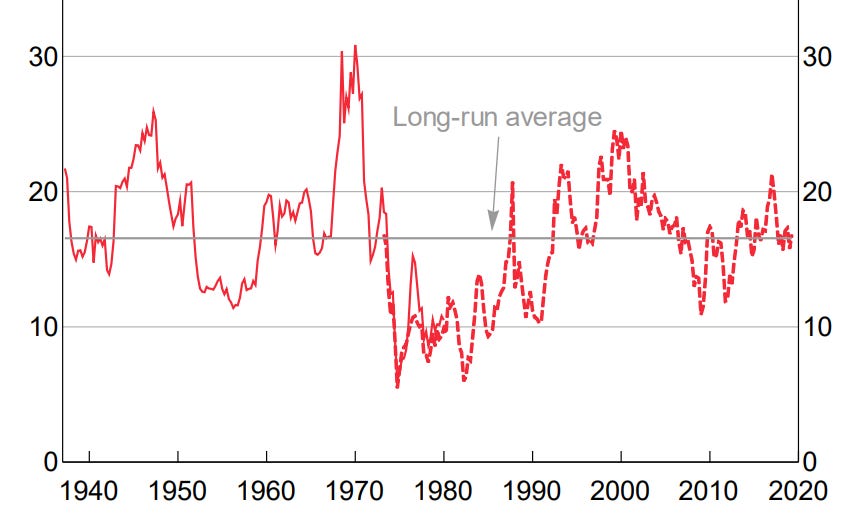
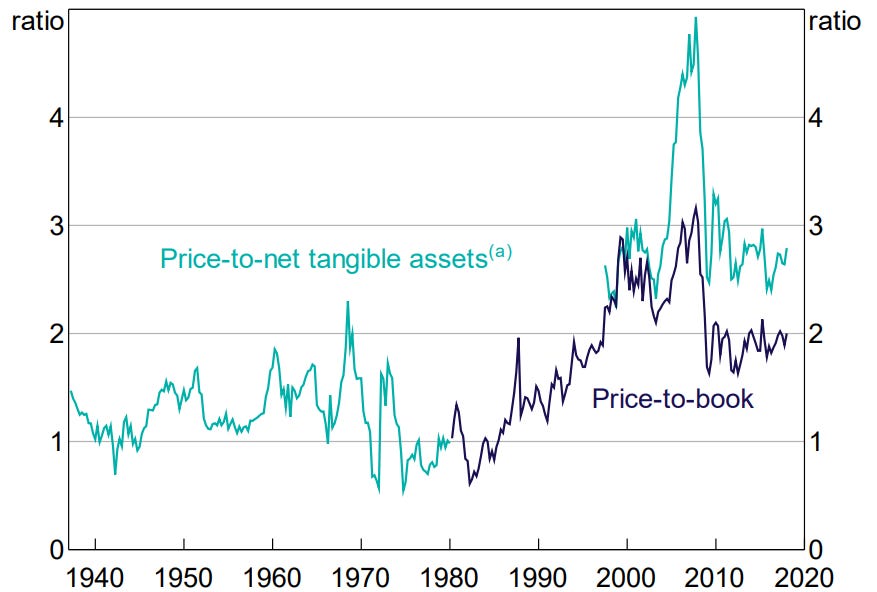
Source: Grok, Equitable Investors Australian equity market's long-term trailing valuation multiples
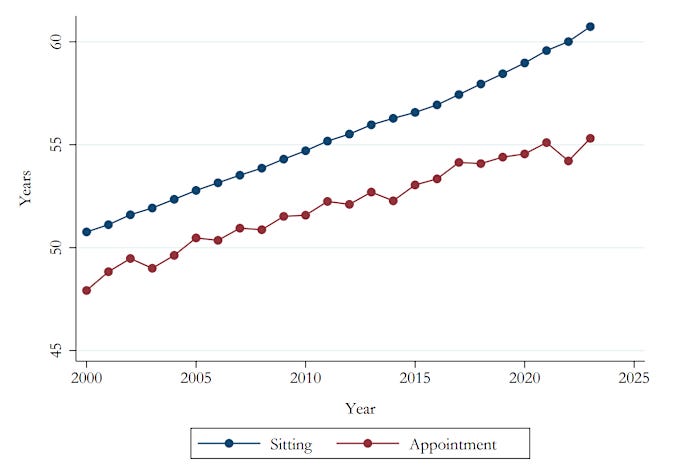
Source: RBA Average age of CEOs over time (US data)
Source: FT Alphaville, "Aging at the Very Top" Funds operated by this manager: Equitable Investors Dragonfly Fund Disclaimer Past performance is not a reliable indicator of future performance. Fund returns are quoted net of all fees, expenses and accrued performance fees. Delivery of this report to a recipient should not be relied on as a representation that there has been no change since the preparation date in the affairs or financial condition of the Fund or the Trustee; or that the information contained in this report remains accurate or complete at any time after the preparation date. Equitable Investors Pty Ltd (EI) does not guarantee or make any representation or warranty as to the accuracy or completeness of the information in this report. To the extent permitted by law, EI disclaims all liability that may otherwise arise due to any information in this report being inaccurate or information being omitted. This report does not take into account the particular investment objectives, financial situation and needs of potential investors. Before making a decision to invest in the Fund the recipient should obtain professional advice. This report does not purport to contain all the information that the recipient may require to evaluate a possible investment in the Fund. The recipient should conduct their own independent analysis of the Fund and refer to the current Information Memorandum, which is available from EI. |

21 May 2026 - Global Perspectives: Addressing the most essential questions around AI
|
Global Perspectives: Addressing the most essential questions around AI Janus Henderson Investors May 2026 (Duration: 29 minutes) In this episode, Portfolio Manager Denny Fish takes a deep dive into the current state of artificial intelligence (AI), including the latest advancements, its potential to propel economic growth, and the rise of agentic AI and its impact on software business models. He also shares insights from a recent research trip in China. |
|
Funds operated by this manager: Janus Henderson Australian Fixed Interest Fund , Janus Henderson Conservative Fixed Interest Fund , Janus Henderson Diversified Credit Fund , Janus Henderson Global Natural Resources Fund , Janus Henderson Tactical Income Fund , Janus Henderson Australian Fixed Interest Fund - Institutional , Janus Henderson Conservative Fixed Interest Fund - Institutional , Janus Henderson Cash Fund - Institutional , Janus Henderson Global Multi-Strategy Fund , Janus Henderson Global Sustainable Equity Fund , Janus Henderson Sustainable Credit Fund All opinions and estimates in this information are subject to change without notice and are the views of the author at the time of publication. Janus Henderson is not under any obligation to update this information to the extent that it is or becomes out of date or incorrect. The information herein shall not in any way constitute advice or an invitation to invest. It is solely for information purposes and subject to change without notice. This information does not purport to be a comprehensive statement or description of any markets or securities referred to within. Any references to individual securities do not constitute a securities recommendation. Past performance is not indicative of future performance. The value of an investment and the income from it can fall as well as rise and you may not get back the amount originally invested. Whilst Janus Henderson believe that the information is correct at the date of publication, no warranty or representation is given to this effect and no responsibility can be accepted by Janus Henderson to any end users for any action taken on the basis of this information. |
20 May 2026 - Who's winning the AI race - and does it matter?
|
Who's winning the AI race - and does it matter? abrdn May 2026 (Duration: 27 Mins) In this episode, we explore how artificial intelligence (AI) is reshaping global competition. We compare the US and China's approaches to AI, looking beyond the headlines to examine models, infrastructure, power, government strategy and the real world application of AI across economies. Nick speaks to Bob, and they discuss whether AI really represents a race between the US and China, how different policy and market structures are shaping outcomes, and why the implications for growth and productivity may matter more than who is technically "ahead" at any given moment. |
|
Funds operated by this manager: abrdn Sustainable Asian Opportunities Fund , abrdn Emerging Markets Equity Fund , abrdn Sustainable International Equities Fund , abrdn Global Corporate Bond Fund (Class A) |

reaching new highs during April. (2-minute read)
19 May 2026 - Glenmore Asset Management - Market Commentary
|
Market Commentary - April Glenmore Asset Management May 2026 (2-minute read) The US market appeared to shrug off the ongoing war in Iran, reaching new highs during April. This was primarily driven by the tech sector, resulting in the NASDAQ rising +15.3%, representing its strongest monthly gain since April 2020. Whilst not being as tech-heavy, the S&P 500 was boosted by similar factors, rising +10.4%. US markets easily outpaced their international peers, with the Euro Stoxx 50 and FTSE 100 rising +5.6% and +2.0% during the month, respectively. Similarly, domestic markets lagged the US, with the ASX All Ordinaries Accumulation Index rising +2.4%. The gains were led by the Tech (+12.3%) and Real Estate (+8.0%) sectors, whilst Healthcare was the key detractor (-8.4%), dragged down by Cochlear (COH), which fell -44% following an earnings downgrade. In bond markets, the US 10-year bond yield rose +5 basis points (bp) to 4.37%, whilst its Australian counterpart rose +9bp to 5.1%. The Australian dollar rebounded during the month, rising +4.3% to US$0.72, implying an increase of 3.0 cents. Funds operated by this manager: |

18 May 2026 - China's Luxury Reset: What we're seeing on the ground and why it matters

Datt Capital.
15 May 2026 - Manager Insights | Datt Capital
|
Chris Gosselin, CEO of FundMonitors.com, speaks with Emanuel Datt, founder and Chief Investment Officer at Datt Capital. Emanuel discussed recent market volatility, the divergence between large and small caps, and the opportunities emerging in the small companies space. He also discussed Datt Capital's approach to sector analysis, including technology, AI adoption, and energy, as well as the Fund's cash position and ability to act on market dislocations. Disclaimer: This conversation with FundMonitors was recorded prior to the release of the federal budget. |
|
|
Funds operated by this manager: Datt Capital Absolute Return Fund , Datt Capital Small Companies Fund |
|
|
|