
NEWS

2 Mar 2023 - Enabling net zero - infrastructure's role in the energy transition
|
Enabling net zero - infrastructure's role in the energy transition abrdn February 2023
Infrastructure is an enabler Infrastructure provides heat, power, mobility, clean water, waste treatment and digital connectivity - all services that underpin a functioning society. It also has the potential to enable change: to improve livelihoods, reduce inequality, improve productivity and support environmental outcomes. When there's a societal imperative, infrastructure can provide the foundation for it to be achieved. This is particularly true of our response to climate change. Economies must fully decarbonise globally by 2050 to give a reasonable chance of keeping the temperature rise below 1.5 degrees by the end of the century. This goal is a firm policy objective in many countries, including the UK and the EU. The role of infrastructure in the transition Using the UK as an example, infrastructure accounts for around 54%1 of total annual emissions. The emissions that come from the construction and operation of infrastructure assets (capital and operational carbon, respectively) represent around 13% of the total. But by far the largest component, making up the remaining 41%, are emissions arising from using infrastructure - referred to as user carbon. The carbon footprint of each business and citizen in the economy is highly dependent on the emissions intensity of the infrastructure they use - that is, the energy and physical resources they use, the data they consume, and the transport options available to them. Significant improvements have been made to the emissions intensity of some sectors since 2010. The energy and waste sectors, in particular, have been subject to ambitious policy packages over this period. But progress isn't fast enough and other sectors like transport lag behind. The choices and behaviours of individuals can help, but without accelerated decarbonisation of the infrastructure services on which we all rely, the 2050 target will be hard to meet. Without accelerated decarbonisation of the infrastructure services on which we all rely, the 2050 target will be hard to meet Mobilising investment in the transition This is a theme that came out strongly in the recent independent review of the UK's net-zero policies2 and one that is central to the EU's Green Deal package3. An estimated £40 billion of annual investment in infrastructure is required over the next decade if the UK is to meet its net-zero commitment4. Across the EU, this figure is approximately €737 billion per year to 20305. These are substantial numbers that require unprecedented collaboration between policymakers and investors. Infrastructure assets are characterised by long construction lead times and decades-long operational lifetimes. If such investment is to be mobilised quickly and successfully, investors need a policy mix that provides sufficient confidence in long-term revenues and returns. This capital is required to develop new low-carbon infrastructure, but also to invest in decarbonising and repurposing existing assets that can play a role in the transition. Many traditional infrastructure assets are inconsistent with the net-zero transition and lack a viable plan. In other words, high user carbon is locked in. For these assets, the clock is ticking on their functional life in the face of increasing carbon pricing, regulation and shifting customer sentiment. Conversely, assets that are aligned with the transition and support reductions in user carbon will attract stronger policy support. This means they will not face the same functional obsolescence over time. As a result, they are likely to support stronger returns for investors over the long term. Our role in the transition We focus on small- and mid-market assets where we are either the majority shareholder or the significant minority partner, and we always have board representation. Small- and mid-market assets represent the majority of infrastructure assets - many utilities, energy generation, and fibre assets fall into this category. We take a long-term view that allows us to assess each asset's role in the low-carbon transition. And we position these assets to benefit from opportunities to create value. Our level of influence and proactive approach to asset management mean we can drive real change in this respect. For example, alongside our investments in operational renewables in Poland and Norway, our Finnish utility Auris Energy has a strategy to phase out the supply of fossil-gas entirely by 2040. Additionally, our North Sea gas asset Noordgastransport has recently gained technical approval to transport hydrogen produced from offshore wind where the laying of electrical cables is not economical. In both cases, assets are being repositioned to support the low-carbon transition and to drive much-needed reductions in user carbon for their customers and the wider economy. The vital role that infrastructure must play in enabling the low-carbon transition is clear. We believe our approach to proactive, long-term, direct infrastructure investment presents a unique opportunity to support the net-zero journey. Author: Ruairi Revell, Head of Sustainability - Infrastructure |
|
Funds operated by this manager: Aberdeen Standard Actively Hedged International Equities Fund, Aberdeen Standard Asian Opportunities Fund, Aberdeen Standard Australian Small Companies Fund, Aberdeen Standard Emerging Opportunities Fund, Aberdeen Standard Ex-20 Australian Equities Fund (Class A), Aberdeen Standard Focused Sustainable Australian Equity Fund, Aberdeen Standard Fully Hedged International Equities Fund, Aberdeen Standard Global Absolute Return Strategies Fund, Aberdeen Standard Global Corporate Bond Fund, Aberdeen Standard International Equity Fund, Aberdeen Standard Multi Asset Real Return Fund, Aberdeen Standard Multi-Asset Income Fund Companies are selected for illustrative purposes only to demonstrate the investment management style described herein and not as an investment recommendation or indication of future performance. Past performance is not a guide to future results. 1.The Carbon Project: the scale of the net zero 2050 challenge | Institution of Civil Engineers (ICE) |

1 Mar 2023 - Performance Report: PURE Income & Growth Fund
[Current Manager Report if available]

1 Mar 2023 - The global inflation bogeyman slips away...
|
The global inflation bogeyman slips away... Insync Fund Managers February 2023 In this White Paper, Insync said five common assertions had been stirring the pessimism pot, one of which was that the resumption of rising interest rates, and therefore inflation, is firmly established. Insync Portfolio Manager John Lobb said, "We disagreed with those pessimistic assertions then, and in the face of further evidence, we still disagree." In August 2022, Insync said the incredible rate of money creation during 2020-2021 of 20% to 30% pa, had dramatically slowed to the average of the historic range of 5-6%. Excess money had been chasing an interrupted supply of goods and services up until last year, pushing up prices artificially. "Today, the Money Supply (M2) rate of change is negative (-1.3%). This has not happened for at least 80 years," Mr. Lobb said. "This development would be of concern to the Federal Open Market Committee (FOMC), since productive investment relies heavily on the availability of credit." In 2022, Insync had also pointed out that inflation of the price of goods leaving the gates of Chinese factories, which had been running at 13-14%, had dropped back to 4%. "The factory gate prices of Chinese manufacturing plants have now declined at -1.3% over the last year," Mr. Lobb said. Additionally, he said that a decline in the net number of small to medium (SME) businesses looking to implement price hikes, also identified by Insync in August 2022, had continued to such an extent that SME pricing intentions in the next three months now match those prior to the pandemic. Looking to carbon energy supplies, which was also touted as an ongoing inflationary pressure, the reverse has been true. "It fell even further than we predicted," Mr. Lobb said. "In more normal times, central banks largely ignore the ebb and flow of global energy and food prices. However, in today's conditions where the labour force has contracted, rises in food and energy prices may strengthen the case for higher rates since pay demands could create a more sustained impulse to inflation." Mr. Lobb said that fortunately, Natural Gas (MMBtu) has dropped 65% in less than six months, back to the same level as that during the previous four northern hemisphere winters. "Besides being used for heating, it's a core determinant of fertiliser and thus food prices. Crude oil and therefore gasoline prices, have declined in excess of 20% to $78/barrel in the last six months. This is even below its price prior to the Russian invasion of Ukraine," he said. "So, whilst the FOMC is usually more interested in CPI ex food and energy, they would appreciate how reductions in the prices of these non-discretionary goods has a positive indirect effect on wage demands in what is a tight labour market." Insync had asserted that inflation over the past few decades had been abnormally low, and they had expected it to settle around its longer-term norm, which is not bad for equity markets. "This is exactly what it is heading towards. Five-year inflationary expectations are now congruent with the 5-10 year inflationary expectations (2.3%) which will calm the nerves of the FOMC," Mr. Lobb said. "It has always been our view that long-term inflation expectations will not revert to those of the recent abnormal past of around 2% due to a less (internationally) mobile labour force and a higher degree of onshoring. Nevertheless, the FOMC's expectations will also be tempered by their assessment of the new global regime, mainly attributable to the re-evaluation of geopolitical risk by large corporates." Insync had also noted that looking at the core drivers of inflation it was hard to see price rises continuing as had been the case in the previous year and, if the prices of the core drivers of inflation stabilise, inflation would drop dramatically in this coming year. "Even total weekly wages, a significant driver of 'stickier' service inflation, are now only growing at 3.5-3.75%, similar to the rate of growth that existed in 2019," Mr. Lobb said. "As employees and managers become more accustomed to the increased prevalence of the hybrid work schedule, productivity should recover from the currently negative -1.7%, leading to an even greater improvement in unit labour costs (ULC). The Federal Reserve is keenly aware that ULC is the real culprit of endemic inflation." While Insync believes the global economy is unlikely to regain its 'fluidity', it also believes the central banks will feel more comfortable promoting a more neutral policy stance based on the above developments. "Perhaps for those investors that hold a pessimistic view, it may be time to question this, to deploy assets towards those equites that are primed to deliver above average earnings growth in a mediocre at best, GDP environment," Mr. Lobb said. Funds operated by this manager: Insync Global Capital Aware Fund, Insync Global Quality Equity Fund Disclaimer |

28 Feb 2023 - Performance Report: Airlie Australian Share Fund
[Current Manager Report if available]
28 Feb 2023 - Airlie Quarterly Update
|
Airlie Quarterly Update Airlie Funds Management January 2023 |
|
Emma Fisher, Portfolio Manager, reflects on the volatility of the past year and discusses Airlie's investment thesis behind a building products company which has been a recent addition to the portfolio. Speaker: Emma Fisher, Portfolio Manager Funds operated by this manager: Important Information: Units in the fund(s) referred to herein are issued by Magellan Asset Management Limited (ABN 31 120 593 946, AFS Licence No. 304 301) trading as Airlie Funds Management ('Airlie') and has been prepared for general information purposes only and must not be construed as investment advice or as an investment recommendation. This material does not take into account your investment objectives, financial situation or particular needs. This material does not constitute an offer or inducement to engage in an investment activity nor does it form part of any offer documentation, offer or invitation to purchase, sell or subscribe for interests in any type of investment product or service. You should obtain and consider the relevant Product Disclosure Statement ('PDS') and Target Market Determination ('TMD') and consider obtaining professional investment advice tailored to your specific circumstances before making a decision to acquire, or continue to hold, the relevant financial product. A copy of the relevant PDS and TMD relating to an Airlie financial product or service may be obtained by calling +61 2 9235 4760 or by visiting www.airliefundsmanagement.com.au. Past performance is not necessarily indicative of future results and no person guarantees the future performance of any financial product or service, the amount or timing of any return from it, that asset allocations will be met, that it will be able to implement its investment strategy or that its investment objectives will be achieved. This material may contain 'forward-looking statements'. Actual events or results or the actual performance of an Airlie financial product or service may differ materially from those reflected or contemplated in such forward-looking statements. This material may include data, research and other information from third party sources. Airlie makes no guarantee that such information is accurate, complete or timely and does not provide any warranties regarding results obtained from its use. This information is subject to change at any time and no person has any responsibility to update any of the information provided in this material. Statements contained in this material that are not historical facts are based on current expectations, estimates, projections, opinions and beliefs of Airlie. Such statements involve known and unknown risks, uncertainties and other factors, and undue reliance should not be placed thereon. Any third party trademarks contained herein are the property of their respective owners and Airlie claims no ownership in, nor any affiliation with, such trademarks. Any third party trademarks that appear in this material are used for information purposes and only to identify the company names or brands of their respective owners. No affiliation, sponsorship or endorsement should be inferred from the use of these trademarks.. This material and the information contained within it may not be reproduced, or disclosed, in whole or in part, without the prior written consent of Airlie. |

27 Feb 2023 - 10k Words
|
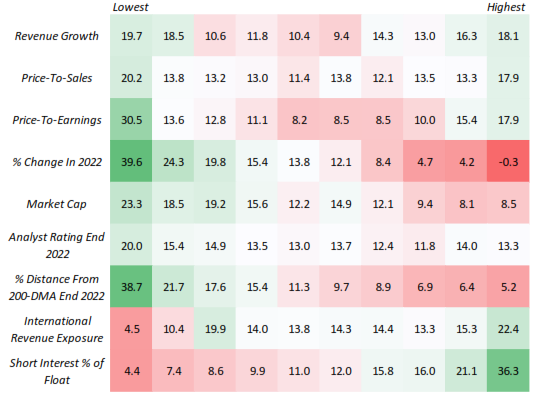
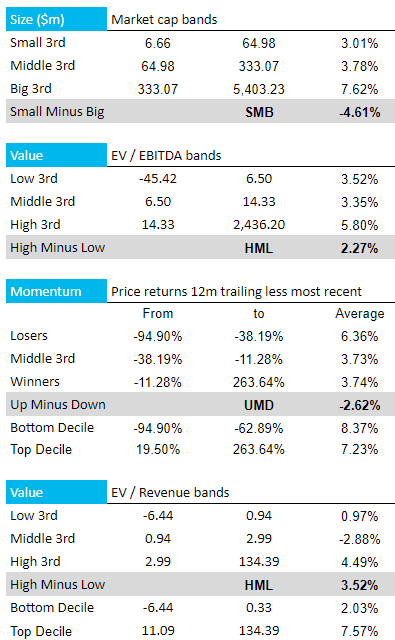
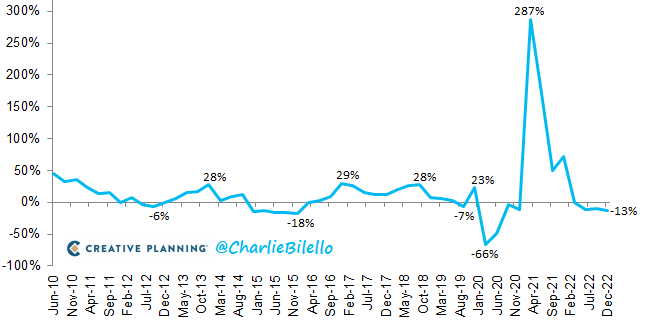
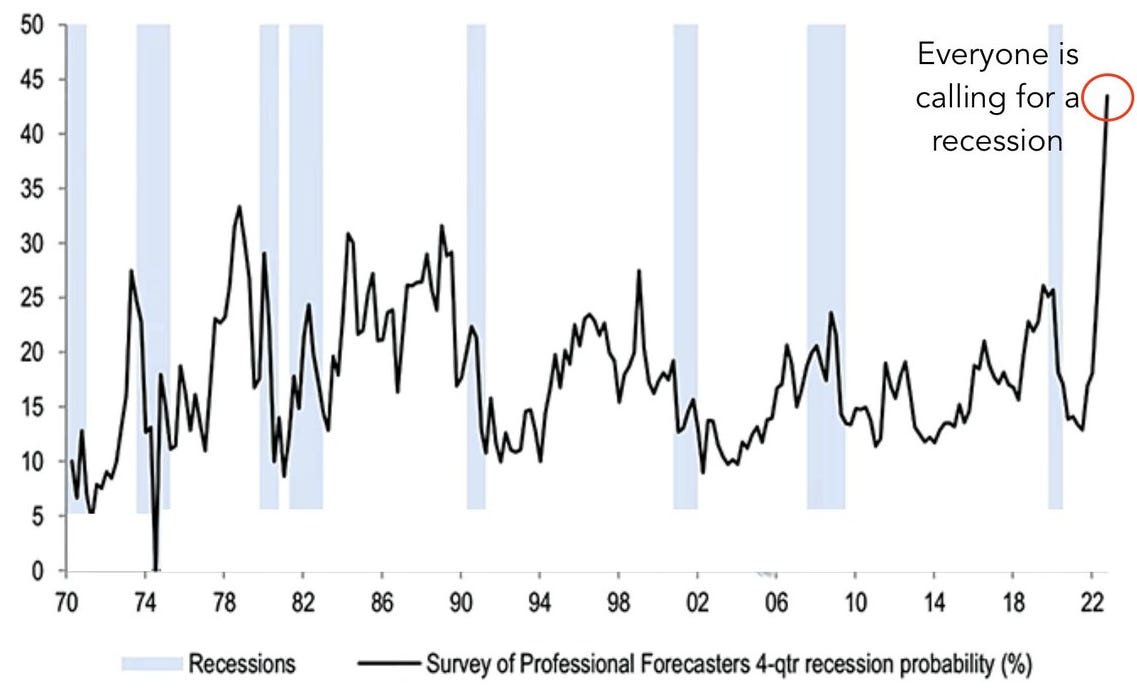
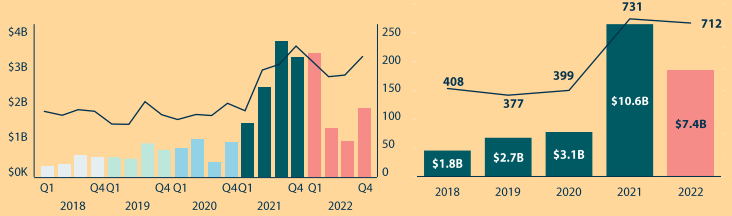
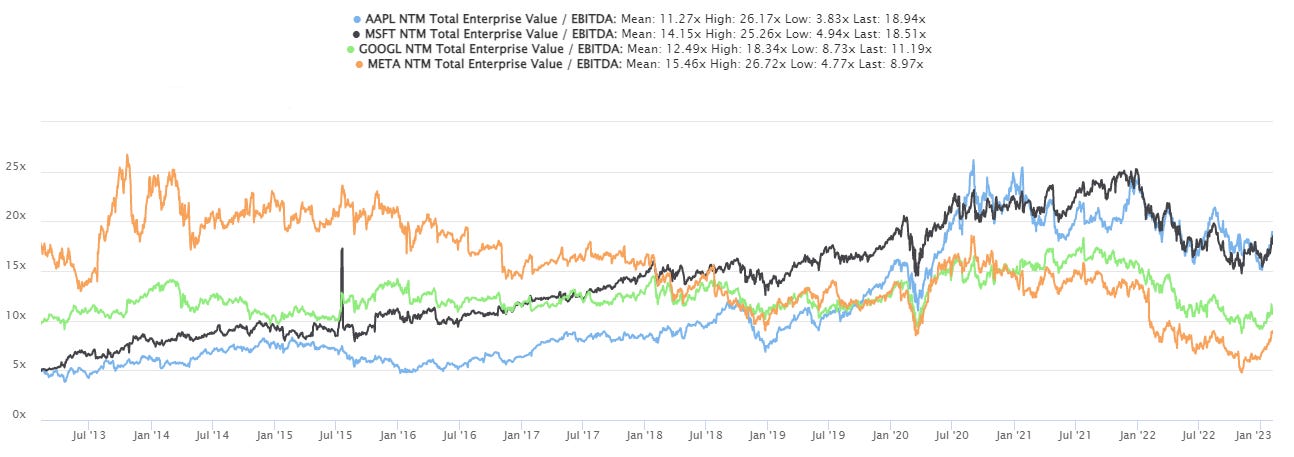
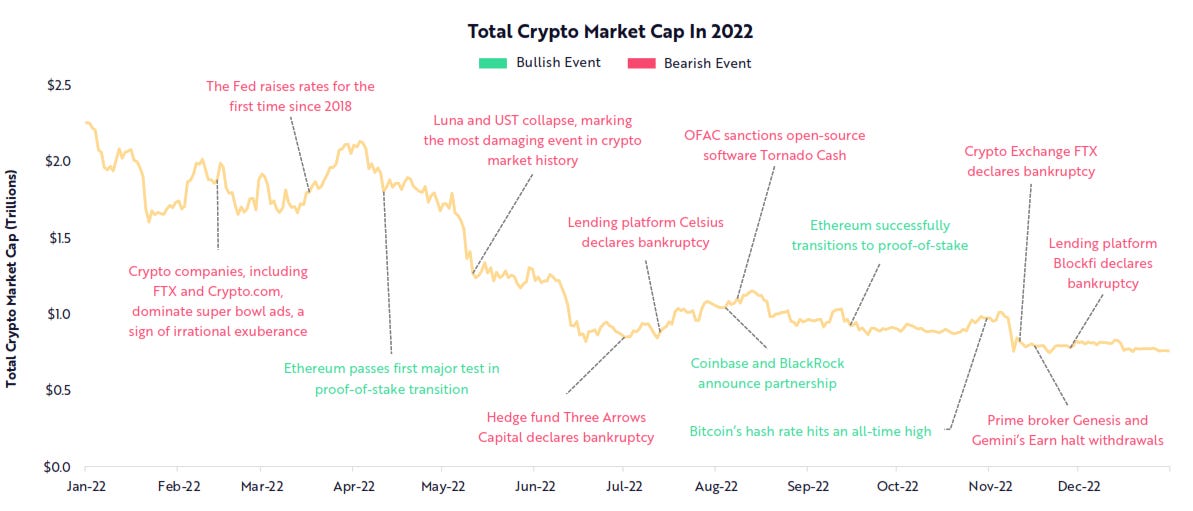
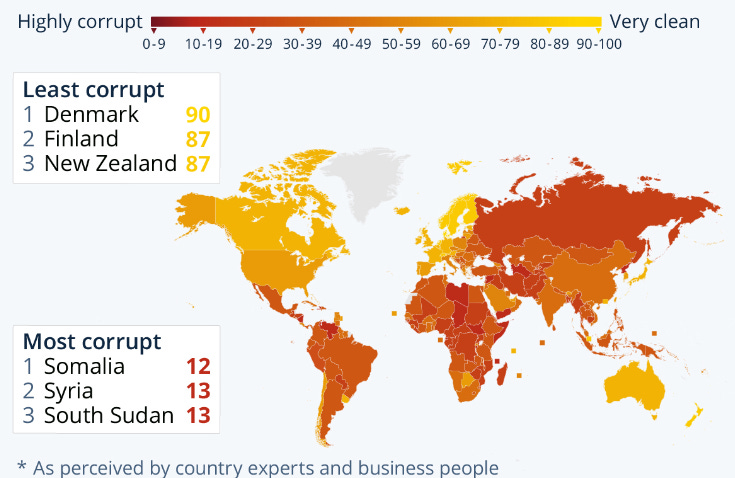
10k Words Equitable Investors February 2023 The "US equity market performance this year can broadly be characterised as a dash for trash," Bespoke declared on Feb 3. Our own analysis of ASX micro-to-mids shows a similar trend - CY2022 losers are now the winners, as are stocks on higher multiples. A case for higher cash rates was charted by Charles Schwab even as Moody's showed inflation is slowing in some countries. FactSet calculated that the decline in the bottom-up EPS estimate recorded during the first month of the first quarter was larger than the 5, 10 and 20 year averages. This follows S&P 500 Q4 GAAP earnings falling 13% year-over-year, as Creative Planning charted. Behind the earnings, JP Morgan found the strongest consensus for a US recession on record. Folkelore Ventures published data on the tough year that was 2022 for Australian VC. In the tech sector we have Apple & Microsoft trading above their 10-year average EV/EBITDA multiples while Google/Alphabet and Meta/Facebook are now below average. JP Morgan reckons households have been deploying into equity and bond funds in early 2023 after underinvesting in 2022. Crypto assets lost $US1.5 trillion in capitalisation says ARK. Finally, we take a look at corruption hot spots via Statista. Russell 1000 Decile Analysis: CY2023-to-date % change
Source: Bespoke
ASX Micro-to-Mids - "Financial, Industrial & Technology" (FIT) factor performance in CY2023-to-date
Source: Equitable Investors Proxy Fed Funds Rate
Source: Charles Schwab Year-on-year inflation is slowing in some countries
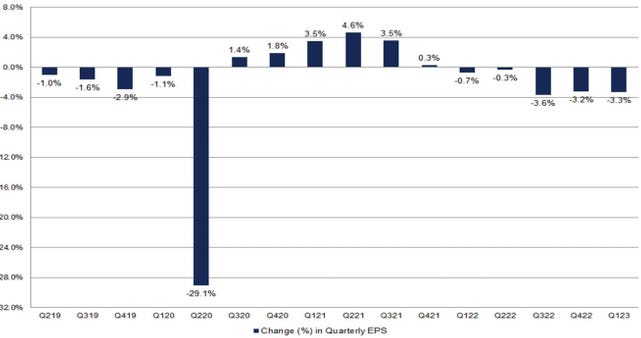
Source: Moody's Change in S&P 500 Quarterly EPS: 1st month of quarter
Source: FactSet
S&P 500 As Reported (GAAP) EPS Growth (Year-on-Year %)
Source: Creative Planning. @CharlieBilello Survey of Professional Forecasters US Recession Probability
Source: Pitchbook, Morningstar, @macroalf Australian Venture Capital raisings by number and amount
Source: Cut Through Venture, Folkelore Ventures Forward EV/EVITDA multiples over 10 years for tech leaders
Source: TIKR, Equitable Investors Global equity & bond fund flows Source: JP Morgan ~$US1.5 trillion wiped out in crypto market capitalisation in 2022
Source: ARK Investment Management Perceived public sector corruption in 2022
Source: Statista, Transparency International February Edition Funds operated by this manager: Equitable Investors Dragonfly Fund Disclaimer Nothing in this blog constitutes investment advice - or advice in any other field. Neither the information, commentary or any opinion contained in this blog constitutes a solicitation or offer by Equitable Investors Pty Ltd (Equitable Investors) or its affiliates to buy or sell any securities or other financial instruments. Nor shall any such security be offered or sold to any person in any jurisdiction in which such offer, solicitation, purchase, or sale would be unlawful under the securities laws of such jurisdiction. The content of this blog should not be relied upon in making investment decisions. Any decisions based on information contained on this blog are the sole responsibility of the visitor. In exchange for using this blog, the visitor agree to indemnify Equitable Investors and hold Equitable Investors, its officers, directors, employees, affiliates, agents, licensors and suppliers harmless against any and all claims, losses, liability, costs and expenses (including but not limited to legal fees) arising from your use of this blog, from your violation of these Terms or from any decisions that the visitor makes based on such information. This blog is for information purposes only and is not intended to be relied upon as a forecast, research or investment advice. The information on this blog does not constitute a recommendation, offer or solicitation to buy or sell any securities or to adopt any investment strategy. Although this material is based upon information that Equitable Investors considers reliable and endeavours to keep current, Equitable Investors does not assure that this material is accurate, current or complete, and it should not be relied upon as such. Any opinions expressed on this blog may change as subsequent conditions vary. Equitable Investors does not warrant, either expressly or implied, the accuracy or completeness of the information, text, graphics, links or other items contained on this blog and does not warrant that the functions contained in this blog will be uninterrupted or error-free, that defects will be corrected, or that the blog will be free of viruses or other harmful components. Equitable Investors expressly disclaims all liability for errors and omissions in the materials on this blog and for the use or interpretation by others of information contained on the blog |


24 Feb 2023 - Hedge Clippings |24 February 2023
|
|
|
|
Hedge Clippings | 24 February 2023 Beware of the Politician with his hand in your pocket... The government set the proverbial cat among the pigeons this week with the "floating" of ideas to change the superannuation system - with a particular emphasis on the top end of town, and it seems those fortunate - or smart enough - to have a super balance of $3 million or more. Depending on where you sit - or maybe that should be where your super balance sits - this is either irrelevant or a clear breach of then shadow treasurer Jim Chalmers' statement on the ABC in March last year that "Australians shouldn't expect major changes to superannuation if the government changes hands." Chalmers is on electorally safe ground for two reasons: Firstly, it's a fair bet that Labor will stay in office for at least one term after the present one, and secondly, he quotes the statistic that the average balance in super is about $150,000. Of course, this is misleading, presumably deliberately, so as not to alienate the "average" voter. The average balance includes those who have only recently joined the workforce - and by recently that would include those on "average" wages who've been working for the past 20 years. According to AMP, you'll need to be closer to 50 than 40 to have a super balance of $150,000 while the average super balance of a 65-70 year old male is $414,380, and $370,042 for a female. Unfortunately, AFSA calculates that a comfortable retirement lifestyle requires a balance of $640,000, so the average is not going to be enough for the average retiree. Super is great, but for the majority is not enough. Chalmers, Albanese, and Assistant Treasurer Stephen Jones have all hit the airwaves to re-iterate that any changes are fairly and squarely aimed at the top end of town, and unlikely to resonate elsewhere - although they should. For far too long superannuation has been tweaked by both sides of politics to the extent that it is incomprehensible to the average (there's that word again) worker. Successive governments have used a combination of carrot (tax incentives for voluntary contributions) and stick (legislation to compel employers to pay or deduct from wages) to reduce the reliance on welfare in retirement. Both have been successful but only up to a point. The stick has helped, but not enough to provide a comfortable retirement to the average retiree. Meanwhile, the carrot has, for those in the treasurer's sights, been overly successful, such that he wants his share of their success! You can't offer a carrot, then take a stick to those who make the most of it. You know what they say about the dangers of having a politician's hand in your pocket... While it seems the devil will be in the detail, hints are that the aim is to limit the amount one can have in super to $3 million. This seems patently unworkable to a simple mind such as ours. More logical would be to set a reasonable tax rate for income over a certain level (excluding capital withdrawal) from super in retirement. That won't be popular either, because once a tax has been introduced it will only be a matter of time before it is increased. Chalmers is trying to avoid the stuff-up Bill Shorten made suggesting changes to franking credits before his 2019 election loss. His other target might be negative gearing on property, but too many pollies have second properties (Albo included) so that's not likely as too many votes would evaporate. Taxing the super of the rich (and the not so rich) is a much safer option. |
|
|
News & Insights Market Update January | Australian Secure Capital Fund China re-opening post COVID | 4D Infrastructure January 2023 Performance News Bennelong Long Short Equity Fund Digital Asset Fund (Digital Opportunities Class) Insync Global Quality Equity Fund Glenmore Australian Equities Fund Delft Partners Global High Conviction Strategy |
|
|
If you'd like to receive Hedge Clippings direct to your inbox each Friday
|

24 Feb 2023 - Performance Report: Collins St Value Fund
[Current Manager Report if available]

24 Feb 2023 - China's reopening presents opportunities for investors
|
China's reopening presents opportunities for investors WaveStone Capital February 2023 The end of China's zero Covid Policy has spurred a dramatic turnaround in not only China's equity market, but also those with China-linked revenues. The opportunity for Australia has historically been in resources, but WaveStone Capital think it will be different this time. Hear from Raaz Bhuyan, Principal and Portfolio Manager on the opportunities for investors as the biggest contributor to global economic output opens its doors.
|
|
Funds operated by this manager: WaveStone Australian Share Fund, WaveStone Capital Absolute Return Fund, WaveStone Dynamic Australian Equity Fund |
23 Feb 2023 - Performance Report: Equitable Investors Dragonfly Fund
[Current Manager Report if available]