
NEWS

14 Mar 2023 - January Junkyard Dogs
|
January Junkyard Dogs Arminius Capital February 2023 January looked like a great start to 2023, after the losses of 2022. The S&P/ASX200 index was up 6.2% for the month, similar to the 6.3% rise in the US S&P500 index. Share markets in Europe, China and Latin America were even stronger. But appearances can be deceptive. The January rally was built on hope, not facts. Investors were betting that the Fed would stop raising interest rates and the battered tech sector would recover. For example, Tesla gained 40%, Bitcoin jumped 38%, and even the joke Dogecoin rose 32%.
What investors were doing is called bottom fishing: that is, they were buying the assets which had fallen the furthest in 2022, on the grounds that they must be cheap after such big price falls. For example, Meta Platforms (the disaster formerly known as Facebook) fell by 76.7% from peak to trough in 2022. In January 2023 it rebounded by 109.8%: simple arithmetic tells you that it is still down 51.2%, i.e. Meta shareholders have still lost half their money. Is Meta cheap? History suggests it isn't. The investors who are buying beaten-down tech stocks in this cycle are usually too young to remember the aftermath of the 2000 dotcom boom. As PT Barnum said, "There's one born every minute." Older readers will recall that the tech stocks began to slip in April 2000, and kept sliding for the next four years. They did enjoy rebounds every few months, but these were all false dawns as the bear market persisted. The best of the tech stocks - think Amazon, Google, Microsoft - lost about 75% of their value from peak to trough. The rest of the tech stocks just disappeared altogether. In fact, if dividends are excluded, the whole US share market was no higher in 2007 than it had been in March 2000. The January 2023 rally ended in early February as the Fed (and other central banks, including our own Reserve Bank) put an end to investors' fantasies by making it very obvious that interest rates were going higher and staying up for longer. Early reporting from US companies for the December 2022 quarter showed that in many cases profitability was falling short of expectations.
Arminius continues to believe that, even though we are now in the Year of the Rabbit, several of the tigers from 2022 are still hanging around, such as oil prices and the Ukraine crisis, and they have been joined by the problem of Congressional gridlock in the US. The biggest of these tigers is inflation, which is not going back to the sub-2% levels which was obtained in the peaceful decade before Covid. At best, US inflation will abate from 7% to around 4%, but then it will get stuck. The tight US labour market is pushing up wages in key sectors, and companies are pushing through price increases in order to pass on increases in wages and input costs. Persistent inflation means that the Fed will not cut interest rates as quickly as the bond market is hoping. At worst, US inflation will fall slightly then begin to rise again, e.g. because of external factors such as higher oil prices or higher commodity prices. Under these circumstances, the Fed may have to raise interest rates again ala the Ghost of Arthur Burns past. The outlook for Australia is better than the outlook for the US, and we expect the Australian share market to outperform the US over the next three years. This has nothing to do with domestic Australian policies; if anything, it's in spite of. The main drivers of this positive outlook are China and the resources boom. The Chinese economy is not recovering as fast as the bulls might hope, but it will be back to pre-Covid levels by late 2023. In addition, the Chinese government is quietly stepping back from its unofficial bans on Australian exports from coal to lobsters. Global de-carbonization is fueling a resources boom which will focus on the minerals used in batteries and clean energy generation, "critical minerals" such as copper, nickel, cobalt, graphite and lithium. This latest resources boom means that Australian investors will enjoy a rising A$ against most major currencies, which will also help to curb domestic inflation. US investors, by contrast, will see the US$ continue to weaken, which tends to mean importing inflation. The single most important thing for investors to remember in 2023 is that the world has changed. We are not going back to the world of ultra-low interest rates because inflation is not going away, and the forty-year bull market in bonds ended abruptly and painfully in 2022. This paradigm shift means that investors need to question the habits which they have built up since the GFC, and adjust their investment strategies to a world of higher volatility, where real assets will outperform financial assets.
Australian equities will perform better than most of the world over the next three years, but the new paradigm of higher volatility means that the old strategy of buy-and-hold won't work very well in a world where commodities and resource companies lead share market performance. To cope with the coming turbulence, investors will need exposure to commodities and to long/short strategies - i.e. the ability to short shares as well as buying them. The Arminius Capital "ALPS" strategy returned +21.67% in 2022, compared to negative -19% for the US S&P500 and negative 1.1% for Australia's S&P/ASX200. The 2022 return puts ALPS among the top 3 out of 39 alternative funds. The key factors behind the ALPS annual return of +21.6% were to invest in commodities and to invest long/short. Funds operated by this manager: |


13 Mar 2023 - Performance Report: L1 Capital Long Short Fund (Monthly Class)
[Current Manager Report if available]

13 Mar 2023 - Performance Report: Cyan C3G Fund
[Current Manager Report if available]

13 Mar 2023 - The Long and The Short: Could the year ahead defy the Fed?

13 Mar 2023 - New Funds on Fundmonitors.com
|
New Funds on FundMonitors.com |
|
Below are some of the funds we've recently added to our database. Follow the links to view each fund's profile, where you'll have access to their offer documents, monthly reports, historical returns, performance analytics, rankings, research, platform availability, and news & insights. |
|
|
|||||||||||||||||||
| Argonaut Australian Gold Fund | |||||||||||||||||||
|
|||||||||||||||||||
 |
|||||||||||||||||||
| Maxiron Monthly Income Trust | |||||||||||||||||||
|
|||||||||||||||||||
| View Profile | |||||||||||||||||||
|
Want to see more funds? |
|||||||||||||||||||
|
Subscribe for full access to these funds and over 700 others |


10 Mar 2023 - Hedge Clippings | 10 March 2023
|
|
|
|
Hedge Clippings | 10 March 2023
Let's have a real conversation about tax! Following the flurry of indignation, debate, and media comment raised by the government's changes to super balances over $3 million, everything seems to have gone quiet. Maybe this is just the temporary or short-lived nature of the news cycle, or possibly that it's hard to maintain the rage or focus on something that affects less than 1% of the population, and a seemingly privileged one at that. However, that doesn't change a couple of key issues we have with Dr. Jim's "discussion" with Australians about the purpose of their super. Firstly, the increased 30% tax rate is triggered by the value of the asset, not the amount of income earned. Secondly, if triggered, tax is payable on both realised and unrealised gains. However, those are just the details. What also seems illogical is that Treasury forecasts estimate the new tax will raise just $2 billion out of almost $250 billion a year in concessions, or less than 1% of the total. Watch out, because what the government would really like to do is to come after some of the remaining 99% if they can. Of course to do that - as Bill Shorten discovered in 2019 - they'll upset far more voters than the 0.5% impacted by their current plans, most of whom are unlikely to be Labor voters in the first place. Of course, what is needed is a total review or conversation, not only around super but the overall taxation system in Australia. We had one of those in the form of the Henry Tax Review (aka Australia's Future Tax System Review) announced by then PM "Kevin '07", in 2008. Having taken 2 years to prepare, this was handed to the hapless Rudd two days before Christmas in 2009, but not released until May the following year. For the record, Kevin Rudd was also careful to shackle Henry's review before it started. It was not allowed to consider increasing the rate of, or broadening the base of the GST, or consider imposing tax on super payments to retirees aged over 60! Henry's report made 138 recommendations grouped under 9 broad themes. Rudd implemented just 3 of the 138 changes suggested in the report, lost his job over one, the proposed resources Super Profit Tax, which became the Minerals Resource Rent Tax (MRRT), passed in 2012 under Julia Gillard, and promptly repealed by Tony Abbott in 2014. History shows it is wise to choose your targets carefully, and avoid upsetting the powerful, and in the case of the resources Super Profit Tax, well resourced (pun intended) self interested companies, 83% of which were reportedly offshore owned. History also shows the futility of trying to overhaul or change the existing system, however broken, inefficient, or inequitable it may be. Most of Henry's report and its recommendations remain in the too hard basket, gathering dust. Some, such as a reduction in company tax, have been partially implemented. This leads us to two questions: Firstly, will we ever get the reform Henry's review proposed, such as just two levels of personal income tax and a much higher tax free threshold ($25,000), across the board company tax of 25%, and a simplification of superannuation, deductions, and offsets? And secondly, will any politician ever dare to increase the GST from its current 10%, and broaden its base in return for a reduction in personal income tax? This 2020 report from PWC estimated that by increasing the GST rate to 12.5% and broadening the base to include water, childcare, health, education, and food, it would generate $40 billion a year - so a rate of 15%, (as it is in New Zealand) let alone 20% (the OECD average rate is 19.3%), it would presumably take that towards $100 billion. The answer to both questions is "unlikely" given the political pain involved. However, that's the conversation Dr. Chalmers needs to have with Australians. And then get on with it! |
|
|
News & Insights New Funds on FundMonitors.com Market Commentary | Glenmore Asset Management Investment Perspectives: 10 charts for optimism in 2023 | Quay Global Investors Magellan Infrastructure Strategy Update | Magellan Asset Management February 2023 Performance News 4D Global Infrastructure Fund (Unhedged) Delft Partners Global High Conviction Strategy |
|
|
If you'd like to receive Hedge Clippings direct to your inbox each Friday
|

10 Mar 2023 - Performance Report: Argonaut Natural Resources Fund
[Current Manager Report if available]

10 Mar 2023 - When inflation meets recession
|
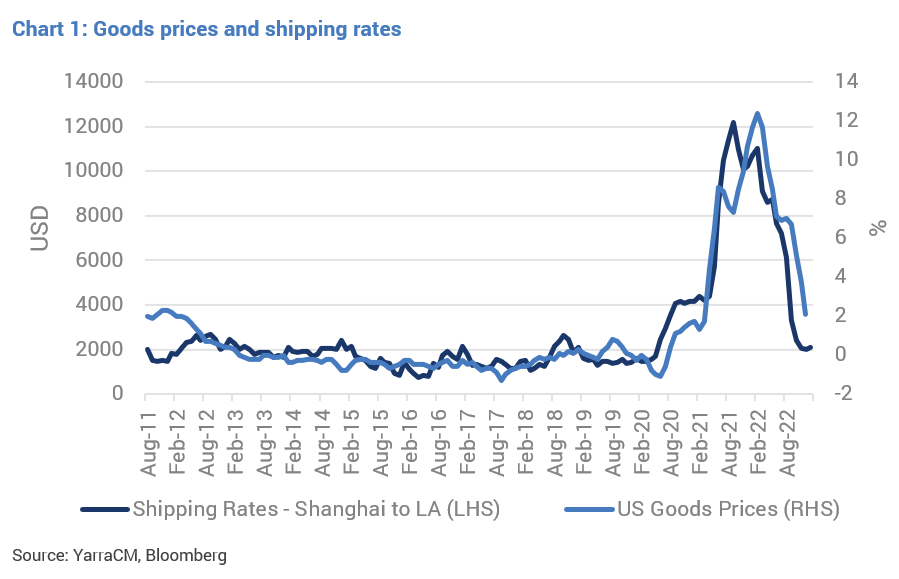
When inflation meets recession Yarra Capital Management February 2023 So, has inflation peaked or not?Given the multi-decade high inflation levels of 2022 was the precursor to aggressive interest rate hikes, a key driver for the 2023 outlook is the direction of inflation. Throughout 2022 three core factors drove higher inflation; supply chain issues, amplified goods demand due to stimulus, and a commodity price shock. All three appear to have peaked. Several economic indicators suggest that supply chain issues are behind us. The supply chain measure provided by the Federal Reserve has fallen, shipping rates between the US and China have normalised (refer Chart 1), and key global exporters such as Korea and Germany are now seeing export orders decline.
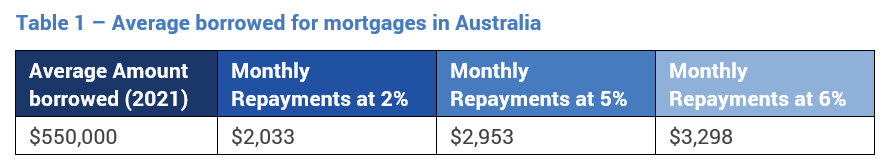
Additionally, the impact of central bank rate rises through 2022 should see consumer spending slow in 2023, as the fastest rate hiking period in the past 30 years quickly constrains household budgets. In Australia, we expect to see mortgage costs rise anywhere from 20-60% (for the typical borrower), with those who borrowed on a fixed rate over the past 18 months will see a 60% increase in payments. After an era of cheap money and stimulus provided during COVID, this should take the sails out of the outsized goods demand over the past two years.
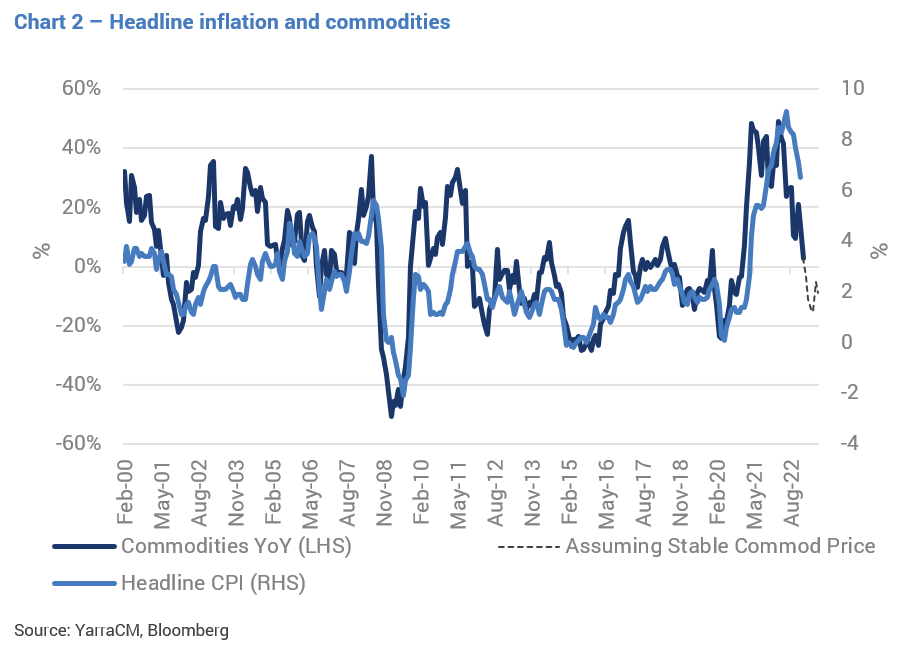
While geopolitical risk related to Russia dominated headlines in 2022, commodity prices have begun to fall. Oil is now flat on a year-on-year basis and commodities are declining. Commodity prices are one of the strongest predictors of inflation, and the more benign commodity prices, point to inflation falling away in 2023 (refer Chart 2).
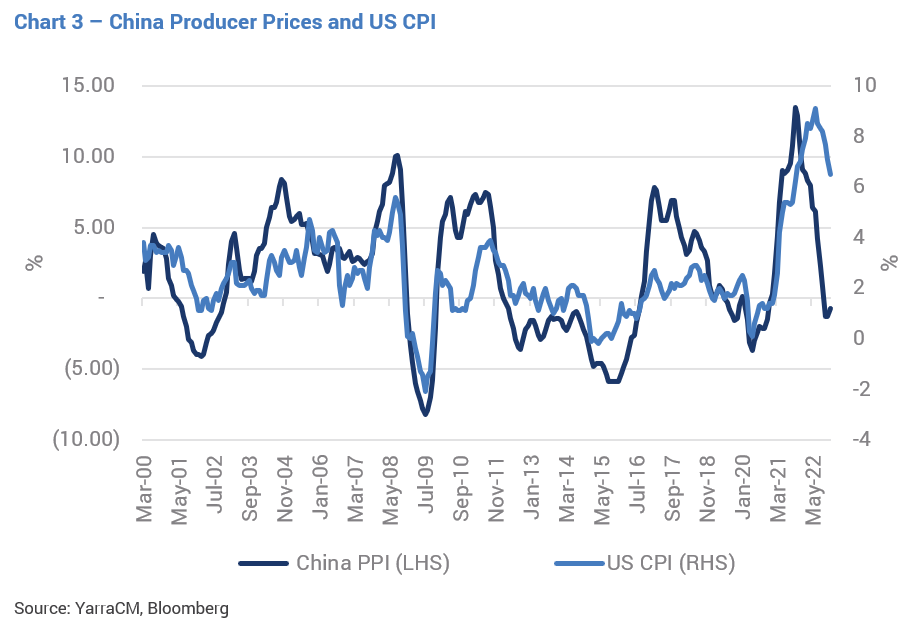
Outside of these factors, several other lead indicators of inflation are beginning to decline. These include producer prices in China dropping to deflationary levels (refer Chart 3).
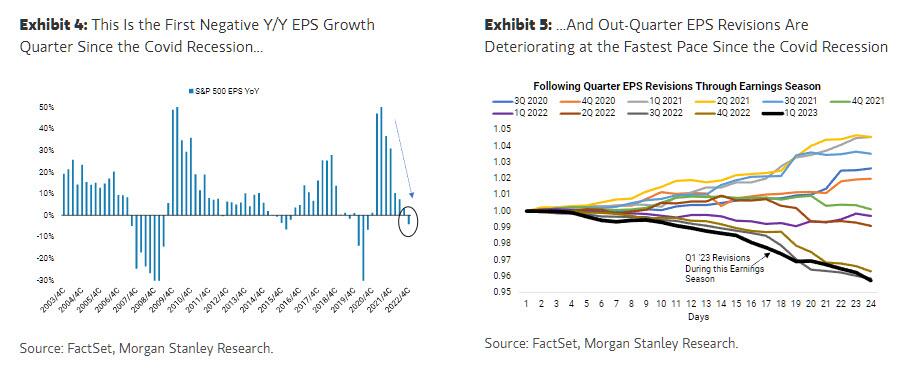
PMI surveys show that firms are now reporting that input prices are falling, and small business surveys show the number of firms passing on price increases has peaked (refer Chart 4).
While the indicators do not point to a deflationary environment, the speed with which they have shifted, combined with the central bank's aggressive hiking cycle, suggests that we could see inflation back within their target bands by the middle of the year. This would encourage central banks to keep interest rates high but remove their hawkish bias. Signs pointing to rising recession riskThe second factor that is likely to determine interest rates in 2023 is related to recession risk. Historically, when a recession occurs, interest rates fall aggressively as central banks ease financial conditions to boost their economies. This has occurred in every recession over the past 50 years (refer Chart 5).
On average, following a recession, the cash rate dropped by 400 basis points, with smaller decreases only occurring when the cash rate hit the zero bound (refer Table 2). In no instance did the cash rate finish the recession higher or at the same rate it started.
If the US enters a recession in 2023, there will be pressure on the Federal Reserve to cut the cash rate. Currently, several recession indicators are starting to flash red and point to a distressing growth signal. These signals can be seen in the leading index of US growth, new orders, consumer expectations, and housing. For example, the leading US growth index has moved into contraction (refer Chart 6) and is now at a level indicative of a recession, as observed in all of the past eight occurrences.
A warning sign of recession can also be a result of falling indexes including new orders relative to inventories which have now seen the US yield curve invert across multiple maturities (refer Chart 7). Historically, this has preceded a recession by approximately six to 12 months, reflecting monetary policy has become too tight for economic conditions. As with the leading index above, curve inversion has not given a false positive and has preceded all recessions since 1970.
In addition, we are seeing recessionary signals such as a weak housing market and an extreme softening in consumer confidence.
While many may hope that the economy faces an unemployment-less recession, i.e., that unemployment doesn't rise as growth falls, this would be an extremely rare occurrence. Over the past 50 years, unemployment has never remained stable through a recession, rising anywhere from 0.6% to 3% higher over a six-month period. If the US economy does enter a recession, a rise in unemployment should not be far away.
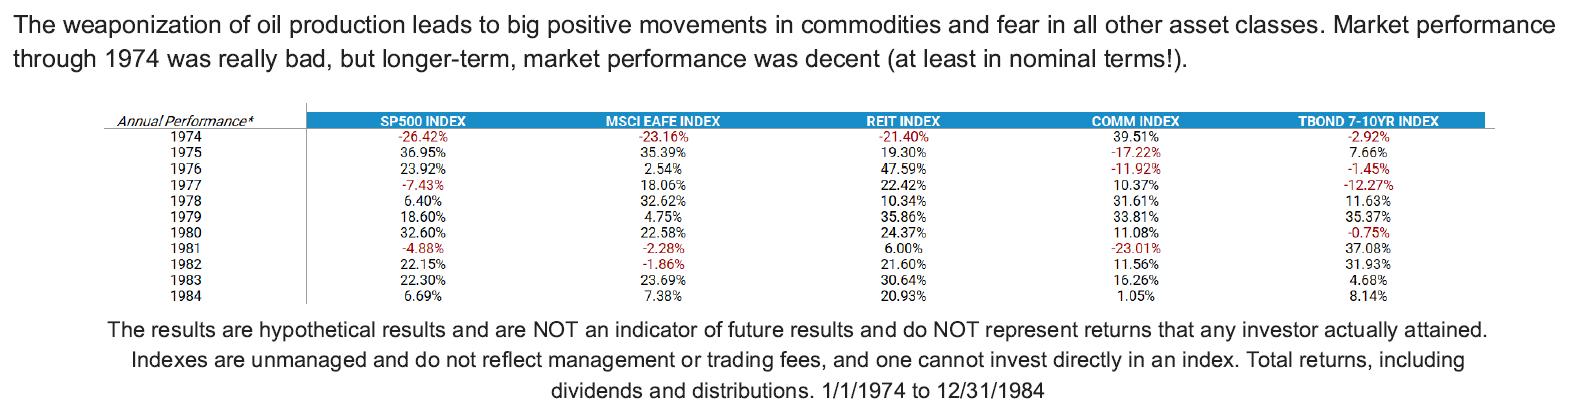
The key takeaway is that we have not seen this many recessionary signals since 2007, creating strong pressure for central banks to ease rates should a recession occur. Interest Rate Outlook - Inflation meets recessionThese two forces produce two very different outcomes for central banks and interest rates. On the one hand, high but slowing inflation should encourage central banks to maintain their hawkish stance, hold rates high and ensure that inflation returns to its 2% targets. However, the deterioration in economic data would historically have seen a dovish tone being adopted by now. So which force should win? The below chart shows that, historically, recession risk dominates. When recession occurred in the '70s, '90s, and '00s, rates fell even when inflation was high. Furthermore, in 1974 and 2008, the cash rate fell before inflation peaked and was still running at over 5%.
Despite this, the Federal Reserve continues to present an extremely hawkish message, expecting to make cash rate moves that take little consideration of the existent lags in monetary policy. The Federal Reserve dot plot (a chart that records each Fed official's projection for the central bank's key short-term interest rate) currently shows an expectation for cash rates to be around 5.5% in 2023. Considering this, it may set up 2023 to be a tale of two halves; higher cash rates to begin the year and lower cash rates mid-year as the Fed acknowledges the recession risks. With this in mind, we believe rates will end 2023 lower than 2022, even if central banks continue to talk a hawkish message in the first few months of this year. If the recessionary indicators prove correct, then rate cuts of 400 points is the magnitude required to restart the economy, which would drag short-dated interest rates into a 1-2% range. The Yield Curve - Flatter short-term, much steeper long termThe yield curve is one of the most consistent series in bond markets as both the driver of its changes and the levels it respects. While bond yields have fallen from 15% to 0%, the spread between the two and 10-year bonds has typically been range bound between -100bps and +250bps. When looking at the two-component rates of the curve, it is easy to see that monetary policy direction is the key driver that determines both steepening and flattening. When the cash rate rises the yield curve flattens, and when the cash rate falls the yield curve steepens. This occurs as the 2-year yield makes larger moves with the change in the cash rate while the 10-year yield is slower-moving. Typically, the 2-year yield moves the fastest to cause large changes in the shape of the curve (refer Chart 11).
We can make two comments about the direction of the curve:
As such, we currently favour a steepening position for three reasons. Firstly, central banks can change their minds and we believe that the magnifying recession signals should not be ignored. If the recession risks are proven true, we should see dovish actions take place sometime in 2023 which will cause the curve to steepen. This idea is backed up by the fact that post-1970, curve inversion has signalled that rate hikes should be coming to an end.
Secondly, the typical flattening cycle occurs over multiple years, while the steepening period is usually far shorter, with the first 100 points of steepening occurring over 9-12 months.
And finally, the curve typically struggles to flatten through -50 to -75 levels that are now broken and take the inversion to historically stretched levels. As such, we are looking to position ourselves to capture the next 200-point move steeper, rather than the last 20-50 points flatter. Is the RBA done with interest rate hikes?While the majority of this outlook has focused on the US, as Australian and US long end rates are highly correlated, for short-dated rates it is important to consider whether or not the RBA has finished its hiking cycle. This is important as the differential between US and Australian short-dated rates is largely determined by the cash rate differential. When the Australian cash rate is higher than that of the US, then 2-year bond yields in Australia will be higher too. Since Australian short-dated bonds remain well below the US, the ability for them to move in a similar nature to the US will depend on the RBA's next action.
One of the key differences between Australia and the US is that the Australian mortgage market is predominantly a variable rate market, while the US mortgage market is fixed. This means the Australian household should feel the brunt of rate hikes faster and at a lower interest rate than in the US. We determine how restrictive monetary policy is by estimating the percentage of disposable income allocated to repaying loans. This measure accounts not only for interest rates but total debt loads and income in the economy. As shown below, the current RBA hikes have already taken this measure to some of the tightest monetary policy settings we have seen in the past 40 years.
Since the Australian policy setting is becoming historically tight, and the global economy is slowing, we believe the RBA is approaching the end of its hiking cycle. If this is the case, 3-year bond yields should have already peaked for this cycle and are currently close to what we consider a fair value. Whether or not short-dated bonds can rally in Australia in 2023 will depend largely on what the RBA does with the cash rate. In previous hiking cycles, if the cash rate can remain stable for 12 months or longer (1995 and 2010), then 3-year bond yields consolidated at those levels for an extended period (refer Table 3). However, when the cash rate held at its peak for only six months (such as in 2000 and 2008), bond yields rallied in anticipation of future cuts and saw yields materially under the cash rate.
Currently, it's too premature to tell whether the RBA will need to cut rates in 2023, as the lead growth indicators for Australia are not as weak as they are in the US. However, if the US and Europe enter a recession, we would expect Australia to follow. Given we are likely near the peak of the cash rate cycle, this effectively sets up an outlook where two outcomes can likely occur. If the global economy avoids a recession, Australian 3-year yields should be somewhat stable and trade around 3.50%. Alternatively, if the global economy continues to slow, we should end the year with yields well below 3%. Therefore, we expect there is a strong likelihood that short-dated yields will end in 2023 lower than in 2022. Author: Chris Rands, Co-Portfolio Manager of the Yarra Australian Bond Fund |
|
Funds operated by this manager: Yarra Australian Equities Fund, Yarra Emerging Leaders Fund, Yarra Enhanced Income Fund, Yarra Income Plus Fund |


9 Mar 2023 - Performance Report: DS Capital Growth Fund
[Current Manager Report if available]

9 Mar 2023 - Performance Report: Delft Partners Global High Conviction Strategy
[Current Manager Report if available]