
NEWS

5 Apr 2023 - The Path to a Soft Landing is a Narrow One, yet Stocks Hold Together
|
The Path to a Soft Landing is a Narrow One, yet Stocks Hold Together Wealthlander Active Investment Specialist March 2023
The latest RBA statement highlights the problem of high inflation and that the path to a soft landing is a narrow one. It reiterates the RBA's commitment to pursuing a 2 - 3 % inflation target, a target which notably the current RBA leadership has never sustainably achieved. It flags further interest rate increases too, as has the Federal Reserve. Markets think a further two rate increases in Australia are needed bringing the cash rate to circa 4% and, more importantly, home loan rates beyond 6%. Home loan rates of over 6% will cause much pain to the average Australian mortgagee rolling off a fixed rate mortgage this year and make a meaningful impact on consumer discretionary spending. As such, we have already seen building approvals fall off in January and much anticipation that Australia will be heading in later 2023 for its first real housing-associated recession since the early 1990s. Much of the global economy is battling similar issues, and housing price falls. Somewhat perplexingly, equities have held up in 2023 despite belated recognition from bonds that the interest rate pressures aren't over and despite earnings margin deterioration and higher discount rates. Surely equities should have realised by now that we are heading for recession and that the cost of money has risen, so why are they so slow to get the memo? The answer to this question is critical to the path forward. So, let's consider it. There are a few potential reasons for high valuations and equity market intransigence, led by the US: (1) Corporations are still awash with cash because of the massive post-covid government stimulus and are still engaging in aggressive buybacks globally. These corporations feel the need to do something with their cash and prefer to spend it buying their stock regardless of price. (2) The price-independent "passive investor" or buyer has become dominant in markets. Passive managers don't value anything before they buy it and are price and outlook insensitive. This tends to boost market prices. (3) The amount of speculation in markets remains incredibly high. Options markets now trade over $1 trillion in notional value daily, which is greater than physical buying. Much of these are one-day or less options capable of easily moving market pricing in the short-term due to its sheer leverage and dominance! Equity markets have hence never been more casino-like and vulnerable to speculative flows. No wonder price movements defy belief in recent times and over short periods. Much of the market doesn't care whether we are in a recession in late 2023 because it's either price insensitive or only concerned with the current day's price movements. How we got to this ridiculous scenario is another story. So, it is indeed different in a meaningful way this time because of the character of market participants, but will it be different when we enter recession and earnings, and earnings margins take a more significant hit? This depends on the provision of one key factor, the actual amount of liquidity provided by central banks, commercial banks, and governments to the market. Commercial banks are and will likely be less willing to lend money to the less creditworthy when the outlook is poor, but what about governments and central banks? Governments, on the other hand, have become more fiscally irresponsible and dominant globally. They are likely to continue stimulating no matter what, given recent trends for greater government, the need for massive stimulus programs for infrastructure, climate change and increased military spending, and worsening dependency ratios and inequality. The swing factor is central banks. Suppose central banks are true to their words and are committed to getting inflation down sustainably. In that case interest rates will increase further and potentially stay higher for longer in the face of economic weakness. Quantitative tightening will suck liquidity out of the market. Given the above, the equity market is still likely to suffer and behave as it has in every other recession (assuming we get a recession, which leading indicators suggest is highly probable). The challenge for the outlook is that markets don't trust central banks to do what they say, and they have legitimate reason to be sceptical. Central banks could easily give up on tightening measures and reverse course in the face of weakening economies and rising unemployment. Equally, there is a solid case to be made given the sheer amount of debt in the global economy there isn't a realistic option for central banks to become fully responsible now. It is simply too late as the economy has been overly financialised, and without ongoing stimulus, a deflationary bust will ensue which politicised central banks can't tolerate. In other words, financial repression is needed whereby interest rates are kept artificially low to stimulate higher structural inflation to wear away high debt levels over time. This provides a potential path for equity markets to hold up and explains how it could be different this time. In our view, both the bears and bulls will be wrong and right. Central banks are first likely to cause a market accident or hard landing particularly given the nature of market participants and speculation in today's equity market, yet ultimately will be forced into a path of financial repression. It's a matter of timing. So, while cash looks attractive today, its attractiveness is likely to be somewhat fleeting. Equally equities are unattractive today but will likely provide a great buying opportunity at some point later this year. History has convincingly demonstrated that in every market sell-off investors don't buy at the bottom and become afraid to become invested. Investors hence need to be invested, but just prudently at this point in time to avoid the risks of a hard landing in the short-term while still capture the likely benefits of financial repression over time. This means being invested with truly active and dynamic management that will buy into economic and equity market weakness when it arises but is investing cautiously with low equity market exposure for now, patiently waiting for the opportunity to strike. This management style will look to take advantage of an opportunity that we know investors are not structured to achieve and will otherwise miss. You need to be in it to win it, but equally you need to ensure the journey is tolerable too. Funds operated by this manager: WealthLander Diversified Alternative Fund DISCLAIMER: WealthLander Pty Ltd is a corporate authorised representative (CAR) of Boutique Capital Pty Ltd (BCPL) AFSL 508011, CAR Number 001285158. CAR is the investment manager of the WealthLander Diversified Alternative Fund (Fund). To the extent to which this document contains advice it is general advice only and has been prepared by the CAR for individuals identified as wholesale investors for the purposes of providing a financial product or financial service under Section 761G or Section 761GA of the Corporations Act 2001 (Cth). The information herein is presented in summary form and is therefore subject to qualification and further explanation. The information in this document is not intended to be relied upon as advice to investors or potential investors. It has been prepared without considering personal investment objectives, financial circumstances or particular needs. Recipients of this document are advised to consult their own professional advisers about legal, tax, financial or other matters relevant to the suitability of this information. The investment summarised in this document is subject to known and unknown risks, some of which are beyond the control of CAR and its directors, employees, advisers or agents. CAR does not guarantee any particular rate of return or the performance of the Fund, nor do CAR and its directors personally guarantee the repayment of capital or any particular tax treatment. Past performance is not indicative of future performance. The materials herein represent a general summary of CAR's current portfolio construction approach. CAR is not constrained with respect to any investment decision-making methodologies and may vary from them materially at its sole discretion and without prior notice to investors. Depending on market conditions and trends, CAR may pursue other objectives or strategies considered appropriate and in the best interest of portfolio performance. There are risks involved in investing in the CAR's strategy. All investments carry some level of risk, and there is typically a direct relationship between risk and return. We describe what steps we take to mitigate risk (where possible) in the Fund's Information Memorandum. It is important to note that despite taking such steps, the CAR cannot mitigate risk completely. This document was prepared as a private communication to clients and is not intended for public circulation or publication or for the use of any third party without the approval of CAR. While this report is based on information from sources that CAR considers reliable, its accuracy and completeness cannot be guaranteed. Data is not necessarily audited or independently verified. Any opinions reflect CAR's judgment at this date and are subject to change. CAR has no obligation to provide revised assessments in the event of changed circumstances. To the extent permitted by law, BCPL, CAR and its directors and employees do not accept any liability for the results of any actions taken or not taken on the basis of information in this report or for any negligent misstatements, errors or omissions. This Document is for informational purposes only and is not a solicitation for units in the Fund. Application for units in the Fund can only be made via the Fund's Information Memorandum and Application Form. |


4 Apr 2023 - Cyber security - the new world order
|
Cyber security - the new world order Magellan Asset Management February 2023 |
|
A globally recognised cyber communications expert and former Chief Information Officer to the US president, Suzette Kent brings a world of experience to the realm of cyber and data security. In this episode of Magellan, In the Know, Magellan Head of Macro and Portfolio Manager Arvid Streimann speaks with Suzette Kent in a broad-ranging discussion about the new cyber security landscape. Are companies concentrating enough on internal security? Which sectors are most at risk? How do you tell if a prospective investment is cyber secure? All these questions and more are answered in this instructive and informative episode. |
|
Funds operated by this manager: Magellan Global Fund (Hedged), Magellan Global Fund (Open Class Units) ASX:MGOC, Magellan High Conviction Fund, Magellan Infrastructure Fund, Magellan Infrastructure Fund (Unhedged), MFG Core Infrastructure Fund The information contained in this podcast is for general information purposes and does not constitute investment advice. You should seek investment advice tailored to your circumstances before making any investment decision. Opinions stated are Ms. Kent's own and not to be considered reflective of any of the organizations with whom she affiliated. |

3 Apr 2023 - 10k Words - SVB Special
|
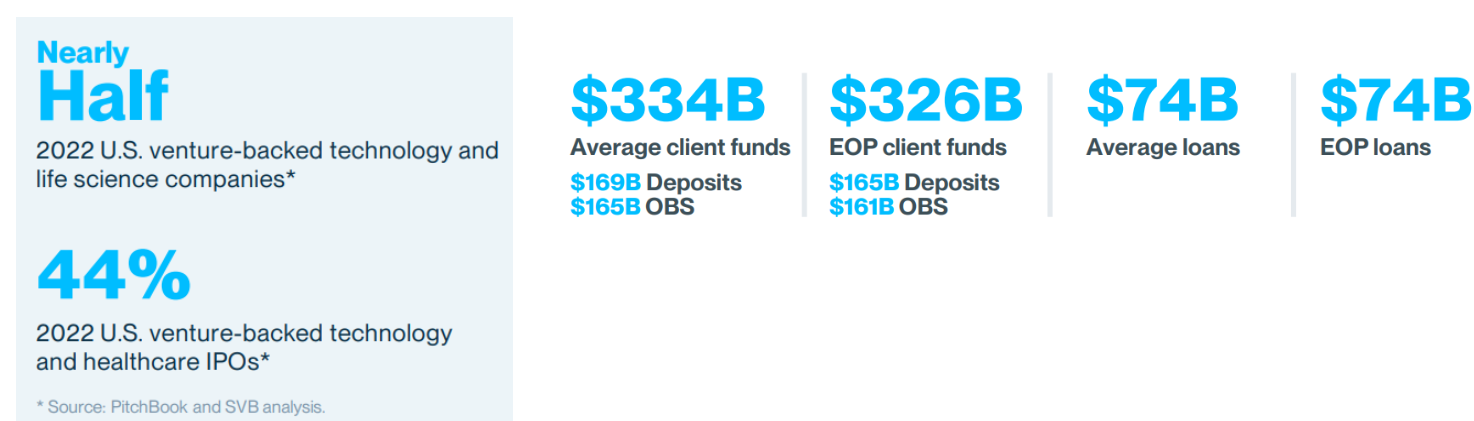
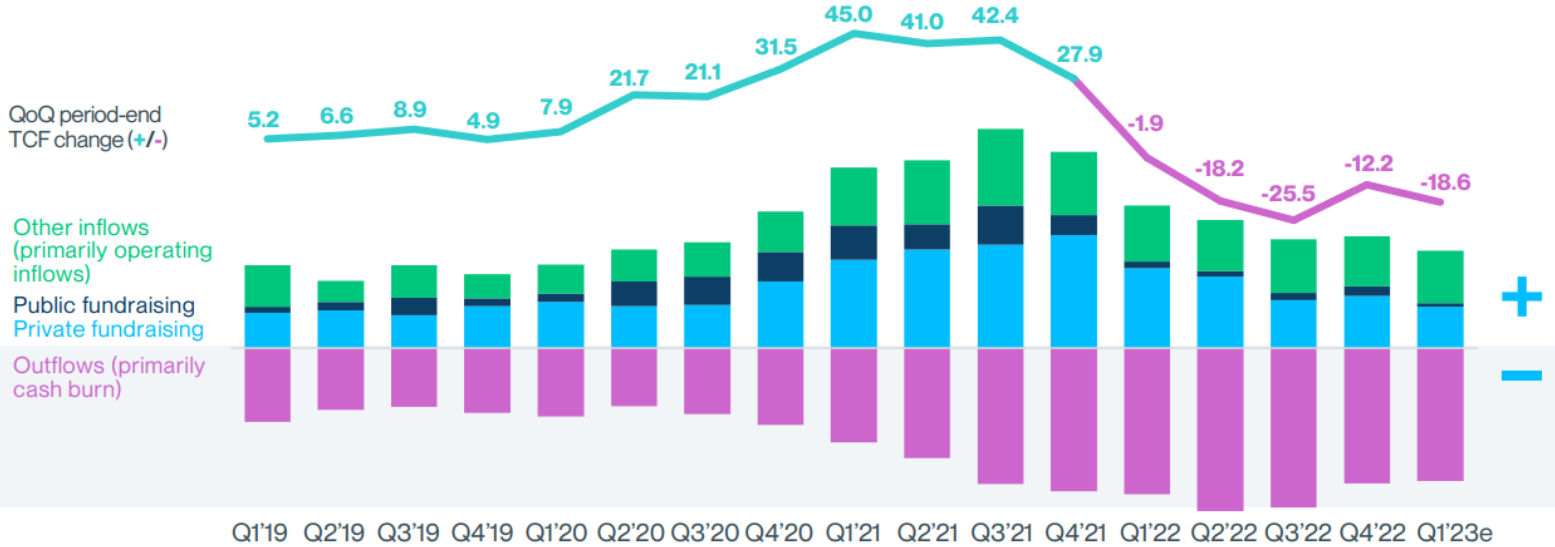
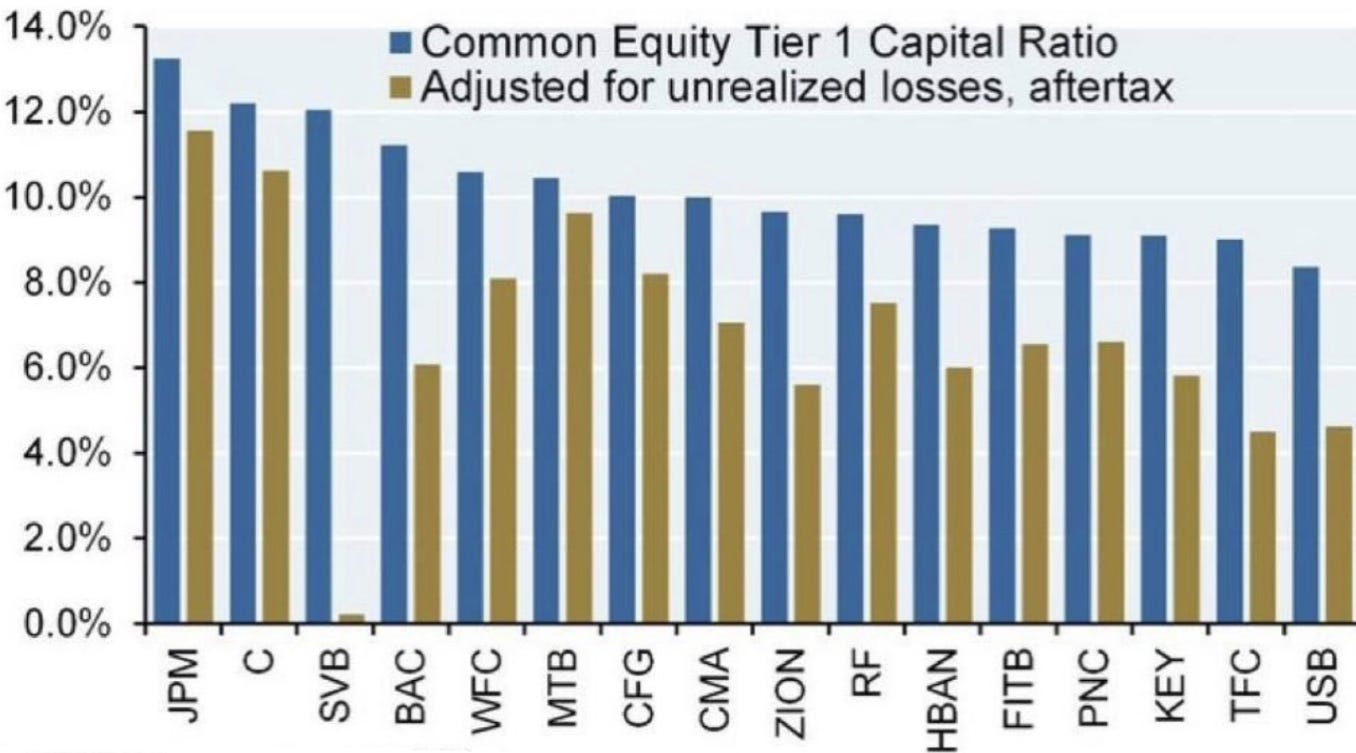
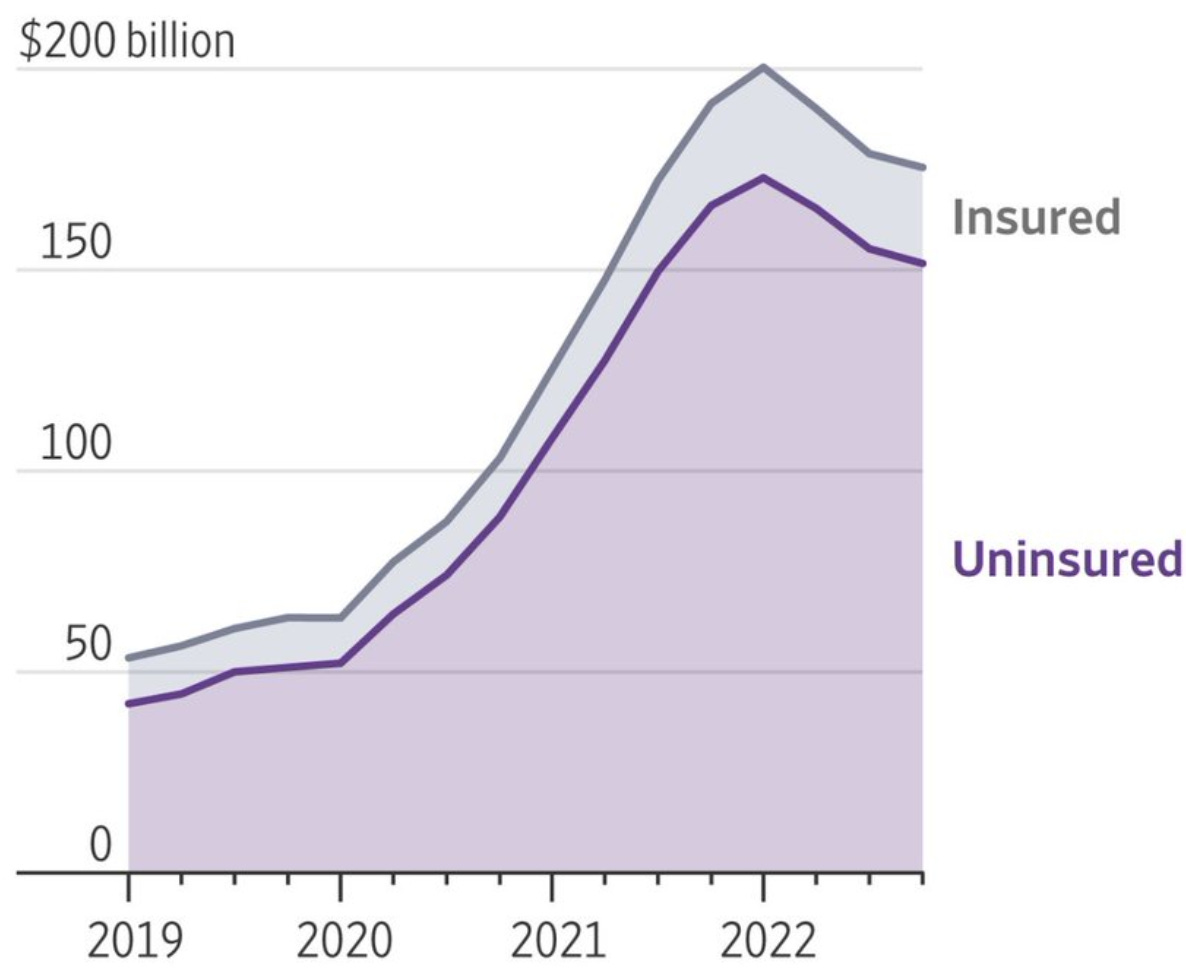
10k Words - SVB Special Equitable Investors March 2023 Almost half of the US VC universe banked with Silicon Valley Bank (SVB) and the bank was upfront in disclosing that "client cash burn remains ~2x higher than pre-2021 levels and has not adjusted to the slower fundraising environment". It also wasn't a secret that SVB held long duration debt investments that it had not marked-to-market. If it had its capital adequacy would have been brought into question immediately. SVB is unique in terms of its narrow base of clients - the vast majority of its deposits are not covered by the FDIC's $US250,000 insurance per depositor. Figure 1: SVB's market position
Source: SVB Figure 2: SVB's QoQ period-end total client funds (TCF) by client activity in $US billions
Source: SVB Figure 3: Impact of unrealised securities losses on capital ratios - Q4 2022
Source: JP Morgan Asset Management, @TheRealDanSaedi Figure 4: SVB's deposit mix - insured and uninsured
Source: Federal Financial Institutions Examination Council, WSJ Funds operated by this manager: Equitable Investors Dragonfly Fund Disclaimer Nothing in this blog constitutes investment advice - or advice in any other field. Neither the information, commentary or any opinion contained in this blog constitutes a solicitation or offer by Equitable Investors Pty Ltd (Equitable Investors) or its affiliates to buy or sell any securities or other financial instruments. Nor shall any such security be offered or sold to any person in any jurisdiction in which such offer, solicitation, purchase, or sale would be unlawful under the securities laws of such jurisdiction. The content of this blog should not be relied upon in making investment decisions. Any decisions based on information contained on this blog are the sole responsibility of the visitor. In exchange for using this blog, the visitor agree to indemnify Equitable Investors and hold Equitable Investors, its officers, directors, employees, affiliates, agents, licensors and suppliers harmless against any and all claims, losses, liability, costs and expenses (including but not limited to legal fees) arising from your use of this blog, from your violation of these Terms or from any decisions that the visitor makes based on such information. This blog is for information purposes only and is not intended to be relied upon as a forecast, research or investment advice. The information on this blog does not constitute a recommendation, offer or solicitation to buy or sell any securities or to adopt any investment strategy. Although this material is based upon information that Equitable Investors considers reliable and endeavours to keep current, Equitable Investors does not assure that this material is accurate, current or complete, and it should not be relied upon as such. Any opinions expressed on this blog may change as subsequent conditions vary. Equitable Investors does not warrant, either expressly or implied, the accuracy or completeness of the information, text, graphics, links or other items contained on this blog and does not warrant that the functions contained in this blog will be uninterrupted or error-free, that defects will be corrected, or that the blog will be free of viruses or other harmful components. Equitable Investors expressly disclaims all liability for errors and omissions in the materials on this blog and for the use or interpretation by others of information contained on the blog |

31 Mar 2023 - Hedge Clippings | 31 March 2023
|
|
|
|
Hedge Clippings | 31 March 2023 Good news on the inflation front! This week we saw Australia's CPI decline for the second month in a row to an annualised rate of 6.8%, down from 7.4% in January, and from 8.4% in December last year. One would imagine it's too early to expect the RBA to cut rates at their meeting next Tuesday, but it does bring about the possibility of a "pause", and no doubt a collective sigh of relief from homeowners, and probably RBA Governor Philip Lowe as well. However, as the saying goes, "one swallow doth not a spring make", and while it looks as if overall inflation may have peaked, there's a risk that wages-linked inflation has yet to impact the full CPI numbers. Casting our minds back a year or two, inflation seemed dead in the water - in fact, the RBA was concerned about disinflation, which of course was one of the reasons Lowe and the RBA were caught unprepared, in line with virtually every other banker and economist in the world (outside Argentina, where inflation hit 102.5% in February). Two events coincided - the sudden invasion of Ukraine forcing up energy prices, and the widespread easing of COVID restrictions, at the same time as China closed or locked down, creating a supply chain driven jump in the price of imported goods. That was followed by more general price increases of goods and services, some of which might have been opportunistic, after a long period of stability and margin compression. What is yet to come is inflationary pressure as a result of wages, with the RBA's estimate of wages growth of 4.2% year on year likely to be exceeded given the ACTU are pushing for increases in line with inflation, and East to West labor governments are more likely to agree or give in to them. If that's the reality, then the RBA's core inflation target of 2.9% by mid 2025 - or hope that the inflation genie is back in the bottle at 2-3% - is looking optimistic at best. Our (uneducated) guess is that 2-3% inflation may be a long way off, if ever. Maybe the low inflation, QE induced post GFC era was a one-off - and apart from the low inflation, in some ways, we hope that's the case. For a more educated analysis this piece of research from the nab - although over a month out of date, argues the case in more detail than we can. So all eyes will be on the RBA's announcement at 2.30 next Tuesday afternoon. We expect a welcome pause, but any reduction to be way off in the distance. Meanwhile, it was good to see Teal MP for Wentworth, Allegra Spender hosting a round table of experts - including Ken Henry - to shake up Australia's taxation system. As the discussion was only being held today in Canberra it's too early to comment on the outcome, but hopefully it puts some pressure on both major parties to take the subject of real tax reform (and not just tinkering with super balances affecting 0.5% of the population) out of the too hard basket, and into the action tray, as detailed in Hedge Clippings on March 10th. Australia and Australians are being held back by an overly complicated, inefficient tax system that governments of both persuasions have contributed to, and don't have the political will to fix. Maybe the independents will force them to get on with some real reform. |
|
|
News & Insights Market Update February | Australian Secure Capital Fund Investment Perspectives: Is the Aussie residential market bottoming? | Quay Global Investors February 2023 Performance News Insync Global Quality Equity Fund Bennelong Long Short Equity Fund Equitable Investors Dragonfly Fund |
|
|
If you'd like to receive Hedge Clippings direct to your inbox each Friday
|

31 Mar 2023 - Performance Report: Altor AltFi Income Fund
[Current Manager Report if available]

31 Mar 2023 - Why the Silicon Valley Bank collapse happened and what it means for investors
|
Why the Silicon Valley Bank collapse happened and what it means for investors Pendal March 2023 |
|
COCKROACH theory refers to the belief that problems affecting one company may indicate similar problems with other similar companies. After the collapse of California's Silicon Valley Bank (SVB), the market and the media are on the lookout for more cockroaches. The good news is that SVB was an unusual cockroach. The bad news is that other creepy crawlies lie in wait. Two main issues led to SVB's fall. The first was an unusual decision not to hedge interest rate exposure or mismatch between its assets (long-dated fixed income instruments) and liabilities (deposits). Most banks face this mismatch. Few would leave it unhedged. Bloomberg's US Treasury index returned -12.3% in 2022. This gives an indication of the mark-to-market damage that would have hit SVB's long-dated fixed income assets. The second factor was the concentration risk in its customer base. The Silicon Valley tech sector formed almost the entirety of the bank's borrower and depositor base. Ultra-low interest rates going into and coming out of the pandemic were a huge boon to this sector. At the time, money was virtually free and poured into high-growth sectors hungry for returns. But by the end of 2022 - after 425 basis points of interest rate hikes - that was no longer the case. Higher discount rates needed to be applied to potentially speculative future earnings in the sector. All at once, SVB found its customers calling on their deposits. The need to satisfy these liquidity demands caused SVB to start realising some of those steep mark-to-market losses in their assets. SVB is the 16th largest lender in America, but its $200 billion of assets still sat below the $250 billion threshold at which banks need to report unrealised losses. This helped hide the stress before a classic run on deposits in early March. Are there more cockroaches?There could be other lending institutions with similar red flags, but the bank's problems were largely self-made. Many regional US banks go under every year. Most often, it is due to the poor quality of their loan books. Not because of poor risk management. That is perhaps the most heartening takeaway from the SVB crisis. Unfortunately, other risks have been uncovered by the bank's collapse. Here are the main lessons: 1. Easy money a thing of the pastThe first is that easy money is a thing of the past. The SVB crisis reminds us that the promise-heavy tech sector needs much more diligence now that money-good T-bills pay between 4.5% and 5%. Similarly, in Australia cash and near-cash investments yield 4% or more. This naturally pushes up the bar for going further out along the risk curve and down the liquidity ladder. When money was virtually free, illiquid and opaque investments such as private debt and equity seemed attractive. Just as had been the case with SVB until now, unrealised losses within these investments have yet to come to light. That flood of money is reversing. 2. Hurdles for mortgage-backed securitiesA second risk is highlighted by the mortgage-backed securities (MBS) losses on SVB's asset portfolio. Mortgage-backed securities allow investors to own part of a bundle of home loans that have been packaged together. Interest rates were not the only blame factor here. So was the quality of the underlying assets. Like clockwork, a global synchronised housing downturn is following the synchronised global rate hiking cycle. Australian credit portfolios heavily invested in illiquid residential mortgage-backed securities (RMBS) face significant hurdles this year. The value of RMBS portfolios will be affected by the house price correction we're already experiencing, as well as payment delays from stressed borrowers. In addition, the RMBS issued by non-major banks are of poorer quality, leading to more accidents waiting to happen. As Pendal's senior credit analyst, Terry Yuan, says: "Set-and-forget credit portfolios often rely on the AAA rating of RMBS to raise the average portfolio rating of their holdings, giving them more room to veer into the low-BBB space. "Both ends of the ratings spectrum will experience a lack of liquidity should something go wrong". That is not what true fixed income is supposed to feel like for the end investor. 3. The information factorThe third risk unveiled by the SVB crisis is that of information. Unlike the GFC, and thanks to technology, rumours can become truths in the space of a few tweets. The reality is that SVB depositors are likely to be made whole. The shame is they could have got there without going through this mess first. Faced with panic, with fear spreading like wildfire, it was individually rational to "sell first and ask questions later". This will happen to other institutions as well, leaving the biggest and safest of lending institutions to benefit from the fall-out. What we can learn from SVBSVB's failure reinforces our investment views for 2023. We thought this year's set-up for bonds looked good even before this most recent crisis surfaced. The trend of cooling inflation will continue to play through. The SVB collapse highlights the need to hold a true-to-label fixed income allocation in your portfolios - if only for insurance. Over the past week, 10-year Commonwealth government bonds rose in value by more than 2.25%. Portfolios exposed to that move would have felt cushioned against a 2.5% hit to Australian equities over the same period. Our patience on credit should be rewarded. Since the third quarter of 2021, we have held a defensive stance in our credit and income portfolios, favouring quality and liquidity over stretching for that extra bit of yield or spread. We have also been long-time abstainers from RMBS. Their valuations did not reward us when money was near-free, and the illiquidity they face does not make them attractive now that cash rates are approaching 4% in Australia. Floating rate senior unsecured paper from our major banks, on the other hand, are a safe place to bias our credit allocations towards. Author: Amy Xie Patrick, Head of Income Strategies |
|
Funds operated by this manager: Pendal Focus Australian Share Fund, Pendal Global Select Fund - Class R, Pendal Horizon Sustainable Australian Share Fund, Pendal MicroCap Opportunities Fund, Pendal Sustainable Australian Fixed Interest Fund - Class R, Regnan Global Equity Impact Solutions Fund - Class R, Regnan Credit Impact Trust Fund |
|
This information has been prepared by Pendal Fund Services Limited (PFSL) ABN 13 161 249 332, AFSL No 431426 and is current as at December 8, 2021. PFSL is the responsible entity and issuer of units in the Pendal Multi-Asset Target Return Fund (Fund) ARSN: 623 987 968. A product disclosure statement (PDS) is available for the Fund and can be obtained by calling 1300 346 821 or visiting www.pendalgroup.com. The Target Market Determination (TMD) for the Fund is available at www.pendalgroup.com/ddo. You should obtain and consider the PDS and the TMD before deciding whether to acquire, continue to hold or dispose of units in the Fund. An investment in the Fund or any of the funds referred to in this web page is subject to investment risk, including possible delays in repayment of withdrawal proceeds and loss of income and principal invested. This information is for general purposes only, should not be considered as a comprehensive statement on any matter and should not be relied upon as such. It has been prepared without taking into account any recipient's personal objectives, financial situation or needs. Because of this, recipients should, before acting on this information, consider its appropriateness having regard to their individual objectives, financial situation and needs. This information is not to be regarded as a securities recommendation. The information may contain material provided by third parties, is given in good faith and has been derived from sources believed to be accurate as at its issue date. While such material is published with necessary permission, and while all reasonable care has been taken to ensure that the information is complete and correct, to the maximum extent permitted by law neither PFSL nor any company in the Pendal group accepts any responsibility or liability for the accuracy or completeness of this information. Performance figures are calculated in accordance with the Financial Services Council (FSC) standards. Performance data (post-fee) assumes reinvestment of distributions and is calculated using exit prices, net of management costs. Performance data (pre-fee) is calculated by adding back management costs to the post-fee performance. Past performance is not a reliable indicator of future performance. Any projections are predictive only and should not be relied upon when making an investment decision or recommendation. Whilst we have used every effort to ensure that the assumptions on which the projections are based are reasonable, the projections may be based on incorrect assumptions or may not take into account known or unknown risks and uncertainties. The actual results may differ materially from these projections. For more information, please call Customer Relations on 1300 346 821 8am to 6pm (Sydney time) or visit our website www.pendalgroup.com |

30 Mar 2023 - Performance Report: Glenmore Australian Equities Fund
[Current Manager Report if available]
30 Mar 2023 - Performance Report: Equitable Investors Dragonfly Fund
[Current Manager Report if available]

30 Mar 2023 - Today's surgical robot, tomorrow's robot surgeon
|
Today's surgical robot, tomorrow's robot surgeon Nikko Asset Management March 2023 Robotic surgery: from science fiction to reality In his 1976 novelette "The Bicentennial Man", the late science fiction writer and visionary Isaac Asimov kicked off the opening plot with the main character Andrew Martin (a humanoid who wants to live and die like a human) requesting a robot surgeon to perform an intricate operation on him so that he will not live beyond the age of 200. "The fingers were long and were shaped into artistically metallic, looping curves so graceful and appropriate that one could imagine a scalpel fitting them and becoming, temporarily, one piece with them. There would be no hesitation in his work, no stumbling, no quivering, no mistakes", wrote Asimov as he described the robot surgeon who altered Martin's positronic brain. Asimov's foretelling vision of surgeries performed autonomously by robots could in fact become a reality in the near future with the rapid advancement of robotic surgery, which is considered to be one of the greatest modern-day medical breakthroughs. Evidently, autonomous robotic surgery has already been initiated on animals, although it has yet to be done on humans. In a ground-breaking experiment in April 2019, bioengineers at the Boston Children's Hospital successfully deployed a self-driving robot which navigated autonomously along the walls of a throbbing, blood-filled heart to repair a leaky cardiac valve of a pig, all without a surgeon's guidance. Undeniably, robotic surgery is transforming the field of surgery and paving the way for a new era of precision medicine. Today's robotic surgery takes the form of a minimally invasive procedure that utilises cutting-edge robotic systems controlled by a surgeon to perform surgical procedures with great precision, control and vision, especially when operating in the very hard-to-reach areas. Unlike the popular science fiction depiction of a shiny, metallic and humanlike robot surgeon, the surgical robot of today is a more humdrum-looking compartmentalised system, which allows a (human) surgeon to control movements of multiple robotic arms—usually four—and cameras that provide 3-D stereoscopic vision via a hand-controlled console when operating on a patient. A typical robotic surgical system comprises a surgeon console with the high-resolution viewer to provide 3D vision; a patient-side cart that consists of manipulators or robotic arms; and a control system with a vision cart that can incorporate additional imaging technology that augments the surgeon's view of the anatomy. With all things revolutionary, robotic surgery—in recent years—has indeed become the buzzword in the medical arena and is increasingly popular with technology-embracing healthcare institutions, as it offers many advantages over traditional surgical techniques. Benefits and drawbacks A main advantage of robotic surgery is its distinct precision. Hand dexterity tends to decline with age, and as surgeons grow older, hand tremors can impede surgical procedure. With traditional surgery, a surgeon's shaky or unsteady hand can lead to slipups or accidental damage to surrounding tissues, leading to excessive blood loss and complications. However, with robotic surgery, the nimble robotic arms that are controlled by the surgeon can move in a smooth and steady manner, allowing for greater accuracy during surgery. In this aspect, robotic surgery has proven to be particularly useful for complex surgeries, as the thin robotic arms (instead of the bulky hands of a surgeon) are capable of making precise movements in tight spaces, enabling surgeons to perform procedures that may be difficult or impossible with traditional surgical techniques. The second benefit of robotic surgery is its minimally invasive nature. In traditional surgery, large incisions are made in the patient's body to access the surgical spots, and such procedures often result in considerable pain, scarring and a longer recovery time for patients. Robotic surgery, on the other hand, deploys mechanical arms, which are inserted into the patient's body through small incisions, allowing for a lesser invasive procedure. An example of minimally invasive surgery (MIS) is keyhole surgery or laparoscopy, which is a procedure that allows the surgeon to access the organs inside of the abdomen and pelvis without having to make a very large incision. Still, conventional laparoscopy, which makes small cuts and uses long, cumbersome tools and a camera to perform surgery, has its limitations. For instance, conventional handheld laparoscopic tools that enter the body through small incisions have a restricted range of motion and can be challenging to manoeuvre (given the difficulty to extend leverage) even for a seasoned surgeon. That is why robot-assisted laparoscopy techniques are increasingly employed by surgeons to overcome the difficulties faced in conventional keyhole surgeries. The increased precision and minimally invasive nature of robotic surgery over traditional open surgery tends to lead to better surgical outcomes, such as reduced trauma and incision-related complications, faster recovery time for patients, less pain and reduced hospital stay and improved cosmetic results (smaller scars). What is more, a robotic surgery can be carried out remotely by the surgeon away from the operating site of the patient. This is unlike traditional open surgery or a conventional MIS, where the surgeon has to be on-site to perform the operation. In fact, robotic applications to surgery started in 1970s when NASA initiated military projects to provide medical care remotely to astronauts and soldiers on the battlefield. Interestingly, in June 2022, a laparoscopic surgical robot developed by a Shanghai-based medtech company successfully completed two ultra-long-range robotic surgeries in urology through 5G connection between a hospital in Xinjiang and another in Jiangsu Province in China. These two hospitals were nearly 5,000 kilometres apart, making the surgical operations the longest 5G remote robotic surgeries in the world to date. Notwithstanding the many advantages of robotic surgery, there are also some drawbacks to such a progressive surgical procedure, notably the higher costs associated with it. Robotic surgical systems are generally expensive to buy, maintain, and operate, meaning that not all hospitals can afford to adopt this technology. Although operating overheads have come down in recent years, robotic surgeries are still relatively more expensive than traditional ones, making it inaccessible for patients who cannot afford it. Additionally, the use of robots in surgery raises bioethical questions about the role of technology in healthcare and the potential for robots to completely replace human surgeons. With increasing dependence on surgical robots, will humans lose surgical skills? How far do we want to go with surgical robots? Would patients be willing to entrust their lives into the hands of a sentient robot and trust that it can be programmed to handle issues of life and death from a moral perspective? The other potential drawback of robotic surgery is the additional learning curve for surgeons. As with any new technology, there is a learning curve associated with using robotic surgery systems. Surgeons must undergo extensive training and practice before they can become proficient in using the technology. Strong growth of the global surgical robot market Nonetheless, robotic surgery has the potential to take off in a big way in the years to come. US business consulting firm Frost & Sullivan (F&S) is forecasting the global surgical robot market to grow at a compounded annual growth rate (CAGR) of 21% from 2021 to 2030; F&S also predicts the market's size to exceed USD 60 billion by 2030 from nearly USD 11 billion in 2021 (see Chart 1). Chart 1: Global surgical robot market expected to exceed USD 60 billion by 2030
The COVID-19 pandemic in 2020 and 2021 had a significant impact on surgeries, resulting in a drop in worldwide surgical procedures, as many hospitals had to delay non-emergency operations and treatments to ensure adequate care was provided to COVID-19 patients. At the same time, due to restrictions implemented in many countries in 2020 and 2021, many patients had to put off routine, non-emergency diagnostic procedures, such as colonoscopies and PSA testing (a key biomarker for prostate cancer). But as global COVID-19 infections wane and normalcy returns, we have seen a speedy return in patient traffic back to pre-pandemic levels and a sharp recovery in usage of robotic surgical systems, where growth has already picked up from the second half of 2021 and throughout 2022. Presently, robotic surgery has numerous applications in the global medical field. The laparoscopic robotic system is the most commonly used programme worldwide, followed by the orthopaedic robotic system. In the US, an increasing number of prostatectomy procedures are done by surgical robots, in which robotic arms are used to remove the prostate gland (or part of it) in men with prostate cancer. Robotic surgery has also been used in gynaecological procedures, given its greater precision and less invasive techniques. According to F&S, the US and EU currently lead the global surgical robot market with an estimated market share of 55% and 21%, respectively (as at end 2020), while China, which is fast growing, still makes up only 5% of the global surgical robot market (see Chart 2). The growth of China's surgical robot market, however, is likely to be faster than that of the Western nations, in our view. Chart 2: The US and EU dominate the global surgical robot market
China could be the next growth frontier China has already made rapid progress in robotic surgery over the years. The country's first robotic surgery system was introduced in the mid-2000s, and since then, the technology has advanced by leaps and bounds. Several Chinese surgical robotic companies have developed their own state-of-the-art robotic systems which have been used in a variety of laparoscopic and orthopaedic surgeries. Furthermore, China is investing heavily in the development of artificial intelligence (AI) and 5G technologies, which are expected to drive further advancements in robotic surgery. In our view, China is poised to be one of the fastest growing surgical robot markets over the next decade, owing to growing awareness of the benefits of robotic surgeries, a rise in patients' and surgeons' acceptance rate of such procedures and supportive government policies. As benefits of robotic surgery become more widespread in China, the rate of adoption of such procedure is set to rise in the technology-embracing nation, which is already making plans to accelerate the integration of information technology (IT) into its medical equipment industry by 2025. China's 14th Five-Year Plan, which was drafted in October 2020, introduced a slew of new policy directives and top-down initiatives for 2021 to 2025. Under the country's five-year development plan for its medical equipment sector, the Chinese authorities intend to speed up the assimilation of IT and robotics into medical devices by 2025, with the creation of more domestically produced medical robots and digital health platforms. Recent policies announced by China have been supportive of robotic surgeries in general. In 2021, the Chinese authorities approved an increase in the installation quota of laparoscopic surgical robots from 154 to 225. (Hospitals in China are allocated quotas to purchase and complete the tenders of surgical robots.) To alleviate the financial burden for patients, Shanghai and Beijing also widened the government-backed basic medical insurance coverage in 2021 to include laparoscopic and orthopaedic robotic surgeries, thereby enabling the scheme to partially cover the cost of these procedures. Moreover, in July 2022, China exempted innovative drugs and devices, including surgical robotic systems, from its diagnosis-related group (DRG) hospital payments system, which is being piloted in several cities. The DRG is a system used to classify various diagnoses for inpatient hospital stays into groups and subgroups so that national payors or private health insurance companies can better control hospital costs and determine reimbursement rates. The DRG exemption offers a favourable backdrop for wider application of robotic surgery as hospitals and surgeons will now have the flexibility to perform robot-assisted operations. We believe that China's public hospitals—following the directives of the country's central government—will likely implement more robot-assisted surgical procedures. Presently, China has around 1,500 Class 3A-rated hospitals, which are considered to be the best medical institutions with the highest level of medical technology, equipment, quality and service provision. The increased adoption of robotic surgeries in these high-quality hospitals, on the back of the government-led initiatives, may spur growth for both international and domestic surgical robotic manufacturers operating in the world's most populous nation. The rise of China's surgical robots The competitive pricing and localised strategies of up-and-coming surgical robot manufacturers in China to drive product penetration in the world's second largest economy are starting to have an impact on their global, more dominant rivals, such as US robotic surgical system manufacturer Intuitive Surgical Inc. Intuitive Surgical, the leading player in the global surgical robot market, was established in 1995 and is listed on Nasdaq. Its main product, the da Vinci robotic surgical system, currently dominates the global laparoscopic robot market by holding an estimated market share of over 80%. In 2000 the da Vinci robotic surgical system became the first robot-assisted laparoscopic surgical system to be approved by the US Food and Drug Administration. Intuitive Surgical builds its success using its "System+Consumables+Services" business model, with system installations allowing it to ramp up recurring revenues over the longer term. Essentially, the company sells its robotic surgical systems to medical institutions globally, and as its installation base grows over time, the revenue contributions from consumables (namely robotic arms) and maintenance services grow as well. Intuitive Surgical entered the Chinese market in 2006. Despite operating in China for nearly 17 years, the US robotic surgical manufacturer has only achieved limited success in penetrating the Chinese robotic surgical market; as at end June 2021, less than 10% of all Class 3A hospitals in China were using the da Vinci system, according to UBS data. The competition landscape may have changed with the recent entrance of four domestic surgical robotic companies, whose products are priced 30% to 40% cheaper than the da Vinci system. More products are coming as can be evidenced in Table 1. Table 1: Globally launched surgical robots*
* - This is not an exhaustive table and only representative companies are included. The table also includes representative companies in China with robots in clinical trials. In our view, the progressive and competitive Chinese surgical robot manufacturers have the potential to rapidly grow their market share not only in China but in the rest of the world, especially in emerging markets. As shown in Chart 2, the surgical robot market outside of the US, the EU and China remains highly under-penetrated. The future of robotic surgery The future of robotic surgery looks exciting. With a notable reduction in human error as robotic surgeries gain acceptance and become more widely adopted, many experts believe that going under the knife via a highly precise and less invasive procedure, with surgeons assisted by robots, will become the norm for more types of surgeries in the coming decades. Moreover, robotic surgery technology is expected to continue improving and its integration of AI could enable machines to make better and more accurate decisions, leading to safer and more efficient surgeries. With the help of high-speed internet, such as 5G, and advanced communication technologies, robotic surgery may also enable doctors to carry out surgeries remotely from anywhere in the globe or even in space. As with any innovative technology, the costs are likely to come down over time as more competitors enter the fray, breaking the monopoly enjoyed by Intuitive Surgical over more than two decades, to meet the demand of the mid-range value-for-money patient segment. Over time, as robotic surgery becomes more widely accepted around the world, it is likely that economies of scale will set in, driving costs down even further, making it more accessible to patients and healthcare providers. With the advent of autonomous robotic surgery, which will be made possible with advanced sensors, machine learning algorithms, and AI, the notion of today's surgical robots becoming tomorrow's robot surgeons could indeed come true in the not-too-distant future, just as Asimov envisioned in his science fiction novels. The question we need to answer is: Will the Three Laws of Robotics1 envisioned by Asimov be sufficient to protect humans from robots? Author: Kathy Ng, Senior Equity Analyst Funds operated by this manager: Nikko AM ARK Global Disruptive Innovation Fund, Nikko AM Global Share Fund, Nikko AM New Asia Fund, Important disclaimer information References to any particular security is purely for illustration purpose only and does not constitute a recommendation to buy, sell or hold any security or to be relied upon as financial advice in any way. 1 The following are Asimov's Three Laws:
|
 Source: Frost & Sullivan
 Source: Frost & Sullivan, as at end 2020
 Source: FDA, MHRA, NMPA, EMA, companies' data and UBS, as at November 2022
29 Mar 2023 - Performance Report: Bennelong Long Short Equity Fund
[Current Manager Report if available]