
NEWS

11 May 2023 - What to do about Stock Based Compensation?
|
What to do about Stock Based Compensation? Eiger Capital April 2023 |
|
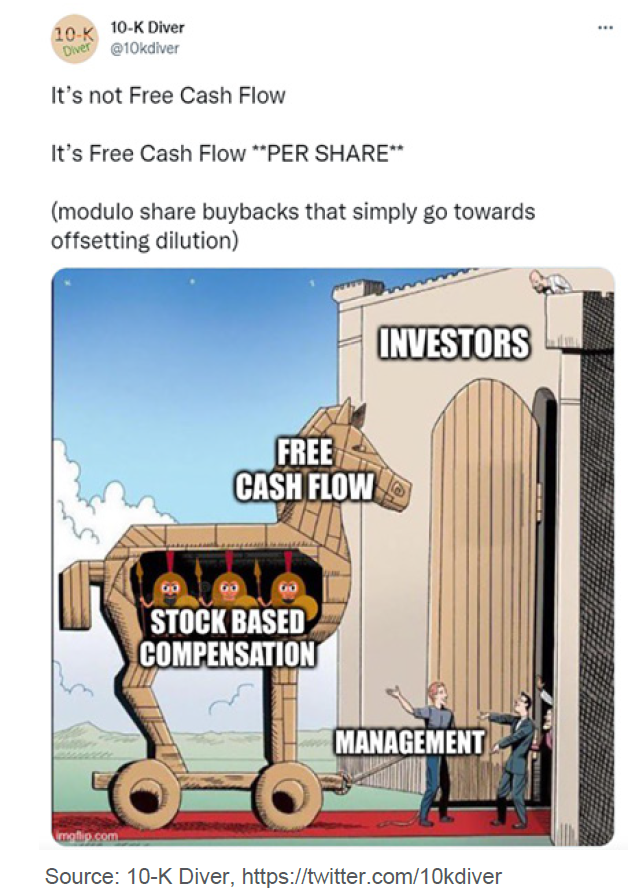
The tech sector sell-off that began in early 2022 has seen a renewed investor focus on 'disciplined growth'. We think this is investor code for a shift to positive operating free cashflows and the end of equity market funding of operating losses. Lossmaking tech is now on the nose. The equity market sell-off has also led to greater scepticism at the increasing use of alternative corporate earnings measures such as 'underlying' profits. These are often presented by companies that want to adjust (i.e. increase) statutory reported earnings for 'one-offs' and 'non-cash' items. A common adjustment of concern for investors, especially popular with companies in the tech sector is the issue of SBC. Companies are able to report higher underlying earnings (or more to the point reducing underlying losses) by using the justification that SBC is a 'non-cash' item and thus should be added back to statutory earnings. We are unconvinced with this argument as we reason below. SBC is a real cost of employment and thus should be accounted for in reported statutory earnings. Let's start with a "101" on SBC - what is it?SBC is quite simply an alternate form of compensation paid to company employees, often as a substitute for a cash salary. There are two main types. SBC is equity in the business that employees work for and is most typically issued either in the form of employee stock options or otherwise as restricted stock units (RSUs). It is common for both types of SBC to vest over a specified time period and often subject to some conditions (most commonly just tenure at the company). SBC is not a new innovation. It has been around in the US for more than 70 years. Although employee stock options did exist in the US pre-WW2 their unfavourable tax treatment meant they were little used. Very few executives had executive stock options prior to 19501. Then shortly after the war their issuance started to rise quickly with the introduction of the 1950 Revenue Act. This new law allowed for lower capital gains tax treatment on the sale of executive options. As a consequence, executive stock option issuance jumped to around 18% of top US executives remuneration, just one year later. Nevertheless, stock options remained mostly restricted to top company executives until the early 1960's. Late that decade Robert Noyce and Gordon Moore (of "Moore's law fame), two of the original founders of Fairchild Semiconductor (the inventor of the silicon chip) established a new company called Integrated Electronics. This company was later renamed Intel and was one of the first companies to use employee stock options more broadly as a tool to incentivise the staff of their new company. Once again, their use rapidly increased during the dot-com boom of the late 1990's. This popularity was again sunk by dotcom bust of 2001. Many recipients of SBC found themselves on the hook for large tax bills despite the value of their options now being mostly worthless. More recently, SBC has again blossomed with the FANG led tech bull market of the late 2010's / early 2020's. High inflation and the end of zero interest rates globally from mid 2022 has led to a tech industry selloff that has again put SBC back onto investors' radars. Why do companies issue SBC?SBC is most commonly issued to staff by early stage 'startup' tech businesses for a number of reasons.
What are the problems with SBC?There are a number of concerns for investors arising out of the payment of SBC and not just the issue of the cost of SBC not being appropriately reflected in earnings.
A recent Barrons3 article highlighted the now more common practice of many large companies in the tech industry. More of them are using SBC for a greater proportion of their total employee compensation. As revenue growth rates have slowed and correspondingly tech valuations have dived, this practice is increasing the anxiety of many investors who consternate at the growing ownership dilution of their business. The article points out that average stock-based compensation for the US tech industry rose from just 4.2% of revenue in 2012 to 10.5% in 2020, and then more than doubling a year later to 22.5% in 2021. At these levels SBC has moved well away from its tech industry origins as a tool to align and motivate small teams in early-stage businesses. Instead it is now "part of the culture and the expectation from software company employees"… with the consequence being that… "an increasing amount of shareholder value (is) being transferred to employees and away from investors, as companies dole out more stock at lower prices". Perhaps the most egregious recent example of the above practice has been pandemic beneficiary Zoom. SBC became very entrenched as part of employee expectations during the good times when the share price ran up from US$70 in Dec 2019 to a peak of almost US$600 (+760%) less than a year later in Oct 2020. However rolling forward to late 2022 with the share price back at US$70 (-88%), employees who unlike shareholders need to be compensated for the lower share price, requiring the company to issue significantly more SBC than when its share price was US$600. 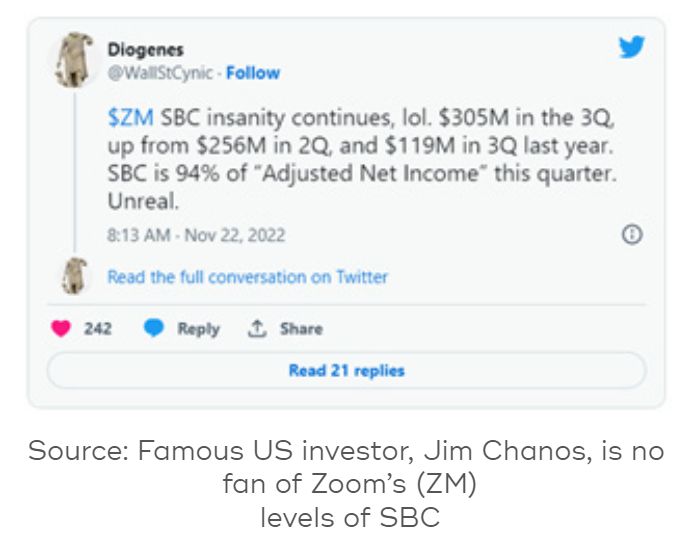 According to Kelly Steckelberg, Zoom's CFO, this was done to ensure workers were not "feeling that they're being undervalued"4. Unfortunately this resulted in very large levels of dilution for suffering shareholders, who's feelings were apparently less important to the CFO. The one possible fly in the ointment for employee SBC is that the rising level of tech industry layoffs is eroding the current culture of expectation. If tough times continue then tech sector remuneration will undoubtedly come under more pressure. The consequences will not only be lower levels of SBC but also possibly lower levels of total absolute compensation, although evidence of the latter is yet to be seen. 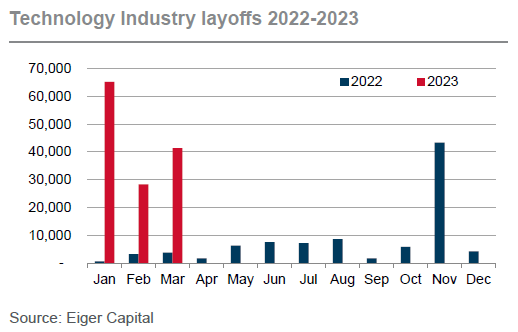 Not all of the tech industry has been exploiting SBC-adjusted underlying earnings. Some of the larger profitable tech companies such as Alphabet (Google)5 and Meta (Facebook)6 have long since moved away from an 'underlying' earnings measure that excludes SBC. They recognise that it is indeed a true cost of attracting and retaining staff and account for it as a proper expense. Unfortunately many other large but still unprofitable tech companies continue to rely on SBC as an 'underlying' earnings adjustment to help hide the fact that their margins are miserable on a fully costed basis. The tables and charts below show some well-known names such as Adobe and DocuSign as the biggest serial users of SBC. 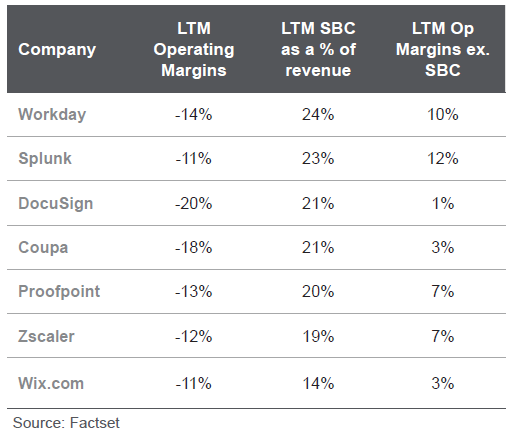 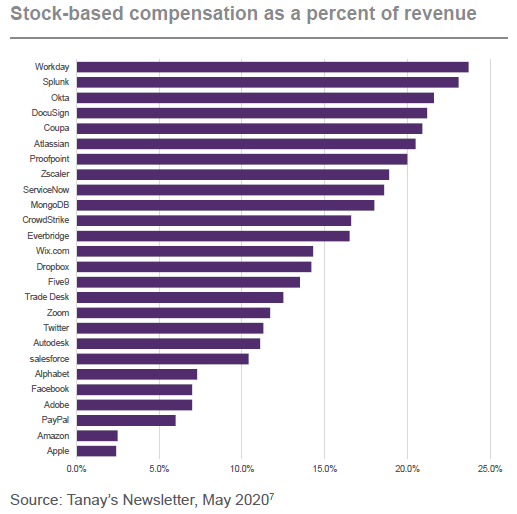 Final thoughtsWe may in the not-too-distant future see SBC returning to its origins of tech start-up land. It is here where the cost of equity dilution to investors is more than offset by the 'blue sky' value creation potential that a highly motivated and well-aligned small tech team can deliver. Author: Victor Gomes, Principal and Portfolio Manager |
|
Funds operated by this manager: Eiger Capital Australian Small Companies Fund 1 https://secfi.com/learn/history-of-employee-stock-options This material has been prepared by Eiger Capital Pty Ltd ABN 72 631 838 607 AFSL 516 751 (Eiger). It is general information only and is not intended to provide you with financial advice or take into account your objectives, financial situation or needs. To the extent permitted by law, no liability is accepted for any loss or damage as a result of any reliance on this information. Any projections are based on assumptions which we believe are reasonable, but are subject to change and should not be relied upon. Past performance is not a reliable indicator of future performance. Neither any particular rate of return nor capital invested are guaranteed. |

10 May 2023 - Performance Report: Quay Global Real Estate Fund (Unhedged)
[Current Manager Report if available]

10 May 2023 - The Rate Debate - Ep37 - Did the RBA fuel the fire or douse the flames?
|
The Rate Debate - Ep37 - Did the RBA fuel the fire or douse the flames? Yarra Capital Management April 2023 Despite the RBA's massive rate "U-turn" and their insistence that we are in the final stage of the hiking cycle, has it come too late to stop a recession? Chris Rands and Darren Langer examine the factors influencing the market and reveal their expectations of the economy and the Australian credit market in episode 37 of The Rate Debate. |
|
Funds operated by this manager: Yarra Australian Equities Fund, Yarra Emerging Leaders Fund, Yarra Enhanced Income Fund, Yarra Income Plus Fund |

9 May 2023 - Performance Report: Bennelong Kardinia Absolute Return Fund
[Current Manager Report if available]

9 May 2023 - Performance Report: 4D Global Infrastructure Fund (Unhedged)
[Current Manager Report if available]

9 May 2023 - A once in a generation opportunity
|
A once in a generation opportunity Insync Fund Managers April 2023
A revolution in global consumption is occurring. Imagine a world where the centre of economic gravity shifts away from Europe & North America. This presents a staggering $10 trillion consumption growth opportunity over the next decade. This global megatrend has reached a critical tipping point. The rapid expansion of middle-income sectors across developing countries, particularly in Asia, is reshaping the global economy.
Not Just a China Story Whilst China's middle-class growth is well-known, it is less recognized that of the 1 billion Asians joining the middle class by 2030, 380 million will come from India, the largest contributor to this increase. India's consumer market is set to triple to $6 trillion by 2030, making it one of the biggest consumption stories. India's consumer class is characterized by a young, geographically dispersed population. It offers significant potential for growth in consumer spending. In contrast, China's consumer class is older and aging, although more affluent, and is concentrated in cities. Smaller nations in Asia are still juggernauts when compared to say, Australia. Indonesia's middle-income class is the size of Australia's entire population. Then there is Malaysia, Vietnam, and so on. Navigating the risks Investing in the emerging middle-income consumer requires smarter research and better insight than ever before. It also requires strong risk management. Simply buying a basket of offshore companies with large 'footprints' in these regions is no longer sufficient. Nor is investing directly due to the more risky and volatile nature of local stock exchanges. International brands face challenges when embracing Guochao due to potential repercussions in both Human Rights and political considerations. Nike and Adidas lost market share in China to locals such as Anta Group as a result. Guochao is especially popular amongst the 270 million Gen Z-ers. They're redefining China's consumer economy and will continue to do so throughout their life stages. This is neither new nor particularly Asian. It shares similarities to the emergence and power of the USA Baby Boomers decades earlier. The preferences and spending habits of this large rapidly growing group are therefore crucial to understand. With a higher-income middle class estimated to hold 160 million households by 2030, China remains a critical target group for consumer brands. They are driving demand for higher-quality goods and services, from healthcare and education to luxury goods and travel. Given the dangers and challenges in these markets however, how can an investor benefit without taking on undue risks?
Being focused and careful Insync's research targets only the most viably attractive companies, focused especially on the increased spending by higher-income middle-class consumers (annual disposable income is $45,000-$100,000 (PPP)). Global companies are usually better placed to then allocate capital to these economies and manage currency and political aspects from a stronger position than fund managers. Our work has determined that the number of companies benefitting from this trend that can also grow profitably going forward is fewer than what was available pre-Covid. Stock selection is key. Funds operated by this manager: Insync Global Capital Aware Fund, Insync Global Quality Equity Fund Disclaimer |


8 May 2023 - Magellan Global Fund Update
|
Magellan Global Fund Update Magellan Asset Management April 2023 |
|
Global Portfolio Managers Nikki Thomas, and Arvid Streimann, discuss the unfolding interest rate cycle and the effect it's having on market sentiment and company valuations. They provide an update on the portfolio's recent performance and its positioning for the current environment. |
|
Funds operated by this manager: Magellan Global Fund (Hedged), Magellan Global Fund (Open Class Units) ASX:MGOC, Magellan High Conviction Fund, Magellan Infrastructure Fund, Magellan Infrastructure Fund (Unhedged), MFG Core Infrastructure Fund Important Information: This material has been delivered to you by Magellan Asset Management Limited ABN 31 120 593 946 AFS Licence No. 304 301 ('Magellan') and has been prepared for general information purposes only and must not be construed as investment advice or as an investment recommendation. This material does not take into account your investment objectives, financial situation or particular needs. This material does not constitute an offer or inducement to engage in an investment activity nor does it form part of any offer documentation, offer or invitation to purchase, sell or subscribe for interests in any type of investment product or service. You should read and consider any relevant offer documentation applicable to any investment product or service and consider obtaining professional investment advice tailored to your specific circumstances before making any investment decision. A copy of the relevant PDS relating to a Magellan financial product or service may be obtained by calling +61 2 9235 4888 or by visiting www.magellangroup.com.au. Past performance is not necessarily indicative of future results and no person guarantees the future performance of any strategy, the amount or timing of any return from it, that asset allocations will be met, that it will be able to be implemented and its investment strategy or that its investment objectives will be achieved. This material may contain 'forward-looking statements'. Actual events or results or the actual performance of a Magellan financial product or service may differ materially from those reflected or contemplated in such forward-looking statements. This material may include data, research and other information from third party sources. Magellan makes no guarantee that such information is accurate, complete or timely and does not provide any warranties regarding results obtained from its use. This information is subject to change at any time and no person has any responsibility to update any of the information provided in this material. Statements contained in this material that are not historical facts are based on current expectations, estimates, projections, opinions and beliefs of Magellan. Such statements involve known and unknown risks, uncertainties and other factors, and undue reliance should not be placed thereon. Any trademarks, logos, and service marks contained herein may be the registered and unregistered trademarks of their respective owners. This material and the information contained within it may not be reproduced, or disclosed, in whole or in part, without the prior written consent of Magellan. |

5 May 2023 - Hedge Clippings | 12 May 2023
|
|
|
|
Hedge Clippings | 12 May 2023 Treasurer Jim Chalmers was understandably pleased to be able to hand down a budget forecasting a surprise surplus, but according to more than a few economists the real surprise will be whether it eventuates or not. As has been widely questioned, the risk is that the selected spending initiatives will be inflationary, leaving the RBA with no alternative but to either increase interest rates further or keep them higher for longer. Meanwhile, on the revenue side, there is still no appetite from either the government nor the opposition to fix or address the reliance on personal income tax. The opportunity has been lost for another year, as it has every year since the Henry Tax Review in 2010, and no doubt will be put in the too hard basket again next year as well. Hedge Clippings is not going to dwell on the budget too long - it is covered more than enough elsewhere. However, it was interesting, if not alarming, that a research paper out of the RBA this week estimates the chance of a recession next year at 80%. If inflation does continue at an elevated level as many believe it will, and the RBA sticks to its determination to address it, a recession, whether with a "hard" or "soft" landing, is likely to be the outcome. It's going to be a delicate balance, or as Philip Lowe describes it, a "narrow road". Turning to markets and managed funds. Market shocks, such as the '87 crash, the tech wreck of 2000, or the GFC, tend to create opportunity - particularly for the brave - after extended periods of investor exuberance, which when coupled with excessive leverage lead to stretched valuations. The past two to three years however have been different, but according to many managers we have spoken to, could be considered one of the most challenging periods in recent memory. Certainly there were stretched valuations, particularly in the tech and growth sectors, post GFC thanks to QE and central bank intervention, but little could have prepared markets for the combined effects of COVID, Russia's invasion of Ukraine, and the resultant outbreak of global inflation. The small cap sector always takes the brunt when investors switch from risk on to risk off - having paved the way and outperformed in the first place. Over the year to December 2022, the average performance of the 86 funds which make up the Australian Mid and Small Cap Peer Group fell by 19% compared with the Australian Large Cap Peer Group, which fell on average only 4%. By contrast they topped the performance tables three years before. This cycle is not unusual given the lack of liquidity often accompanying stocks outside the ASX200 (and sometimes within it) but there's little doubt that as a result the lack of interest, or appetite for risk accentuates the losses, and in turn creates opportunity. The key of course comes in the timing, so earlier this week we hosted a webinar discussion with three "small cap" fund managers, namely Dean Fergie from Cyan Investment Management, Steven Johnson from Forager Funds Management, and Gary Rollo from Montgomery Investment Management, to ask them the sometimes difficult question about their experiences over the past two years or so, but more importantly, if the worst of the current market was behind them? You can watch a recording of the discussion below, but there were some key take-aways from each of them. None of them shied away from the difficult questions but were all consistent in their view that trying to time the bottom or turning point in the market was an impossible exercise. Each gave examples of oversold companies or markets, and each reiterated that holding profitable, successful businesses, with strong balance sheets (sometimes trading at or below asset, or even cash backing) will provide outsized future returns, rather than selling them at current depressed valuations. Of interest is the fact that while the small cap sector has still underperformed the ASX200 in the six months to the end of April (+3.83% to +8.71%) at least it is positive, while over the past three months while marginally negative, the small cap peer group has just outperformed (-0.70% to the ASX200 at -0.80%). Maybe the tide is about to turn? |
|
|
News & Insights New Funds on FundMonitors.com The Future for Small Caps Webinar Recording Magellan Global Fund Update | Magellan Asset Management A once in a generation opportunity | Insync Fund Managers April 2023 Performance News Bennelong Australian Equities Fund 4D Global Infrastructure Fund (Unhedged) Skerryvore Global Emerging Markets All-Cap Equity Fund Delft Partners Global High Conviction Strategy Bennelong Twenty20 Australian Equities Fund |
|
|
If you'd like to receive Hedge Clippings direct to your inbox each Friday |
5 May 2023 - Hedge Clippings | 05 May 2023
|
|
|
|
Hedge Clippings | 05 May 2023 "This budget will be handed down in the context of an uncertain and volatile global economy which is precariously placed." Thus Treasurer Jim Chalmers summed up his view of the challenge facing him next Tuesday following his visit to the US to meet his offshore counterparts, and things would seem to have become even more volatile and precarious since then. That was back in mid April when he returned with the message that the IMF was forecasting "an incredibly weak five years of economic growth." Since then the US banking system has gone from bad to worse following the collapse of Silicon Valley, Signature, and now First Republic Bank, with others likely to follow as investor confidence tumbles. Bank failures are not that uncommon in the US, as shown by this list from the FIDC, with some analysts estimating that over 50% of the 4,800+ US banks could be under threat. While in Australia we have a well capitalised, and much more concentrated banking landscape, we too rely on the market's - and in particular depositors' - confidence that their funds are secure, irrespective of government guarantees. While Australia's economy and budget may be insulated to a degree by record low unemployment, bracket creep, and high commodity prices, they are not immune to the stubbornly high inflation which is spreading to the services sector, and increased labour costs. Basic wage demands, along with calls for improved welfare, are likely to feature heavily in Tuesday's budget, even if any increases will be insufficient for those unable to offset the increases in their basic living costs. What is almost certain to be missing on Tuesday is any serious attempt to fix the outdated, inefficient and broken taxation system on which the welfare system relies. Meanwhile, given this week's further tightening both here and the US, seemingly the only remedy to the current inflation is higher interest rates - with the outlook for a prolonged period of both, and the risk that the desire to dampen inflation will damage the economy to the point of recession. The RBA's March quarterly Statement on Monetary Policy, released earlier today, claims at the outset that inflation has passed its peak, and expects the current level of 7% to decline to 4.5% by the end of the year, before returning to 3% by mid 2025. That's dependent on GDP growth of just 1.25% as inflation and interest rates take effect, and with recent declines in retail sales, and the post COVID slump in the Household Savings Ratio, and a 3% decline in Household Disposable Income Growth, that may well be the case. The Statement is careful to add the caveat that the "outlook is subject to a range of uncertainties," but what is certain is the Board's focus on inflation, which in the Statement's Overview gets mentioned no less than 49 times, more than interest rates, wages, labour and the economy combined. If that's not enough, it is worth taking notice of the last paragraph, and the final sentence: "The Board remains resolute in its determination to return inflation to target and will do what is necessary to achieve that." The RBA's intentions are one uncertainty Jim Chalmers won't have to deal with next Tuesday. Meanwhile, it's no secret that the small cap equity sector, having returned on average 17.42% p.a. over the past three years to be the best performing peer group in AFM's database, has struggled over the past year, falling 11.63%. There's been some recovery over the past six months, so next Tuesday at 4:15 AEST we will be hosting a "round table" webinar featuring three fund managers from the Small Cap sector.
|
|
|
News & Insights 10k Words | Equitable Investors Stock Story: QBE Insurance | Airlie Funds Management |
|
|
If you'd like to receive Hedge Clippings direct to your inbox each Friday |

5 May 2023 - Performance Report: PURE Income & Growth Fund
[Current Manager Report if available]