NEWS
26 Jun 2023 - Performance Report: Rixon Income Fund
[Current Manager Report if available]

26 Jun 2023 - Performance Report: Bennelong Concentrated Australian Equities Fund
[Current Manager Report if available]

26 Jun 2023 - Risk-adjusting small-cap upside
|
Risk-adjusting small-cap upside PURE Asset Management June 2023 Those investing in smaller companies will appreciate the difficulties faced by this market segment since early 2022. Central banks have raised interest rates in unison, with liquidity and confidence evaporating as a result. The unfortunate outcome is that share price appreciation has been a mirage for most emerging businesses. When compared to large cap peers, the chart below illustrates the degree of such underperformance. Since January 2022, small cap equities have experienced their own 'GFC'. A key adage we live by at PURE is that share prices are not always reflective of underlying operational performance. Market sentiment and liquidity can savagely impact small cap valuations, and while painful for existing equity holders, create phenomenal opportunities for astute new investors. The risk is that equity prices remain under pressure for longer than an equity investor can stomach, resulting in further losses. Our key takeaway from the above chart, it that strong outperformance has always followed underperformance. When small cap share prices appreciate, they do so quickly. The unknown here is timing. While no investors have certainty on timing, hybrid investing is a unique way to 'risk-adjust' this variable. Hybrid investments involve entering a transaction via a credit instrument, yet retaining exposure to equity returns via a conversion mechanism. The outcome being sought is to remove downside equity volatility, yet retain exposure to upside equity volatility. This entails swapping some equity upside for capital structure protection, security, and a consistent interest income stream. Getting 'paid to wait' in the form of interest income ensures a cash yield is received as each investment thesis materialises. Today's conditions are extremely attractive to deploy capital via hybrid structures. Many borrowers are unable to access debt markets, with most dissatisfied with their cost of equity. The result is a strong negotiating position for deal originators, as value drivers (interest rates / conversion premiums) are being agreed from a position of power. If capital preservation can be achieved as a secured creditor, upside potential from this cycle low should be self-evident. While an attractive way to invest, hybrid deals are are difficult for investors to source as they involve a direct negotiation with the Borrower. PURE's funds were established as a vehicle to provide exposure to this form of investing, a strategy which remains unique to this day. Have you considered hybrid investments as a way to risk-adjust your exposure to emerging companies? Funds operated by this manager: |

23 Jun 2023 - Hedge Clippings | 23 June 2023
|
|
|
|
Hedge Clippings | 23 June 2023 Rate Rises and Inflation - what else? The RBA started the tightening process just over 12 months ago in an effort to firstly contain, and then to subdue inflation. The timing was broadly in step with central banks in the UK and Europe as inflation was global. Given they're still increasing rates, or threatening to, and consumers seem reluctant to respond, one has to ask how successful they've been - or possibly how much worse inflation would be if central banks had sat on their collective hands? This week in his twice yearly appearance before politicians trying to make a point, US Fed Chairman Jerome Powell said it was a "pretty good guess" that US rates would increase twice more this year as he tries to subdue inflation back to the 2% level while avoiding higher unemployment, and thus a recession. In the UK, the Bank of England is facing the same issue, increasing rates by a further 0.5%, stating "The economy is doing better than expected, but inflation is still too high (8.7%) and we've got to deal with it." Unfortunately, "dealing with it" involves inflicting pain on consumers, as pointed out by RBA deputy Governor Michelle Bullock in her speech this week, giving Philip Lowe a break from the firing line. In spite of widespread anecdotal evidence of consumer pain being reflected by retail sales, particularly for big ticket and electrical goods, strong employment statistics, not only in Australia but also in the US and UK, are spoiling the objective of higher rates. Bullock pointed out there needs to be a balance. With the RBA's current forecast of inflation returning to target (2-3%) by mid 2025, and unemployment increasing to 4.5% by the end of 2024, which they estimate still equates to "full employment," they judge that the balance between supply and demand will be achieved. As Philip Lowe frequently points out, that balance can also be described as a "narrow path" between inflation, higher rates, and recession. Meanwhile, equity markets continue to confound and confuse. The ASX All Ordinaries has risen 10.5% in the 12 months since 23rd of June, 2022. Wind the start date for that 12 month period back to 31st of May, and that 12 month performance becomes negative. Stock and sector selection, plus of course timing, has been key. On Tuesday next week, we are holding a further Sector Review, this time focusing on the resource sector. Register here for our manager round table webinar, where we will be joined by three Australian specialist resource managers to get their views on the opportunities and risks for the sector. |
|
|
News & Insights Chat GPT and the implications of this new technology | Magellan Asset Management Market Update - May | Australian Secure Capital Fund May 2023 Performance News 4D Global Infrastructure Fund (Unhedged) Delft Partners Global High Conviction Strategy Emit Capital Climate Finance Equity Fund Bennelong Australian Equities Fund |
|
|
If you'd like to receive Hedge Clippings direct to your inbox each Friday |

23 Jun 2023 - Performance Report: Quay Global Real Estate Fund (Unhedged)
[Current Manager Report if available]

22 Jun 2023 - Performance Report: Insync Global Quality Equity Fund
[Current Manager Report if available]

22 Jun 2023 - Japan - Back in Vogue
|
Japan - Back in Vogue Redwheel (Channel Capital) June 2023 For the first time in my 20-year career, I feel like the cool kid in town. Suddenly, almost everyone wants to know what I think about Japan; about the new Bank of Japan Governor, the Yen, the Tokyo Stock Exchange's (TSE) focus on low valuation stocks, about what companies I think Warren Buffett will buy next and whether I think Japan is really changing "this time". Apart from a brief period of Abenomics-induced euphoria a decade ago, Japan is the hottest I can remember, and yes, "this time" it is with good reason. Having experienced and (just about) survived Japan's "lost decades", though, I would be remiss if I didn't suggest this exuberance was balanced with caution. But first, let's talk about why Japan is enjoying the spotlight. Japan is cheap , flush with cash, and in the midst of sweeping corporate governance reform. It is the third largest economy in the world, with nearly 4,000 listed companies, yet despite eight straight weeks of net buying , foreign ownership is at multi-year lows . This underweight exposure by the investment community is despite Japanese companies booking low double-digit returns over 10 years, driven by dividends and higher EPS growth than the S&P . Impressively, these returns have come through despite the market de-rating, meaning a negative contribution from valuation compression. Now, GDP growth is widely forecasted to be the highest among developed nations in 2023, and the outlook for earnings growth is strong . The country is potentially set to benefit from its relatively recent re-opening to foreign travel (October 2022) and in particular, to its largest trading partner, China. Geopolitical friction and re-shoring efforts globally are drawing attention from regional investors to a politically and socially stable, deep and liquid alternative market that has been hiding in plain sight. Japan is viewed as a key destination for capital seeking innovative and vibrant firms, geopolitically aligned with the west. Amidst the global angst surrounding inflation, Japan remains relatively buffered and has counter-inflationary traits in the large cash positions of both corporates and households. Uniquely, Japan welcomes some of the inflationary pressures, which are almost exclusively imported through higher energy and food pricing. With those cost-pressures looking to ease later this year, real wage growth is predicted to turn positive in the 2H , which could help drive domestic demand. The near monopoly of political power held by the Liberal Democratic Party since the 1950s means that Japanese politics lack the soap-opera dramatics seen elsewhere. The finely choreographed cooperation between the Government, the central bank, financial institutions and regulators is a rare strength of Japan and provides a reassuringly consistent platform from which to determine and accomplish long-term goals - the most important of which in recent years, were arguably the Abe administration's corporate governance reforms, given teeth by the Tokyo Stock Exchange's recent announcements. Many market watchers will remember there was similar excitement amongst foreign investors about Japan when the late PM Abe announced his 3rd Arrow of Corporate Governance reform through Abenomics, followed by frustration that changes were not happening fast enough, which was fair! Changing deeply entrenched corporate cultures and values takes time and takes an element of herd mentality in Japan. We have now passed that point of critical mass. 18 years ago when the Redwheel Nissay Stewardship strategy began, stewardship and engagement were relatively new and alien concepts in corporate Japan. Finding corporate management teams who were willing to embrace change and see shareholders as partners with whom they could work towards a common goal, was often a long and grueling process. Now, stewardship is an established concept and engagement is a recognized instrument of responsible investing (when wielded correctly). This means that sectors and industries which were historically more difficult, or near-impossible, to engage with have started to open up to shareholders and their opinions. There are clear signs of change throughout corporate Japan in areas ranging from gender diversity to shareholder return, and although the pace is accelerating, the seeds of change were planted many years ago. What then, has happened recently to finally bring foreign investor focus back to Japan? Last year the TSE restructured their listing categories and requirements (into TSE Prime, Standard and Growth), giving an indefinite grace period for companies to meet the new criteria. At the beginning of this year however, they announced the end to the grace period was March 2026, and expectations are that companies which don't meet requirements by then will be downgraded or de-listed. At this point, there aren't any hard and fast enforcement measures from the TSE, but the language they have used is more powerful than it has ever been. Companies are expected to demonstrate financial literacy, including assessment, explanation and defence of their share price and capital efficiency . There is a particular focus on companies with a PriceBookRatio (PBR) of less than 1, who are "encouraged" by the TSE to disclose their plans for improvement. The simplest way to improve metrics for many of these companies are to lighten balance sheets by selling off assets, unwinding cross-shareholdings and returning excess cash to shareholders. Many of us have heard this all before, but these new measures from the TSE and the resolve behind them imply firm determination from the top. The master stroke of marketing for Japan was delivered from the very unlikely location of Omaha. Buffet's highly publicised recent visit to Tokyo was followed shortly after by his comment that "we're not done in Japan" at Berkshire Hathaway's annual meeting, and value investors globally set about trying to figure out where Buffett would strike next. Now, the pinch of wasabi: The warning from the TSE aimed at companies trading below liquidation value, refers to more than 40% of stocks in the index, or around 2000 names, including corporate behemoths like Toyota Motor and Mitsubishi UFJ group. It is therefore very tempting for investors to buy a large swathe of the Topix and hope for the best. However, I believe that although huge strides have been made across the market, the majority of these companies will not change, even with pressure from the TSE or from activists. As recently as last month, companies from global retailer Seven & I Holdings to the country's third largest oil refiner Cosmo Energy, have taken steps to bat away activist investors (Value Act and Murakami, respectively). Smaller, more domestic, companies which make up the majority of the <1PBR cohort may be even harder to convince, with or without activist pressure. They key point is that Japan has always been a stock-pickers' market, and crucially for engagement or activist funds, it is a management-pickers' market. Identifying corporate managers with the will to change will be key. It is all very well identifying companies which have challenges that we can help address, but what of the quality and receptiveness of the management themselves? Engagement is highly inefficient and ineffective when met with a firmly closed door. Part of a teams' expertise should be focussed on assessing whether the door towards constructive dialogue is open, or even, just slightly ajar. Through Redwheel's joint venture with Nissay Asset Management, we have one of the longest-running dedicated engagement strategy in Japan, supported by a 22-person sector analyst team based in Tokyo. Company analysis is based on over 3,000 in-person meetings with Japanese corporates per year, and their knowledge is an invaluable resource to discover management with "engageability". Having on-the-ground resources and the ability to identify companies that are changing will be more important than ever to navigate and benefit from the stars potentially aligning for Japan. One can't overstate the over-riding importance and impact of corporate reform in a market which is home to truly excellent companies who are leaders in their global fields. After a slow start, corporate governance reform has gained momentum and is now self-sustaining, while at the same time, some companies have fallen victim to market style-shifts and tumbled despite solid earnings and steady reform. We believe we have a rare opportunity to invest in excellent companies at severely undervalued levels, in an environment which has never been more supportive of determined and active engagement. |
|
Funds operated by this manager: CC Redwheel Global Emerging Markets Fund, CC Redwheel China Equity Fund Sources: [1] MSCI World and Developed World, Citi Research, MSCI, Factset, March 2023 [2] Mizuho Securities research, 30.05.2023 [3] Goldman Sachs Research, 30.05.2023 [4] Bloomberg data [5] Market reports JPMorgan, Schroders, Citi Wealth, SocGen, Deutsche Asset Management, Invesco, AXA, T Rowe Price, January 2023. [6] NLI Research Institute, May 2023 [7] JPX January 30, 2023 Key information: No investment strategy or risk management technique can guarantee returns or eliminate risks in any market environment. Past performance is not a guide to future results. The prices of investments and income from them may fall as well as rise and an investor's investment is subject to potential loss, in whole or in part. Forecasts and estimates are based upon subjective assumptions about circumstances and events that may not yet have taken place and may never do so. The statements and opinions expressed in this article are those of the author as of the date of publication, and do not necessarily represent the view of Redwheel. This article does not constitute investment advice and the information shown is for illustrative purposes only. |

21 Jun 2023 - Performance Report: Kardinia Long Short Fund
[Current Manager Report if available]
21 Jun 2023 - Performance Report: Bennelong Australian Equities Fund
[Current Manager Report if available]

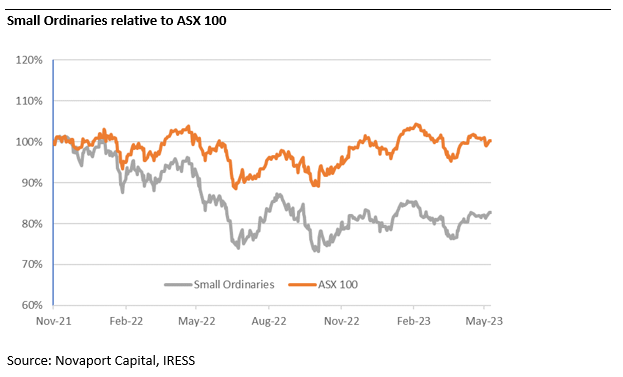
21 Jun 2023 - Thinking small to win big
|
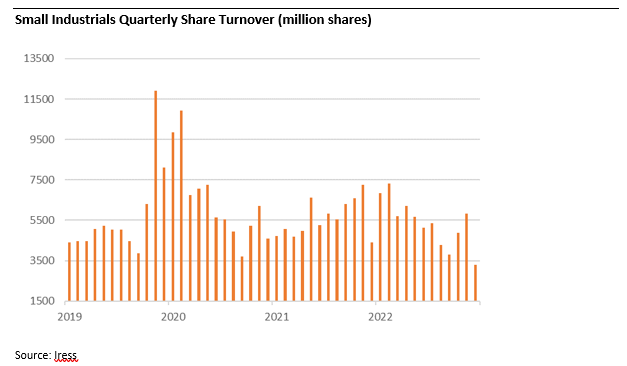
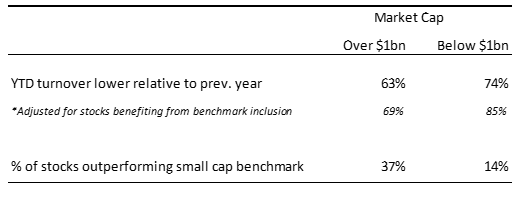
Thinking small to win big Novaport Capital May 2023 Conventional wisdom suggests that 'time in the market' is a less risky strategy than 'timing the market'. Boom and gloom provide attractive entry and exit points but only if the timing is right. Accurately identifying market peaks and troughs is notoriously difficult. In our experience, gradually allocating more to markets during times of market distress and less when 'everything is awesome' is a preferable approach. Small caps, and in particular, industrials, present an opportunity for investors at current levels. The Small Ordinaries benchmark has underperformed the ASX100 since November 2021. Notably, industrials have underperformed resources, which have been supported by thematics such as energy security, battery materials, and gold. In addition, adjusting to tighter monetary policy has weighed on small industrials. The recent underperformance presents a chance for investors to incrementally allocate to the sector. Falling liquidity signals capitulation Investors' willingness to trade reveals their confidence, or lack thereof, in the market. Rising liquidity can create a virtuous circle during a bull market, when abundant liquidity entices more capital into markets (attracted by lower trading costs). Yet when liquidity falls and markets are falling, the cycle works in reverse. Capital ceases to flow to (or exits) the market due to illiquidity concerns. Since November 2021, liquidity in the small industrials sector has dropped meaningfully. Thus far in 2023, the daily average value of turnover for small industrials has been $704m, down a third (from $1,070m) during the same period in 2021. The decline in liquidity indicates that a lower amount of new money is being put to work in Small Caps. Contrarian investors have a better chance of picking up a bargain now, relative to last year. Microcaps have been hit harder Not surprisingly the decline in liquidity has been most pronounced for the smallest of small caps. 74% of the smaller small industrials (with a market capitalisation of less than $1 billion) had lower turnover in the last 12 months relative to the previous year. Adjusting for stocks which benefited from index inclusion, 85% of companies saw turnover decline. The impact on liquidity has been lower for the larger small companies, 63% had lower turnover (or 69% adjusting for index changes). Unsurprisingly, 37% of 'larger' small caps (market cap >$1bn) outperformed the benchmark relative to a mere 14% of the 'smallest' companies. One of our holdings Quantum Intellectual Property Ltd, provides a case study of the current dynamic in microcaps. Quantum has a meaningful and growing share of the Australian Patent, Trade Mark and IP Legal Services market. Over the last year their share price has fallen by 19%, materially under-performing the small cap benchmark. On our estimates, the company trades on an attractive discount to earnings and yield metrics relative to the broader market, however its share turnover is 23% lower than the previous year. In a recent market update, the company reaffirmed expectations for organic growth, improving margins and further consolidation opportunities. The decline in liquidity merely reflects that the stock has fallen off the market's radar in our view, creating an investment opportunity. Quantum is just one example of similar opportunities arising in the current market environment. Different exposures than large caps The Australian stock market is heavily weighted towards highly profitable bank and resources stocks. The smaller end of the market has a wider range of exposures, from resource exploration stocks and retailers to fast growing technology businesses. The composition of the small caps benchmark evolves over time. Furthermore, industrial companies are less risky than three years ago. We estimate that loss making companies are now only 5% of the small industrials' universe, down from over 30% before the pandemic. The current small cap market has a lower exposure to risky, early stage or loss-making companies. Following the recent underperformance of small caps, we see attractively priced opportunities relative to the large cap universe. For example, Domain Holdings offers faster growth than REA Group (as it increases market penetration), yet it trades at a discount. At the same time, small cap building materials companies in markets with high barriers to entry, trade at through cycle earnings multiples in the mid-teens, despite having more favourable industry structures relative to than their historical averages. Smaller Companies have traditionally been more volatile and sensitive to the economic environment, which is expected to be challenging. There are valid reasons to be cautious. However, the small industrials benchmark is comprised of more robust businesses post the 2022 market correction. Their underperformance relative to large caps and the withdrawal of liquidity suggests the market is already fearful. This presents us with an opportunity to increase our exposure to quality, but overlooked, businesses. Author: Sinclair Currie, Principal and Co-Portfolio Manager Funds operated by this manager: NovaPort Microcap Fund, NovaPort Wholesale Smaller Companies Fund This material has been prepared by NovaPort Capital Pty Limited (ABN 88 140 833 656 AFSL 385 329) (NovaPort), the investment manager of the NovaPort Smaller Companies Fund and the NovaPort Microcap Fund (Funds). Fidante Partners Limited ABN 94 002 835 592 AFSL 234668 (Fidante) is a member of the Challenger Limited group of companies (Challenger Group) and is the responsible entity of the Funds. Other than information which is identified as sourced from Fidante in relation to the Funds, Fidante is not responsible for the information in this material, including any statements of opinion. It is general information only and is not intended to provide you with financial advice or take into account your objectives, financial situation or needs. You should consider, with a financial adviser, whether the information is suitable to your circumstances. The Fund's Target Market Determination and Product Disclosure Statement (PDS) available at www.fidante.com should be considered before making a decision about whether to buy or hold units in the Funds. To the extent permitted by law, no liability is accepted for any loss or damage as a result of any reliance on this information. Any projections are based on assumptions which we believe are reasonable but are subject to change and should not be relied upon. NovaPort and Fidante have entered into arrangements in connection with the distribution and administration of financial products to which this material relates. In connection with those arrangements, NovaPort and Fidante may receive remuneration or other benefits in respect of financial services provided by the parties. Fidante is not an authorised deposit-taking institution (ADI) for the purpose of the Banking Act 1959 (Cth), and its obligations do not represent deposits or liabilities of an ADI in the Challenger Group (Challenger ADI) and no Challenger ADI provides a guarantee or otherwise provides assurance in respect of the obligations of Fidante. Investments in the Fund(s) are subject to investment risk, including possible delays in repayment and loss of income or principal invested. Accordingly, the performance, the repayment of capital or any particular rate of return on your investments are not guaranteed by any member of the Challenger Group. |