

After many years of limited activity on green bonds in Australia, we have seen a number of developments in this space recently, with the announcement of the Australian Government issuing a green bond. This reflects the substantial increase in activity in green bond development globally.
Joining the latest episode of the ESG in 10 podcast, is Tamar Hamlyn, portfolio manager at Ardea Investment Management, to take us through the developments in the green bond space in Australia and what this means for sovereign bond investors.
NEWS

Performance Report: Airlie Australian Share Fund
The Airlie Australian Share Fund rose by +2.61% in July. Since inception in June 2018, the fund has returned +10.15% per annum, an outperformance of +1.97% relative to the ASX 200 Total Return benchmark which has returned +8.18% on an...
Read more...

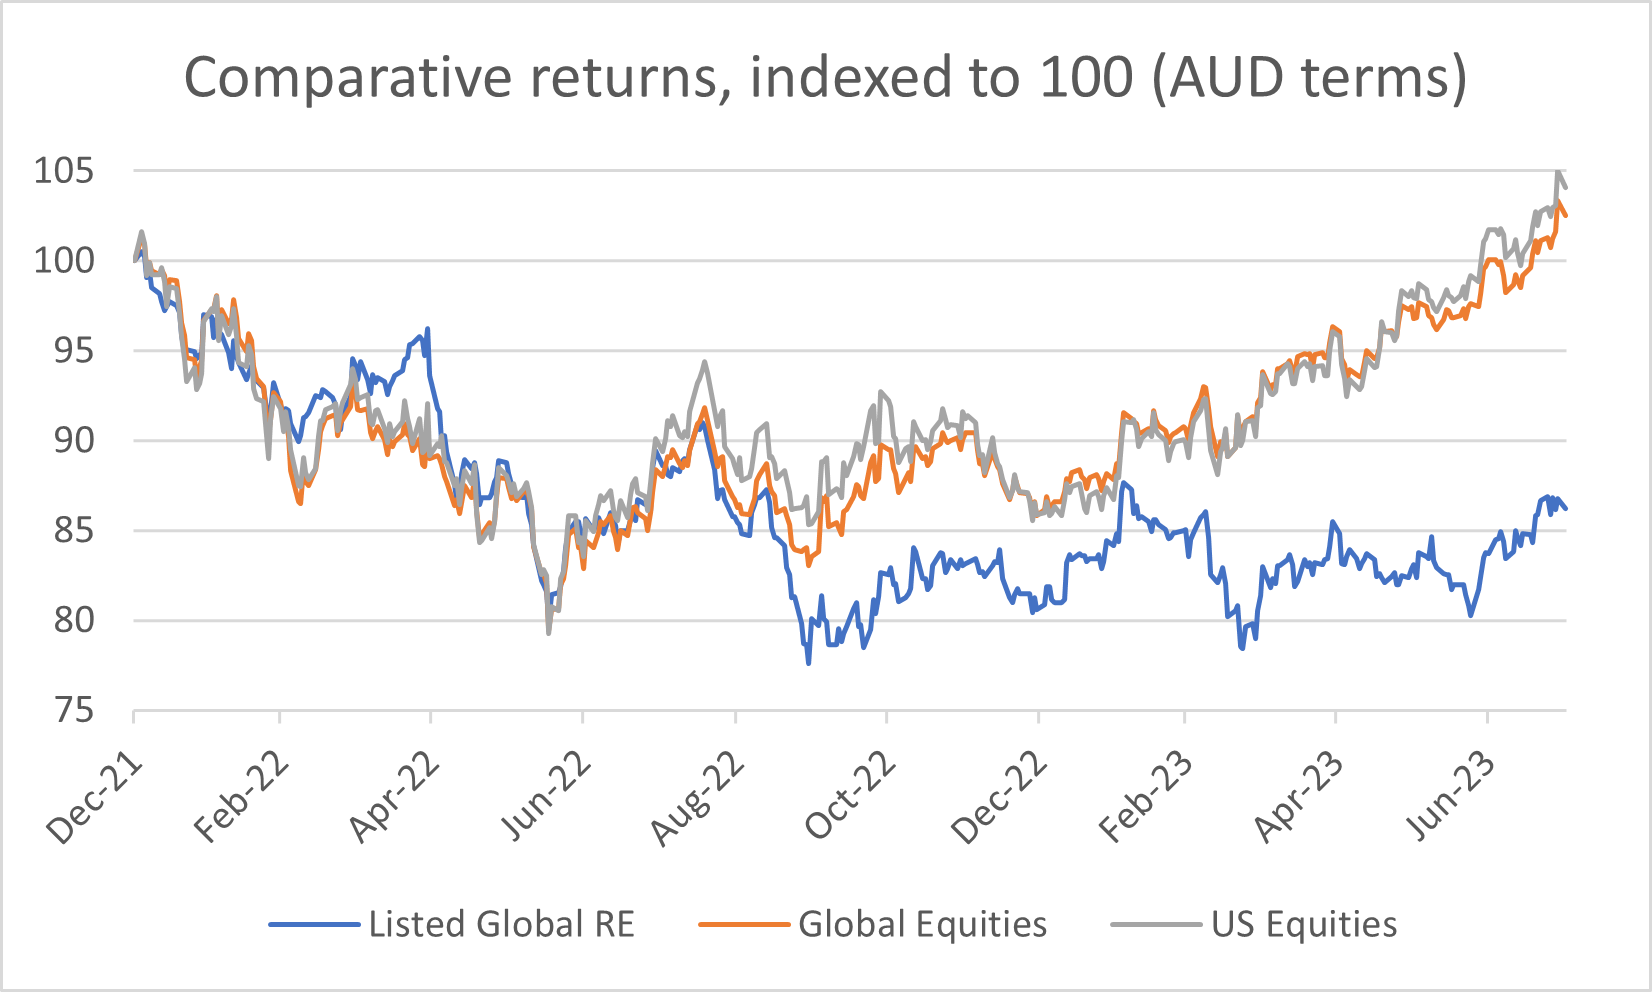
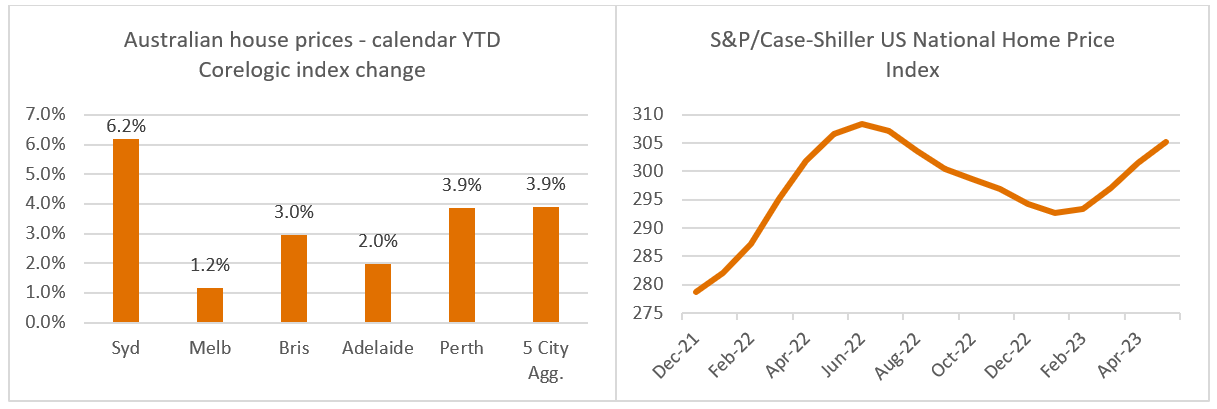
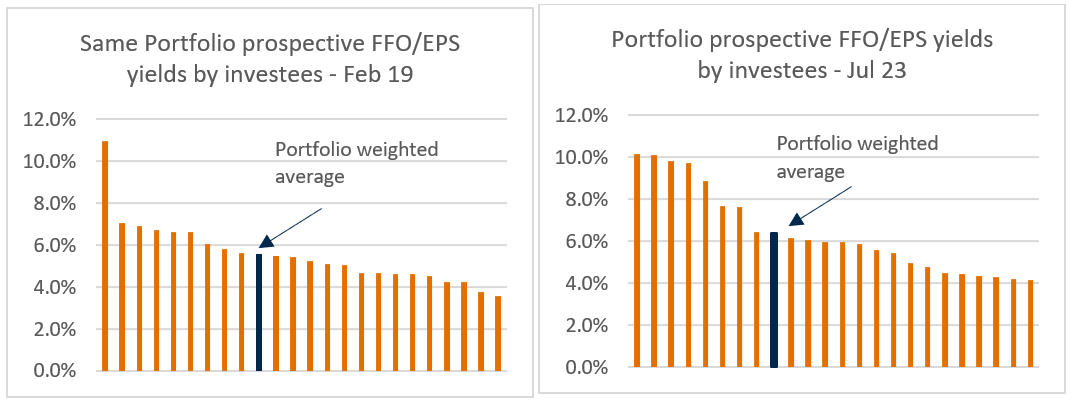
Investment Perspectives: Thinking about the cycle
Being an investor in listed global real estate has been tough of late. With expectations of a global recession caused by unprecedented interest rate increases, sentiment towards listed global real estate has soured.
Read more...

Performance Report: Bennelong Long Short Equity Fund
The Bennelong Long Short Equity Fund has risen by +5.65% over the past 12 months. Since inception in February 2002, the fund has returned +12.34% per annum, an outperformance of +4.26% relative to the ASX 200 Total Return benchmark which...
Read more...

Performance Report: Skerryvore Global Emerging Markets All-Cap Equity Fund
The Skerryvore Global Emerging Markets All-Cap Equity Fund rose by +0.85% in July. Since inception in August 2021, the fund has returned +2.85% per annum, an outperformance of +5.67% relative to the MSCI Emerging Markets (MMEF) AUD...
Read more...

Hedge Clippings | 11 August 2023
CBA's results shows what's happening in the 'burbs.
Hedge Clippings wouldn't dream of suggesting we have any credentials as a bank analyst, but over the years (too many to count!) we have been a bank "watcher" or observer. As...
Read more...

Performance Report: Bennelong Concentrated Australian Equities Fund
The Bennelong Concentrated Australian Equities Fund rose by +7.93% in July, outperforming the ASX 200 Total Return benchmark by +5.05%. Since inception in February 2009, the fund has returned +13.35% per annum, an outperformance of +3.55%...
Read more...
Performance Report: Quay Global Real Estate Fund (Unhedged)
The Quay Global Real Estate Fund (Unhedged) rose by +4.18% in July, outperforming the FTSE EPRA/ NAREIT Developed NET TR benchmark by +1.68%. Since inception in January 2016, the fund has returned +6.42% per annum, an outperformance of...
Read more...

ESG in 10: Episode 9- The Australian Green Bond Program, with Ardea
Fidante sat down with Head of Research at Ardea Investment Management, Dr Laura Ryan and Portfolio Manager, Tamar Hamlyn to discuss the role of government bonds in an equity heavy portfolio.
Read more...
Performance Report: Bennelong Australian Equities Fund
The Bennelong Australian Equities Fund rose by +6.83% in July, outperforming the ASX 200 Total Return benchmark by +3.95%. Since inception in February 2009, the fund has returned +11.89% per annum, an outperformance of +2.09% relative to...
Read more...

Performance Report: 4D Global Infrastructure Fund (Unhedged)
The 4D Global Infrastructure Fund (Unhedged) rose by +0.86% in July. Since inception in March 2016, the fund has returned +9.7% per annum, an outperformance of +1.04% relative to the S&P Global Infrastructure TR (AUD) benchmark which has...
Read more...