
NEWS

10 Oct 2025 - New Funds on Fundmonitors.com
|
New Funds on FundMonitors.com |
|
Below are some of the funds we've recently added to our database. Follow the links to view each fund's profile, where you'll have access to their offer documents, monthly reports, historical returns, performance analytics, rankings, research, platform availability, and news & insights. |
 |
||||||||||||||||||||||
| TAMIM Global Infrastructure Fund | ||||||||||||||||||||||
|
||||||||||||||||||||||
| View Profile | ||||||||||||||||||||||
 |
||||||||||||||||||||||
| ASCF Private Fund | ||||||||||||||||||||||
|
||||||||||||||||||||||
| View Profile | ||||||||||||||||||||||
 |
||||||||||||||||||||||
| Metrics Real Estate Income Fund | ||||||||||||||||||||||
|
||||||||||||||||||||||
| View Profile | ||||||||||||||||||||||
|
|
||||||||||||||||||||||
| Pantheon Global Private Equity Fund (PGPE) | ||||||||||||||||||||||
|
||||||||||||||||||||||
|
Want to see more funds? |
||||||||||||||||||||||
|
Subscribe for full access to these funds and over 900 others |

9 Oct 2025 - Geopolitics - Markets to take a backseat, investors need not do the same
|
Geopolitics - Markets to take a backseat, investors need not do the same Janus Henderson Investors September 2025 Jay Sivapalan, Head of Australian Fixed Interest, discusses the impact of geopolitical shifts on global economic dynamics, emphasising the need for investors to realign with government strategic priorities. Timely & Topical Geopolitical issues are currently having a heavy influence on economic and market outcomes. Global tectonic shifts are occurring in the areas of trade, defence, energy, technology and a desire for national resilience. Consequently, the key pillars that drove synchronised global economic growth are under threat with economic growth drivers such as the peace dividend we've enjoyed over the last 80 years and free trade agreements we've appreciated for decades, no longer intact. Whilst we in the investment community would like to think markets are central to government actions, the harsh reality is that they are not. The market feedback mechanism is important in governments achieving their economic and geopolitical objectives. However, higher order priorities for governments are increasingly apparent. For much of the past four or five decades, investors have been able to rely on some simple principles for investing within free market based capitalist economies. The allocation of scarce resources was driven almost solely by the highest return on capital available, feedback from market pricing and free competition anchored by comparative advantage. The role of government mostly centred around delivery of public goods and services, provision of safety nets as well as keeping checks and balances in place through regulation. An environment where private sector decisions ultimately drove markets whilst governments played a supportive role. Markets were at the forefront of these private sector (and some public sector) decisions. Looking ahead, we see the potential for the roles of government and the private sector to be reversed. Where governments have strategic priorities driving critical decisions around the use of capital, labour, technology and other scarce resources dictating the growth or fall in certain sectors, the higher order priority now is to achieve nationalistic objectives. While the private sector will absolutely be necessary for governments to achieve their more strategic goals, the bigger picture decisions are not likely to be driven by free market pricing signals per se. Going forward, the role of the private sector, whilst different and not in the driving seat, remains critical to governments achieving their objectives. The main reason being that the intellectual property, investor capital, skilled labour and track record of delivery sits within the private sector. Governments also absolutely need the private sector to execute their objectives. Therefore, key success factors for private sector participation will be:
Thinking differentlyThe geopolitical environment over the coming decades will be significantly different to the past. The historical norm of shooting for comparative advantage in trade is one case in point. Countries specialising in producing and exporting goods and services for which they have a lower production cost compared to others, enables greater total production and consumption than otherwise achieved in isolation. This is at the heart of globalisation and global commerce. In a controlled environment, a constrained optimum, a framework that delivers the benefits of comparative advantage can still hold but the level of complexity increases. Regulation, resource availability, technological factors and social and political objectives have always been in the frame as constraints. Increased nationalist and protectionist policies can add further distortion and friction to otherwise economically rational decisions which have sharpened the focus of governments and their policy makers. For investors, the implications are that the economy and markets are no longer front and centre in policymakers thought processes. Rather, markets are a tool through which economies and their respective governments to achieve their strategic priorities. Protectionist policies, for example, may mean that there's no certainty a trading partner can be relied upon to maintain willingness/capacity to deliver goods and services as required. Instead of an optimally efficient economic outcome being pursued, higher order government policies may take precedent. That is, governments may no longer pursue the cheapest option, but that with the greatest certainty of execution. The outcome is that winners and losers will emerge and the gulf between each is likely to expand. Governments will be much more influential in who those winners and losers are at the country, industry and company level. Investment implications - There will be winners and losersFor investors, the playbook for success has changed. Identifying the strategic priorities for governments and the number one, two and three operators with a track record of successful execution in these areas is a good start. Determining which industries could receive subsidies and tax breaks could also prove advantageous. As a guide, investors would be well served to assess investments with a focus on:
This shift in approach from starting with the private sector to now commencing with governments' strategic priorities, whilst it may change the way industries and companies will succeed or fail, does not preclude successful investing and strong returns on invested capital across a range of asset classes. There will be winners and losers! Companies poised to benefit from strategic priorities such as the following are worth exploring:
A way forwardClearly, investors need to think and allocate differently to how they have in the past and will need to work portfolios harder and more diligently to achieve their objectives. Pursuing similar return targets to those achieved previously but in a safer way may be the better way to go, rather than leaning into risk which has been so well rewarded. For example, to maintain purchasing power and grow a corpus in real terms, pension funds, endowments, foundations and insurance companies often target CPI + 3%. Currently, investors are better able to avoid leaning as heavily into growth assets to achieve these objectives, with a greater allocation to defensive assets possible. The past year has proven this to be the case with fixed income reestablishing itself as a compelling opportunity to drive attractive returns. The full gamut of options have delivered attractive return outcomes. Investment grade credit, the sweet spot between traditional equities and more pedestrian cash where risk of default, especially in Australia, is remote and has delivered 7.8% returns for FY25*, close to long term assumptions for equity market returns in asset allocation models. Investing differently for successful outcomesThe world is changing rapidly and for policymakers, markets are not the primary focus. Investors can still succeed but need to change the way they invest. When assessing policy and geopolitics, it is more relevant to back solve for what is firstly in the best interests of a nation and its public objectives, then the economy and markets - it's simply a different playbook. Just because markets have taken a back seat to geopolitics doesn't mean investors have to do the same. Many of the higher order government objectives will need to be delivered by the private sector. And with potentially government supported policy, regulation, subsidies, discounted funding and equity backing. Successful investment outcomes are very likely but achievable investing through a different lens. |
|
Funds operated by this manager: Janus Henderson Australian Fixed Interest Fund , Janus Henderson Conservative Fixed Interest Fund , Janus Henderson Diversified Credit Fund , Janus Henderson Global Natural Resources Fund , Janus Henderson Tactical Income Fund , Janus Henderson Australian Fixed Interest Fund - Institutional , Janus Henderson Conservative Fixed Interest Fund - Institutional , Janus Henderson Cash Fund - Institutional , Janus Henderson Global Multi-Strategy Fund , Janus Henderson Global Sustainable Equity Fund , Janus Henderson Sustainable Credit Fund *Bloomberg AusBond Credit 0+ Yr Index, as at June 2025. All opinions and estimates in this information are subject to change without notice and are the views of the author at the time of publication. Janus Henderson is not under any obligation to update this information to the extent that it is or becomes out of date or incorrect. The information herein shall not in any way constitute advice or an invitation to invest. It is solely for information purposes and subject to change without notice. This information does not purport to be a comprehensive statement or description of any markets or securities referred to within. Any references to individual securities do not constitute a securities recommendation. Past performance is not indicative of future performance. The value of an investment and the income from it can fall as well as rise and you may not get back the amount originally invested. Whilst Janus Henderson believe that the information is correct at the date of publication, no warranty or representation is given to this effect and no responsibility can be accepted by Janus Henderson to any end users for any action taken on the basis of this information. |

8 Oct 2025 - Plans are worthless but planning is essential
|
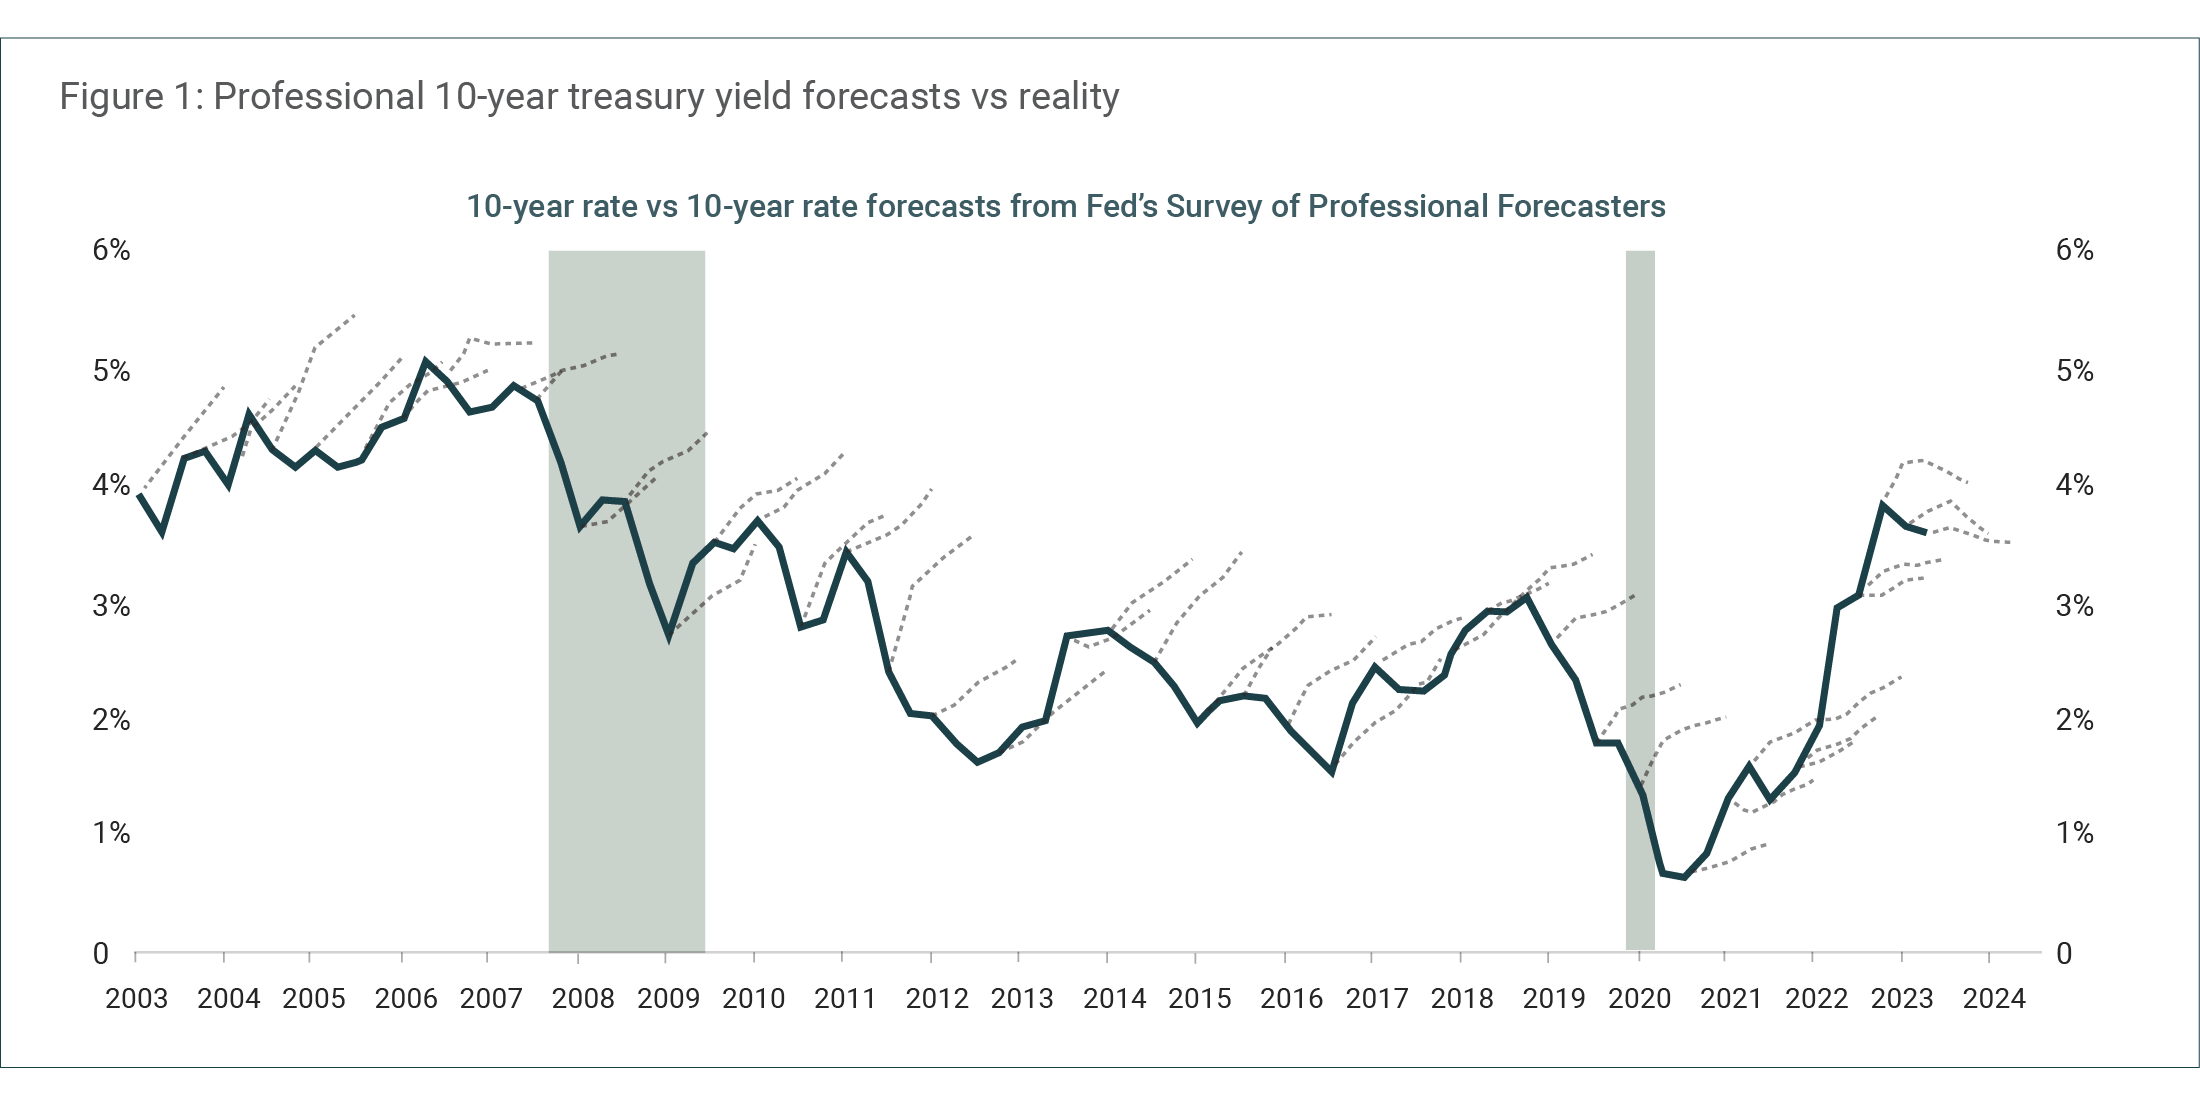
Plans are worthless but planning is essential Canopy Investors September 2025 5 min read 'Far more money has been lost by investors preparing for corrections, or trying to anticipate corrections, than has been lost in corrections themselves.' Warren Buffett has previously observed that for information to be useful in investing, it must be both important and knowable. While macroeconomic outcomes are undeniably important, evidence suggests they cannot be predicted with useful accuracy. The forecasting fallacyThe track record of professional macro forecasting is remarkably poor. Prakash Loungani's 2001 study analysed consensus GDP growth forecasts from private sector economists across sixty-three countries, examining sixty recessions from 1989 to 1998. His analysis showed that only two of the sixty recessions were predicted a year in advance, two-thirds remained undetected by April of the recession year, and in about a quarter of cases forecasters were still predicting positive growth in October of the recession year. As Loungani concluded, "the record of failure to predict recessions is virtually unblemished." Major institutions perform no better despite employing teams of PhD economists and having privileged access to non-public information. Andrew Brigden of Fathom Consulting examined International Monetary Fund (IMF) predictions across 194 countries, analysing 469 economic downturns from 1988 to 2018. The IMF successfully predicted only four recessions a year in advance - a success rate of just 0.85% - with all successful predictions involving smaller developing economies rather than major markets. This pattern extends beyond recessions to other key macro variables. Figure 1 below shows two decades of professional interest rate forecasts consistently overestimating future yields and missing every major decline.
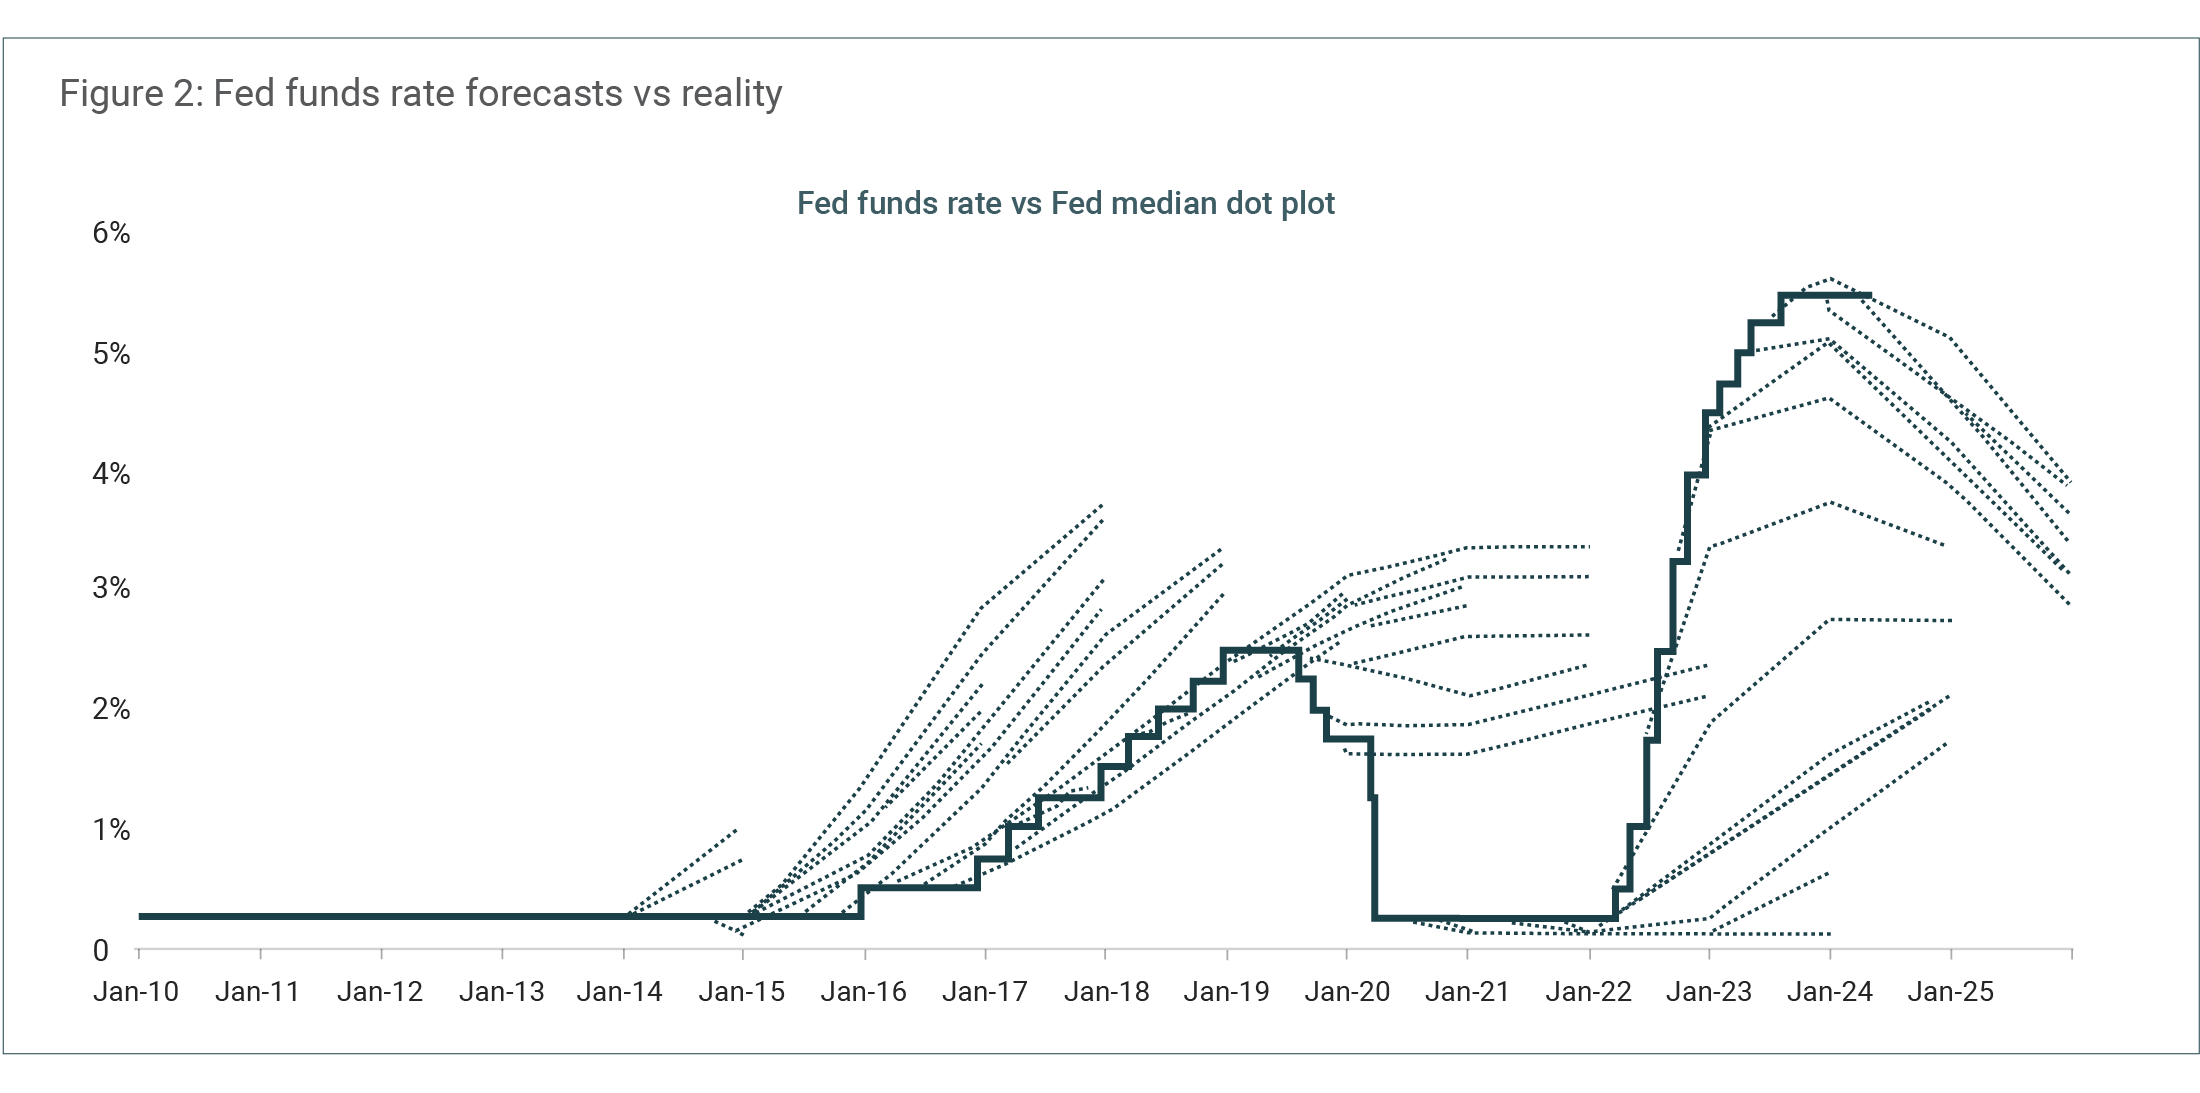
Source: Bloomberg, Philadelphia Fed Survey of Professional Forecasters, Apollo Chief Economist. Tellingly, the Federal Reserve struggles to predict even its own policy decisions. Figure 2 below highlights how Fed officials' projections of the funds rate (a metric they directly control) consistently miss the mark by wide margins.
Source: FOMC, Bloomberg, Apollo Chief Economist. The double prediction problemImagine that you could predict every recession, every inflation spike, and every policy change. Would you be guaranteed investment success? The surprising answer is no. As Howard Marks explains, "Even if you somehow manage to get an economic forecast correct, that's only half the battle. You still need to anticipate how that economic activity will translate into a market outcome. This requires an entirely different forecast, also involving innumerable variables, many of which pertain to psychology and thus are practically unknowable." We see this challenge in action when identical economic news can drive markets in unpredictable, sometimes opposing directions depending on prevailing sentiment, prior expectations, and what's already priced in. Lower inflation could spark a rally (rate cuts ahead!) or trigger selling (economic weakness!). The recent inflation cycle illustrates this perfectly. Economists consistently underestimated how aggressively the Fed would raise rates to combat inflation, forecasting a peak Fed funds rate in 2022 of around 3.5% when it actually reached 5.25-5.50%. Yet even perfect rate forecasting wouldn't have helped predict the subsequent market behaviour. Basic finance theory suggests higher rates should pressure valuations, but the S&P 500 has hit repeated record highs since then, powered most recently by optimism around artificial intelligence. Perfect economic forecasting, in other words, is only half the challenge. |
|
Funds operated by this manager: |

7 Oct 2025 - When Regimes Shift, So Should Portfolios
|
When Regimes Shift, So Should Portfolios East Coast Capital Management September 2025 When Regimes Shift, So Should Portfolios For decades, investors have leaned on a familiar comfort: when equities stumble, bonds will catch the fall. It's the failsafe that underpinned the traditional 60/40 portfolio. But as the AFR recently highlighted in the article How a Regime Change Threatens to Upend an Investor Failsafe, picking up on insightful work by NAB's Chief Economist Sally Auld, a regime change is threatening to upend this assumption. Rising rates, stubborn inflation, and shifting geopolitical sands have eroded the very diversification investors once relied upon. The danger isn't just financial; it's psychological. Anchored to the past, many investors cling to strategies that no longer work, exposing portfolios to concentration risk, blind spots in diversification, and costly behavioural biases. At ECCM, we see this moment differently. For systematic trend followers, regime change isn't a threat. It's opportunity. Concentration Risk: When Safety Nets Fail In 2022, both equities and bonds fell together, breaking the old model wide open. Investors discovered that a portfolio concentrated in traditional assets was far less diversified than it appeared. Trend following offers a different safety net. Because we trade across nearly 100 global futures markets, from equities and bonds to commodities and currencies, we aren't tied to one economic narrative. When bonds fail to diversify equities, currencies or commodities may step in. That breadth allows us to adapt as correlations change. Diversification Gaps: Beyond Equity Proxies Private equity, venture capital, and private credit are often pitched as "alternatives." Yet beneath the surface, they remain highly tied to equities, real estate, or interest rates. In a regime where those links break down, many investors find their "alts" weren't alternative at all. Our approach is different. By systematically trading markets as diverse as copper, feeder cattle, the Japanese yen, or U.S. treasuries, we access return streams truly distinct from traditional asset classes. That's real diversification: the kind that matters when regimes shift. Behavioural Biases: Fighting Human Nature When conditions change, investors often make the wrong move at the wrong time. Buying what feels cheap, selling what feels expensive, or clinging to past frameworks that no longer hold. These biases are magnified during regime shifts, when uncertainty drives emotional decisions. Trend following replaces instinct with process. Our rules cut losses early, let winners run, and respond to what markets are doing, not what we wish they would do. In other words, we don't argue with the wind; we set our sails to harness it. Why This Matters Now NAB Chief Economist Sally Auld is right: regime change is here. Inflation cycles, policy reversals, and geopolitical fragmentation are rewriting old assumptions. But investors don't need to be caught off guard. At ECCM, we believe the solution lies in systematic, adaptive strategies that thrive across regimes. For more than five years, our ECCM Systematic Trend Fund has delivered double-digit compound returns net of fees, with consistently low correlation to traditional assets. For investors, the choice is clear: continue relying on an old failsafe that may no longer work, or embrace strategies designed for the uncertainty ahead. Conclusion Our purpose is simple: to help investors protect and grow wealth in every market condition. Regime changes may unsettle the old order, but with discipline, breadth, and expertise, they can be transformed from threat to opportunity. At ECCM, we're ready to help wholesale clients build portfolios resilient enough to weather storms, and strong enough to thrive in what comes next. Funds operated by this manager: |

3 Oct 2025 - Equities can continue grinding higher if these risks remain contained
|
Equities can continue grinding higher if these risks remain contained Pendal September 2025 5 minutes read time |
|
Historically high valuations don't mean markets cannot keep going up. Crispin Murray explains what's driving markets - and the risks to watch for EQUITY markets are trading at historical highs - but can continue grinding higher if key risks facing the US economy remain contained, says Pendal's head of equities Crispin Murray in a new webinar. In the US, the S&P 500 is trading at about 23 times earnings, while the NASDAQ is around 28 times. "That's right at the high end of those historic ranges," says Murray in his latest Beyond The Numbers bi-annual ASX outlook. "It means markets are vulnerable if there is a dramatic change - whether it's earnings or the economy." That said, valuations are not uniform across the market. Excluding the five-biggest names reduces the S&P 500's PE to about 21 times - still high, but not extreme - while an equal�'weighted S&P 500 sits closer to 17 times, near historical averages, says Murray. "That's telling you that a large part of this US market is not excessively valued, and it's very much a concentration in those tech-related names." Meanwhile Australian shares powered 11 per cent higher over the six months to September, despite dipping into correction territory during that period as growth and liquidity outweighed policy uncertainty. (Scroll down for Crispin's take on ASX reporting season.) "It's certainly been a roller coaster ... that just highlights how the market is not particularly efficient in pricing," says Murray. "At Pendal, we believe you make money by anticipating change and taking advantage of a market that has become very focused on the short term." The risks to watch Risks to the current market rating include:
US government policy is at the core of the challenges. Lower immigration is curbing population growth - a key driver of GDP - while tariffs are feeding through to prices, with roughly 40 per cent of their impact already visible in consumer prices, says Murray. Meanwhile, monetary policy remains very tight. "What that means is the outlook for the economy is quite different today than where it was at the beginning of this year. "Looking into the fourth quarter, US growth is set to be below 1 per cent, inflation heading towards 4 per cent. "It does look a lot like stagflation - and clearly, if we did have that tipping point in the economy, earnings go down, and the market won't sustain its current multiple." Positive drivers remain in place Still, that scenario appears unlikely. "Corporate profitability continues to be good," points out Murray. "This is important, because it means companies still have the ability to invest, and it also means that they're less likely to undertake substantial job-cutting programs. "There's been enormous growth in the data centre and the power area of the economy - and that is helping prop up growth. "Consumers have seen their net worth rising dramatically over the last few years, and that's estimated to support growth by between half and 1 per cent. "And the final issue, which I think is probably the most important for now, is that the policy environment - which has been negative - is turning more constructive for growth. "Five rate cuts are priced into the market, fiscal stimulus from the budget Bill next year is estimated to be close to 1 per cent positive, and clearly the US has been set up to the electoral cycle and ensuring the economy is in good shape ahead of the mid-terms. "So, we don't think we do cross that tipping point, but it's clearly a major risk." Lessons from ASX reporting season In Australia, several themes stood out in the recent full-year ASX earnings season, including high levels of post-result volatility. Somewhat unusually, the best-performing sectors during reporting season were not correlated to earnings. Resources stocks were buoyed by optimism around China, while gold stocks lifted on concerns about government financing and central bank buying. On the negative side, earnings were a driver of underperformance - led by building materials and steel where ASX companies with exposure to the US suffered weakening demand. "Overall, earnings revisions weren't that exciting but when you dig down into it, most of the negatives were quite stock specific. "It was companies that were not necessarily executing as well as they should [or] those exposed to the US. "Outside of those names, though, most companies were either reasonably comfortable with the outlook or actually quite positive. "So generally speaking, I think the outlook for earnings is stable to slightly positive as a result of what we saw in that earnings season. "We still get mid-single-digit earnings growth, which means returns aren't exciting in Australia, but we still get a reasonable outcome." Data centres a good way to play AI One question on investors' minds is the prospect of the AI boom continuing. "There is scepticism that the money being spent is not generating a return - and it's something we're watching carefully," Murray says. "But one thing I'll emphasise is that the spend is real - and the people who are investing have the money. "These hyper scalers - Amazon, Google, Microsoft, Meta and Oracle - have the financing to spend this money, and they believe they are getting a return. "Consumers are also increasingly using these products." Murray says the world has a shortage of "compute" - an industry term for the processing power, memory and storage needed to perform calculations and run applications - and this is an opportunity for Australia and particularly local data centres. "One of the challenges with investing and building data centres in Australia is access to land, access to capability, getting planning approval and getting power access. "These things mean that there is a structural under-supply of capacity in Australia, and the companies that can deliver it are very well positioned. "We still believe the market underestimates the confluence of not just AI demand, but the requirement for companies to move to the cloud to enable themselves to take part in utilising AI to run their businesses better." |
|
Funds operated by this manager: Pendal MicroCap Opportunities Fund , Pendal Global Select Fund - Class R , Pendal Sustainable Australian Fixed Interest Fund - Class R , Pendal Focus Australian Share Fund , Pendal Horizon Sustainable Australian Share Fund , Regnan Credit Impact Trust Fund , Pendal Sustainable Australian Share Fund , Pendal Sustainable Balanced Fund - Class R , Pendal Multi-Asset Target Return Fund |
|
This information has been prepared by Pendal Fund Services Limited (PFSL) ABN 13 161 249 332, AFSL No 431426 and is current as at December 8, 2021. PFSL is the responsible entity and issuer of units in the Pendal Multi-Asset Target Return Fund (Fund) ARSN: 623 987 968. A product disclosure statement (PDS) is available for the Fund and can be obtained by calling 1300 346 821 or visiting www.pendalgroup.com. The Target Market Determination (TMD) for the Fund is available at www.pendalgroup.com/ddo. You should obtain and consider the PDS and the TMD before deciding whether to acquire, continue to hold or dispose of units in the Fund. An investment in the Fund or any of the funds referred to in this web page is subject to investment risk, including possible delays in repayment of withdrawal proceeds and loss of income and principal invested. This information is for general purposes only, should not be considered as a comprehensive statement on any matter and should not be relied upon as such. It has been prepared without taking into account any recipient's personal objectives, financial situation or needs. Because of this, recipients should, before acting on this information, consider its appropriateness having regard to their individual objectives, financial situation and needs. This information is not to be regarded as a securities recommendation. The information may contain material provided by third parties, is given in good faith and has been derived from sources believed to be accurate as at its issue date. While such material is published with necessary permission, and while all reasonable care has been taken to ensure that the information is complete and correct, to the maximum extent permitted by law neither PFSL nor any company in the Pendal group accepts any responsibility or liability for the accuracy or completeness of this information. Performance figures are calculated in accordance with the Financial Services Council (FSC) standards. Performance data (post-fee) assumes reinvestment of distributions and is calculated using exit prices, net of management costs. Performance data (pre-fee) is calculated by adding back management costs to the post-fee performance. Past performance is not a reliable indicator of future performance. Any projections are predictive only and should not be relied upon when making an investment decision or recommendation. Whilst we have used every effort to ensure that the assumptions on which the projections are based are reasonable, the projections may be based on incorrect assumptions or may not take into account known or unknown risks and uncertainties. The actual results may differ materially from these projections. For more information, please call Customer Relations on 1300 346 821 8am to 6pm (Sydney time) or visit our website www.pendalgroup.com |

2 Oct 2025 - Turning turbulence into triumph: 5 themes reshaping the investment landscape
|
Turning turbulence into triumph: 5 themes reshaping the investment landscape Alphinity Investment Management September 2025 3 minutes read time |
|
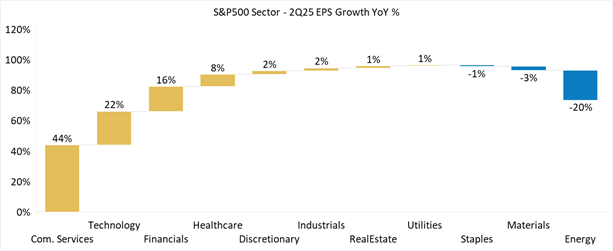
There are five powerful themes reshaping the investment landscape and driving corporate performance, creating winners and losers across global markets. The AI revolution stands as the defining narrative across global markets, driving fundamental shifts in capital allocation and valuation frameworks. But there are far more factors shaping the current investing landscape. Lower interest rate expectations and regulatory reform have reignited investor confidence, while US President Donald Trump's tariff agenda has injected supply chain uncertainty and continues to impact both corporate margins and consumer spending power. Meanwhile, geopolitical tensions are fuelling unprecedented defence spending and strategic consolidation as companies position for an increasingly fragmented world. These converging forces created a tale of two markets during the recent 2Q25 US earnings season. On the surface, the numbers appeared robust: over 80 per cent of US companies beat earnings expectations, guidance upgrades accelerated to double the 1Q25 rate, and consensus pushed earnings growth forecasts to an impressive 11 per cent and 13 per cent for 2025 and 2026, respectively. Yet beneath this veneer of strength lay a more complex reality. Earnings growth concentrated heavily within just three sectors and performance diverged sharply among industry peers. US 2Q25 Reporting Season - Strong overall growth of 12%, but largely driven by 3 sectors
Source: Bloomberg, 28 August 2025 This polarised landscape has created an unforgiving environment where companies skilfully navigating these themes are thriving, while those stumbling face harsh consequences. Five themes defining corporate performanceWe see these five powerful themes reshaping the investment landscape and these only further evolved and intensified through the latest US earnings cycle: 1. AI from speculation to implementation. While the mentions of AI remain near historic highs, business language has evolved from speculative possibilities to concrete implementation. Management teams are increasingly providing specific use cases rather than broad theoretical benefits, though most companies acknowledge they remain in the early stages of realising meaningful productivity gains. 2. Defence spending accelerates. Global defence expenditure has surged amid a pronounced strategic pivot towards deterrence capabilities and military modernisation. NATO member commitments are escalating from 2 per cent to a targeted 3.5-5 per cent of gross domestic product by 2030, exemplified by Germany's €500 billion defence infrastructure fund. Global defence spending is projected to expand at 9 per cent annually from a $2.5 trillion baseline. 3. Adapting to the tariff reality. The shift from uncertainty to operational reality has prompted comprehensive corporate responses across multiple fronts. Three-quarters of affected companies are actively restructuring supply chains and renegotiating supplier agreements, while over half are implementing customer price pass-throughs. Strategic import frontloading ahead of tariffs has complicated near-term financial interpretations. 4. Strategic M&A consolidation. Acquisition activity has intensified with a pronounced focus on strategic technology capabilities rather than traditional scale benefits. Well-capitalised companies with proven execution are pursuing disciplined transactions targeting AI competencies, industrial consolidation opportunities, and infrastructure enhancement despite broader economic uncertainties. 5. Consumers not out the woods yet. Despite some recovery from the prior quarter's sharp deterioration, consumer sentiment remains fragile with management guidance pointing to a challenging second-half outlook. Real consumer spending growth is projected at just 1 per cent annualised through H2 2025, driven by softer employment growth, tariff-induced inflation, and scheduled transfer payment reductions. This environment favours companies with defensive, non-discretionary revenue streams as price-sensitive consumers prioritise essential spending. Navigating complexityToday's investment landscape rewards execution excellence while punishing missteps, as these five forces - AI implementation, defence modernisation, tariff adaptation, strategic M&A, and consumer resilience - create clear winners and losers even within sectors. Success requires identifying companies that transform these forces into competitive advantages. As earnings dispersion widens and market patience diminishes, broad sector exposure is insufficient. Investors must focus on best-in-class operators with proven execution capabilities and structural competitive advantages that benefit from, rather than merely endure, the forces reshaping the global economy. |
|
Funds operated by this manager: Alphinity Australian Share Fund , Alphinity Concentrated Australian Share Fund , Alphinity Sustainable Share Fund , Alphinity Global Equity Fund , Alphinity Global Sustainable Equity Fund This material has been prepared by Alphinity Investment Management ABN 12 140 833 709 AFSL 356 895 (Alphinity). It is general information only and is not intended to provide you with financial advice or take into account your objectives, financial situation or needs. To the extent permitted by law, no liability is accepted for any loss or damage as a result of any reliance on this information. Any projections are based on assumptions which we believe are reasonable but are subject to change and should not be relied upon. Past performance is not a reliable indicator of future performance. Neither any particular rate of return nor capital invested are guaranteed. |

1 Oct 2025 - Renewable energy investment: gloom or boom?

30 Sep 2025 - Trip Insights: Latin America
29 Sep 2025 - New Funds on Fundmonitors.com
|
New Funds on FundMonitors.com |
|
Below are some of the funds we've recently added to our database. Follow the links to view each fund's profile, where you'll have access to their offer documents, monthly reports, historical returns, performance analytics, rankings, research, platform availability, and news & insights. |
 |
||||||||||||||||||||||
| Five V Capital Horizons Fund | ||||||||||||||||||||||
|
||||||||||||||||||||||
| View Profile | ||||||||||||||||||||||
 |
||||||||||||||||||||||
| Betashares Gold Bullion Currency Hedged ETF | ||||||||||||||||||||||
|
||||||||||||||||||||||
| View Profile | ||||||||||||||||||||||
 |
||||||||||||||||||||||
| Vinva Global Alpha Extension Fund | ||||||||||||||||||||||
|
||||||||||||||||||||||
| View Profile | ||||||||||||||||||||||
 |
||||||||||||||||||||||
| Arrowstreet Global Equity No. 1 Fund | ||||||||||||||||||||||
|
||||||||||||||||||||||
|
Want to see more funds? |
||||||||||||||||||||||
|
Subscribe for full access to these funds and over 900 others |
