
NEWS

20 Apr 2022 - Looming French presidential election
|
Looming French presidential election 4D Infrastructure April 2022 The French presidential election is underway, with a first-round vote on Sunday 10 April and the run-off between the top two candidates on Sunday 24 April.
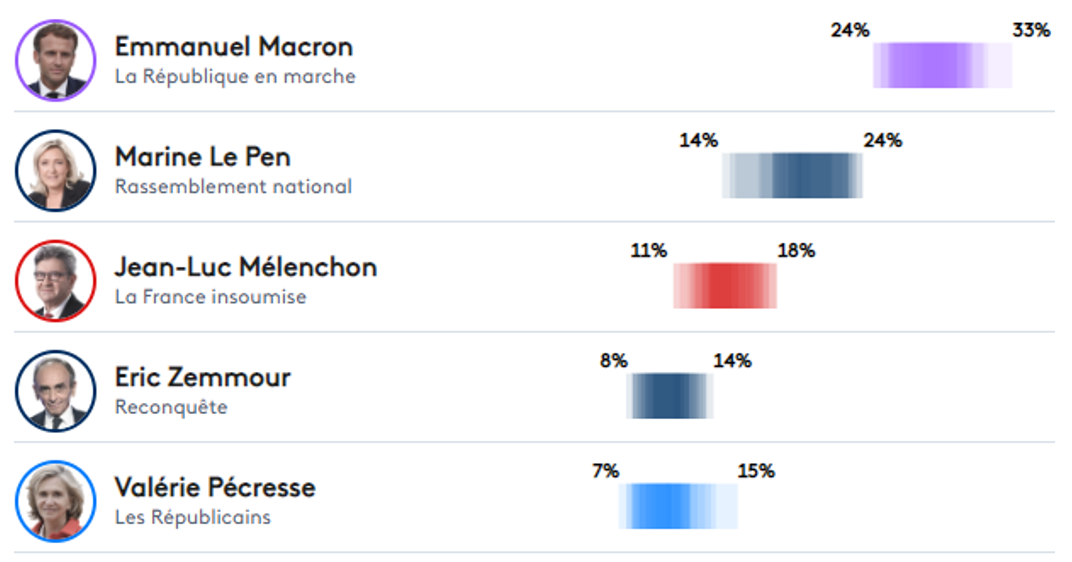
In a likely replay of 2017, the polls suggest incumbent President Emmanuel Macron will face far-right candidate Marine Le Pen in the run-off. In this piece we consider some of the key issues at play and the implications for us as infrastructure investors. Meet the candidatesFrom far-left to far-right, there are 12 official candidates for the election.
As of 2 April, opinion polls are placing Emmanuel Macron ahead with 24% to 33% of vote intentions, with the other candidates fighting for the runner-up position.
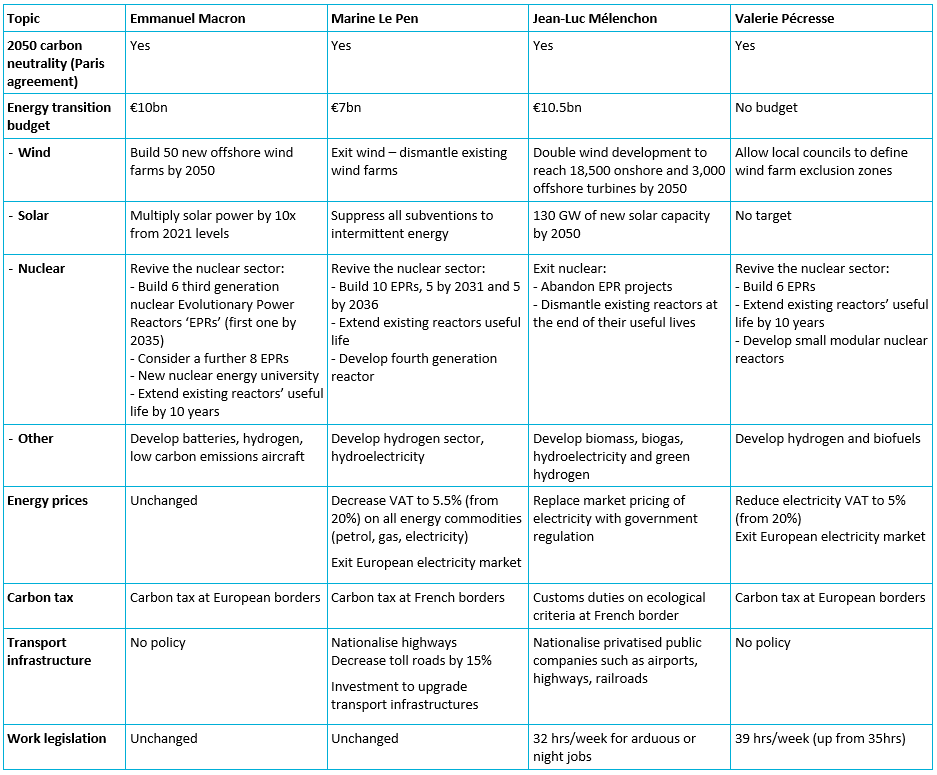
Key policy positionsThe table below summarises the key policy positions of the four leading candidates and how they may impact the current and potential future infrastructure investment environment.
Impact on infrastructure investmentIn terms of sector specifics, energy/climate policies have dominated the campaign with all candidates expressing a view - albeit quite different ones - around need, support, funding and timing of the energy transition. These policies represent potential head and tail winds for the infrastructure sub-sectors exposed, but overall it means significant investment in the sector, potentially creating many future private sector investment opportunities. Outside the energy space, the argument of private versus public ownership of the transport sector has again come into play and could have ramifications for those stocks exposed, such as Vinci, Atlantia and ADP. A second Macron termA Macron win would not alter the fundamental outlook for the infrastructure sector relative to today. However, it will cement a positive infrastructure investment cycle with more than €10bn of investment towards energy transition and Russian gas independence. The pace to renewable energy as base load power could also accelerate and benefit renewable operators such as Neoen, Voltalia, Orsted. We would expect further integration with Europe in terms of security of energy supply benefiting the integrated players. We have also seen a shift in thinking around nuclear. We expect Macron, in a second term, to revive what had been an out-of-favour sector with important investment packages to both extend the life of existing plants and develop new generation reactors (to the benefit of Engie, EDF or Vinci). Outside the energy sector, we believe the current motorway network concessions could be extended in exchange for capital expenditure commitments, supporting improved motorway efficiency and growth profiles of the key players such as Vinci or Atlantia. A Le Pen winLe Pen has dropped her controversial proposal to exit the euro, which we believe reduces the risk to the overall French economy relative to 2017. Due to the extreme nature of her economic positions, a Le Pen victory would lead to clear winners and losers in the infrastructure space. The biggest threat from a Le Pen victory would be the nationalisation of assets of listed entities with toll roads and airports clear targets, which would be detrimental to domestic listed players such as ADP and Vinci as well as foreign players with exposure to French infrastructure. Regardless of whether nationalisation is a serious threat (legally or otherwise), it would be a clear overhang for the sector - much like a potential Jeremy Corbyn victory was for the UK in 2019. Even without nationalisation, in a Le Pen victory the infrastructure sector will likely experience stricter sector regulation (as far as it is possible within the concession construct). Positively, Le Pen has expressed a willingness to pursue the energy transition. However, certain sectors are definitely not in favour (wind), and she would push for limitation of the EU influence on French energy policy. ConclusionWe are expecting a Macron/Le Pen run off with Macron ultimately re-elected for a second term. However, unless Macron can also win a majority in the parliament, we could see a fragmented legislature with increased difficulty in policy execution stalling reforms. Regardless of who wins, we see continued positive momentum in energy transition and investment as all parties work towards this common goal, and more of a status quo for the transport names with existing earnings underpinned by long-term concessions. Should Le Pen win, we would revisit our transport exposure in the near term. |
|
Funds operated by this manager: 4D Global Infrastructure Fund, 4D Emerging Markets Infrastructure FundThe content contained in this article represents the opinions of the authors. The authors may hold either long or short positions in securities of various companies discussed in the article. This commentary in no way constitutes a solicitation of business or investment advice. It is intended solely as an avenue for the authors to express their personal views on investing and for the entertainment of the reader. |


20 Apr 2022 - The Ardea Alternative - Foreign Currency Management
|
The Ardea Alternative - Foreign Currency Management Ardea Investment Management 28 March 2022 Key Portfolio Construction Trade-Offs Dr. Laura Ryan and Tamar Hamlyn are joined by Dr. Nigel Wilkin-Smith to discuss the importance of currency management for AUD investors, along with the backdrop created by the regulatory environment in superannuation, particularly the YFYS performance test. |
|
Funds operated by this manager: Ardea Australian Inflation Linked Bond Fund, Ardea Real Outcome Fund |

19 Apr 2022 - Two lessons on what to avoid in a market bubble
|
Two lessons on what to avoid in a market bubble Nikko Asset Management March 2022 Have you ever stopped to imagine what would happen if the world's central banks spent just over a decade pouring USD 25 trillion of liquidity into the economy, with more than 60% of that liquidity created in the last two years? If you are like the overwhelming majority of people, the answer is almost certainly no. The good news is you don't have to imagine as this is precisely the situation we are in today. In this article, we assess what has happened and provide some thoughts around how investors should navigate the next phase of the greatest financial experiment of all time.
USD 25 trillion is almost an unimaginable amount of money so what has happened to all of this liquidity? Well, rather inevitably, a lot of it has found its way into asset markets. The value of almost everything has gone up - considerably. From wine to whisky, growth stocks to digital gold, the returns to asset owners have been extraordinary since the depths of the financial crisis in 2009. Younger generations have gone from occupying Wall Street to trading Bitcoin on margin and buying meme stocks on trading platforms as if it were a video game. Old people "just don't get it" and lack the imagination to see just how enormous the returns will be. Make no mistake, there are many aspects of this that have the trappings of a bubble. This is nothing new. In late 1636 in the Netherlands, the Viceroy tulip bulb sold for four fat oxen, eight pigs or 12 fat sheep. As many bulbs flowered in 1637, prices crashed and by early 1638, the government decreed that tulip contracts should be annulled in return for the payment of 3.5% of the original price. There are many examples of financial speculation littered throughout history and interestingly several of these are also linked to technological innovation. Investors in railway bonds in the 19th century enabled the construction of vast networks in Europe and the US which enhanced productivity and had a huge impact on the way people lived and worked. Investors in railroads typically made little profit however, and most of the long-term gains were arguably made by the businesses and people in cities which grew up as a result of their newly connected status. The dot-com internet bubble of the late 1990s had a very similar story at its heart. Investors in the companies who built the internet networks and operated them thereafter either lost everything or made very poor long-term returns. The real beneficiaries of the networks created in the bubble were businesses like Apple, Google, Facebook, Netflix, and Amazon*, who used those networks to sell us the products and services that meant we got the most out of them. They were effectively the hotel at the end of the railway line which stood to gain the most from the passengers arriving on the newly constructed network. Is there a bubble today and if so, where is it and how can we expect things to pan out from here? The first thing that strikes us is investors' have very long-time horizons and the second is the sheer number of companies that are forecast to make significant losses for the foreseeable future. This is dangerous. The future is highly unpredictable, and far more things can happen than actually will happen. For example, if you were asked in 1969 what would be the greatest innovation in 40 years' time, you'd be forgiven for answering that humans would have colonised space and we would all be going on holiday to Mars (given Neil Armstrong had just set foot on the moon). Instead, the reality in 2009 was that the Apple iPhone was being rolled out which effectively placed the sum of all human knowledge in your pocket. We should be wary of people selling us a version of the future based on science fiction rather than practical and applicable facts.
Given the dangerous nature of these speculative businesses experiencing heavy losses and cash burn, what should we do from here? For us, understanding the drivers of cash flows and the returns on investment made by the companies we invest in is critical to the long-term health of our portfolio. By investing in businesses with strong competitive advantages who remain disciplined around capital allocation, we aim to find the next set of 'hotels at the end of the railway line' that will benefit from the new activities created by this latest bout of speculative excess. If lesson one is to avoid loss-making, cash-burning businesses chasing a pipe dream of market share, what next? In our opinion, lesson two is "beware the wolf of cyclicality wrapped up in the sheep's clothing of growth". The journey from a growth stock to a value stock can be damaging to your financial health. It strikes us that in industries such as digital advertising, investors may be mistaking a maturing industry that has seen a pull- forward of demand for one which still offers enormous secular growth. The pandemic saw an enormous amount of liquidity added to the system, and many speculative businesses received funding and/or very high valuations which they may not have otherwise. It's worth noting that a number of these new companies' costs (after generous option packages for senior staff) are spent on IT infrastructure and services, as well as digital advertising to gain market share. When you add in the pull forward of time spent at home/online for consumers in the pandemic, and inflationary pressures, it is perhaps no surprise that digital advertising in all its forms may face a more challenging outlook over the next few years. Navigating choppy watersIf we have established a few things to avoid, the obvious question remains around where are the opportunities? In our opinion, there are many businesses that have been left behind from the speculative excess of the last two years because their businesses have been negatively impacted by the pandemic which offer opportunities. In the provision of home nursing care and patient rehabilitation for example, companies such as LHC group and Encompass Health have suffered from dramatically rising costs due to a shortage of nurses exacerbated by the need for staff to quarantine following exposure to COVID-19. As the pandemic ebbs, the staffing situation is expected to normalise, and we see these companies benefitting from improving pricing as the Centers for Medicare and Medicaid Services (CMS), a US federal agency that administers the Medicare programme, has affirmed reimbursement rates which begin to take account of these near-term challenges. This should position these companies for a better 2022 while many in the digital advertising industry may face exactly the opposite scenario. Another area we feel remains underappreciated is in the provision of contract catering. Punished by stringent lockdowns and a shift away from office-based working, many of these businesses were forced to raise capital and adapt quickly to a very new reality in the pandemic. As healthcare providers, schools and universities grapple with rising costs and labour shortages, they are now outsourcing their catering operations at a record pace and the pipeline of new business for a company like Compass has never been better. Also, consumption at stadiums where the firm has many concessions is booming as people make the most of attending live sports and cultural events. These businesses are reinvesting for structural growth, but many investors perceive them to be too old hat to be interesting. 'Boring' improvements in return on capital might be just the menu item investors should choose in what may continue to be a challenging 2022. Valuation rationality and margin for safetyWe have highlighted that we have been experiencing some speculative excesses within parts of the equity markets for some time, and there have been some clear parallels to historical bubbles. Our philosophy is focused on compounding clients' capital over time rather than being a slave to the shorter-term gyrations of the market. We focus on the following:
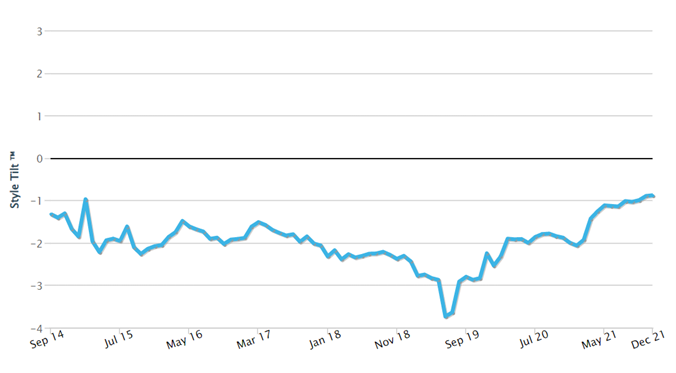
The latter point has been more relevant for portfolios in the last 12-18 months, as we have been in a period where easy monetary policy has encouraged investors to price future growth very generously. This has resulted in reductions in some holdings or a complete exit on valuation grounds, with the proceeds recycled into Future Quality companies that have better valuation support. We are comfortable paying a premium for companies that deliver better and more consistent growth, can attain, and sustain high returns on invested capital and have strong balance sheets - but that premium needs to be appropriate and fair. The following history from style analytics confirms that we have stuck to that discipline. Chart 1: Cash Flow Yield
Source: Style Analytics as at 31 December 2021
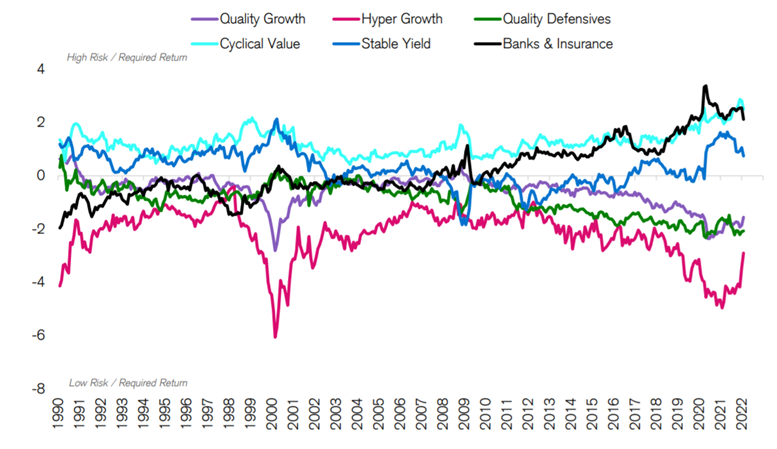
We believe we have entered an unknown period of tightening liquidity, with the evolution of supply-related inflationary inputs and central bank responses remaining the dominant drivers for returns from and within equities as an asset class. History would suggest that following an unwind from periods of excess, the prior winners typically don't regain leadership again. Given the lack of profitability of many companies that some have described as 'concept finance', this makes sense, as over the long term the delivery of cash flow and growth is the key determinant on share prices. Chart 2: Group Median Market Implied Yield (MIY) Spread vs Market
Source: Credit Suisse HOLT, Data date 2/4/2022. Universe: Top 2000 Global companies by TTM Market cap. Market Implied Yields for Financial firms on the HOLT CFROE model are trimmed by 150 bps throughout this analysis to preserve comparability.Chart 2 highlights that the growth versus value debate dominating many conversations is becoming less important for most companies. except for those with very high growth expectations. The path of future growth and profitability will likely soon start to dominate again as the driver for individual share prices once the current period of unwinding and rotation has exhausted. We believe our portfolio of Future Quality stock picks should be well placed when that time arrives. *Reference to individual stocks is for illustration purpose only and does not guarantee their continued inclusion in the strategy's portfolio, nor constitute a recommendation to buy or sell.Author: Iain Fulton (Portfolio Manager) and Will Low (Head of Global Equities), Nikko AM, Yarra Capital Management's global partner Funds operated by this manager: Nikko AM ARK Global Disruptive Innovation Fund, Nikko AM Global Share Fund, Nikko AM New Asia Fund, Disclaimer This material has been prepared by Nikko Asset Management Europe Ltd (NAM Europe) which is authorised and regulated in the United Kingdom by the FCA. This material is issued in Australia by Yara Capital Management Limited (formerly Nikko AM Limited) ABN 99 003 376 252, AFSL 237563. To the extent that any statement in this material constitutes general advice under Australian law, the advice is provided by Yarra Capital Management Limited. NAM Europe does not hold an AFS Licence. Effective 12 April 2021, Yarra Capital Management Limited became part of the Yarra Capital Management Group. The information contained in this material is of a general nature only and does not constitute personal advice, nor does it constitute an offer of any financial product. It is for the use of researchers, licensed financial advisers and their authorised representatives, and does not take into account the objectives, financial situation or needs of any individual. For this reason, you should, before acting on this material, consider the appropriateness of the material, having regard to your objectives, financial situation and needs. The information in this material has been prepared from what is considered to be reliable information, but the accuracy and integrity of the information is not guaranteed. Figures, charts, opinions and other data, including statistics, in this material are current as at the date of publication, unless stated otherwise. The graphs and figures contained in this material include either past or backdated data and make no promise of future investment returns. Past performance is not an indicator of future performance. Any economic or market forecasts are not guaranteed. Any references to particular securities or sectors are for illustrative purposes only and are as at the date of publication of this material. This is not a recommendation in relation to any named securities or sectors and no warranty or guarantee is provided. Portfolio holdings may not be representative of current or future investments. The securities discussed may not represent all of the portfolio's holdings and may represent only a small percentage of the strategy's portfolio holdings. Future portfolio holdings may not be profitable. Any mention of an investment decision is intended only to illustrate our investment approach or strategy and is not indicative of the performance of our strategy as a whole. Any such illustration is not necessarily representative of other investment decisions. Portfolio holdings may change by the time you receive this. Any reference to a specific company or security does not constitute a recommendation to buy, sell, hold, or directly invest in the company or its securities. The information set out has been prepared in good faith and while Yarra Capital Management Limited and its related bodies corporate (together, the "Yarra Capital Management Group") reasonably believe the information and opinions to be current, accurate, or reasonably held at the time of publication, to the maximum extent permitted by law, the Yarra Capital Management Group: (a) makes no warranty as to the content's accuracy or reliability; and (b) accepts no liability for any direct or indirect loss or damage arising from any errors, omissions, or information that is not up to date. Yarra Capital Management. Copyright 2022. |


14 Apr 2022 - Megatrend in Focus: Enterprise Digitisation is accelerating
|
Megatrend in Focus: Enterprise Digitisation is accelerating Insync Fund Managers March 2022 Whilst we focused on this exciting megatrend and Accenture last year, things are moving even faster than forecast and so a revisit is timely. Accenture is a prime holding for this megatrend and thus remains in the Insync portfolio. In their recent earnings call, they announced a very strong demand environment. This has induced double-digit growth in all parts of their business and also across all their markets, industries and services. Many of their clients are embarking upon bold transformation programs, often spanning multiple parts of their enterprise in an accelerated time frame. Macro-economics have little impact on these companies spend on digitisation. These clients recognize the need to transform almost all of their businesses, meshing technology, data and AI and with new ways of working and delivering their product or service to market. Current market gyrations have not changed the trajectory of our identified megatrends (including this one) in the Insync portfolio. Our companies such as Accenture continue to grow profitably at multiples many times that of GDP.
Insync's intense focus on the fundamentals, investing in businesses like Accenture that are compounding their earnings at high rates, gives us confidence that the portfolio is well positioned to deliver strong returns as volatility in markets subside. Stocks held by Insync possess:
Funds operated by this manager: Insync Global Capital Aware Fund, Insync Global Quality Equity Fund |


13 Apr 2022 - Central banks are going green to questionable avail while stirring risks
|
Central banks are going green to questionable avail while stirring risks Magellan Asset Management March 2022
Finland's forests, which cover more than 70% of the country, are the subject of a continent-wide debate on how to halve EU carbon emissions by 2030. Policymakers, environmentalists, companies and the public are arguing over whether the forests should remain untouched, and thus absorb carbon, or be used as biomaterial.[1] Environmentalists want the woodlands in Europe's most-forested country to remain pristine carbon 'sinks'. Finland's government, companies, especially the ones that help forestry products generate 20% of the country's exports, and much of the public want to find commercially viable solutions that alleviate warming risks. That an EU proposal released in mid-2021 favoured the carbon-sink option only intensified the debate. Perhaps the European Central Bank could sort it out? During the dispute over the forests in the euro-member Finland, the ECB declared mitigating climate change was a priority. The central bank said it will embed environmental goals within monetary policy because wild and warmer weather can affect "inflation, output, employment, interest rates, investment and productivity; financial stability; and the transmission of monetary policy".[2] The Bank of England,[3] the Bank of Japan,[4] the Federal Reserve[5] and Sweden's Riksbank[6] are among central banks to mix sustainability and monetary goals to different extents. They are among the 83-member Central Banks and Supervisors Network for Greening the Financial System that seeks to "mobilise mainstream finance to support the transition toward a sustainable economy". As part of their green focus, central bankers are calling for net-zero-emissions targets. As they warn of climate systemic risks, central bankers are seeking to use their regulatory powers to enforce climate-risk-based capital standards on banks, conduct climate-change stress tests on financial institutions and force companies to disclose carbon risks. They are under pressure to 'green' the corporate-bond portfolios they have amassed under quantitative-easing programs.[7] To propel the sustainable shift, governments are appointing climate-aware people to central-bank leadership roles. US President Joe Biden this year, to cite a prominent example, nominated former Fed governor Sarah Raskin to be the Fed's vice chair of supervision of the board of governors.[8] In 2020, Raskin slammed the Fed for giving emergency pandemic relief to "dying" fossil-fuel companies.[9] In 2021, she urged financial regulators to exercise their "existing powers" to mitigate climate change.[10] (Such comments appeared to prompt the Senate in March to block her appointment.) Many ask whether it's wise for central banks, which style themselves as above politics, to charge into an issue that governments are struggling to solve because, while the science is not contentious, the politics are. Amid such discussions, two questions stand out. The first is: Will central banks accomplish anything? Those who advocate that central banks consider climate risks say standardising climate-related disclosures and making them mandatory could improve the pricing of climate risks. They say central banks highlighting the long-term financial risks of climate change can only help the public swing behind a solution towards net-zero emissions. They say that central banks can embolden the stability of the financial system over the long term by limiting banking crises caused by a sustained change in weather patterns. Advocates say central banks elevating climate risks would make commercial banks more wary of adding to (and they might even reduce) the US$3.8 trillion major banks have committed to the fossil-fuel industry.[11] Some factors, however, suggest central banks might achieve less than they hope. First, it can be argued that climate change poses little risk to financial stability. Bushfires, droughts, heat waves, rising and warmer oceans, storms and the like have never in modern times triggered a systemic financial crisis.[12] The industries that lose from the shift to a low-carbon economy (so-called stranded assets) are unlikely to imperil the financial system either. It's usually the next big things that bubble to the point of threatening financial stability.[13] A study of financial crises, This time is different by Carmen Reinhard and Kenneth Rogoff, found one common theme behind eight centuries of financial folly; "excessive debt accumulation".[14] The second, perhaps surprising, reason central banks might make little headway for the environment is that banks don't appear to have been threatened by climate change and they seem capable of judging such risks for themselves. A 2021 Fed Bank of New York study of declared US disasters from 1995 to 2018 found US banks have learnt to manage climate risks and they gain from calamities. The study found that banks are adept at avoiding loans for, say, homes in harm's way and benefit from lending for rebuilding, "which actually boosts profits at larger banks". The study noted its findings "are generally consistent" with other studies on bank stability and disasters, even one conducted on banks in the hurricane-prone Caribbean.[15] The results, however, might be different if the world experiences a watershed increase in temperature. Third, central banks elevating the consideration of climate risks is unlikely to be a telling blow to fossil-fuel companies. If commercial banks were to restrict lending to or increase interest-rate charges for fossil-fuel companies, private financial firms are likely to buy these businesses cheaply, especially in the absence of a price on carbon. The Economist estimates that private equity firms have swooped on US$60 billion of dirty assets in the past two years.[16] Fourth, central banks have little legal basis on which to act on green lines.[17] Central banks lack authority to direct bank lending. Parliaments could give central banks these capabilities but it's likely such efforts would be as stillborn as most political efforts to mitigate the climate emergency. In the meantime, central banks can only target net-zero emissions - almost indirectly - by using their regulatory powers to highlight financial-stability risks. Last, there appears to be no link between interest-rate settings and a long-term meteorological event. "When it comes to saving the planet, central banks do not have a magic wand," says Jens Weidmann, former head of the Bundesbank (2011-2021).[18] The other overarching question with central banks going green is: What are the risks? The first is that central-bank climate risk management could clash with their mandates to keep inflation tame over the short and long term. The shift to a net-zero-emissions world stirs what economists call 'greenflation'. This is the term for when fossil-fuel prices jump because investment in climate-harming energy has fallen but demand for dirty power hasn't. Greenflation is already rife in Europe, especially the UK. The second hazard is that central banks might be adopting an explicit role of capital allocation, which breaches their principle of 'market neutrality'. Their climate stress tests, for example, might force banks to pull back from fossil-fuel assets. They are toying with tilting their asset-buying towards sustainable assets - something a Bank of England paper says defies calibration.[19] While central banks control the quantity of money, the allocation of money is a political choice for governments. Smudge the role of central banks and politicians and central-bank credibility and independence could be lost. A theoretical risk is that central banks might encourage a green investment bubble on that could metastasise into a systemic threat - think of it as a central-bank 'green put', even if there is no sign of one emerging. A fourth concern is that central banks might be in danger of 'mission creep', at the cost of their focus on inflation. What, for instance, is stopping central banks pursuing other worthy social goals such as reducing inequality (which is made worse by their quantitative easing)? Setting aside the debate about what central banks might accomplish, the risks show the use of public regulatory powers is a poor substitute for political solutions, even when none are appearing. The problem arising when government institutions step in because politicians can't sort out competing rights is that these bodies become politically tainted. It is best that central banks don't let climate-change priorities get in the way of their traditional tasks, which are hard enough to get right. To be sure, central banks recognise that governments and parliaments have "primary responsibility" to act on climate change.[20] Central banks certainly have a role in managing the short-term costs of combating climate change, especially greenflation. Government policies to mitigate the climate emergency could hurt the economy to the point of creating financial instability. But that's different from saying changed weather and stranded assets could. Central-bank stress testing demands higher capital requirements for credit cards and auto loans than for home loans or the highest-rated companies. It thus could be argued that central banks are already allocating capital and all they seek to do is extend those responsibilities to mitigating the impact of climate risks on the banking system. Plenty of studies, such as one in 2021 from the US's Financial Stability Oversight Council, warn that climate change poses "an emerging and increasing threat" to financial stability.[21] What is more certain is the solutions to achieving net-zero emissions need to come from the political process - where they are being thrashed out for Finland's forests. The conflict of interest UK Prime Minister Boris Johnson this year has faced the threat of a leadership challenge as fellow Conservative MPs (and the public) sickened of endless scandals. These outrages included that Downing Street partied at the height of the pandemic while enforcing strict social restrictions that even prevented relatives being with the dying. They included allegations that Johnson approved the evacuation of zoo animals from Afghanistan while UK nationals were left behind when the Taliban last July took control of the country. The issue, however, commentators said, shaping as the most damaging blow for Johnson is economic. In February, the energy regulator told UK households their electricity and natural-gas bills could soar 54% come April when regulatory price caps are adjusted for prevailing prices. The average household's annual utility bill is forecast to jump by 700 pounds to about 2,000 pounds.[22] Energy prices are surging in the UK because the net-zero-emissions Johnson administration has deterred investment in fossil-fuel energies and renewable-energy companies are struggling to produce enough power to make up for the shortfall in climate-damaging-generated power. (One mishap was that an unusual lack of wind failed to power wind farms while Russia's invasion of Ukraine has only added to energy costs.) The higher power bills come with another blow for UK household budgets. The other battering is higher interest rates. In March, the Bank of England raised its key rate for the third consecutive month. The central bank in March lifted its benchmark rate by 25 basis points to 0.75% because it expects higher energy prices, exacerbated by Russia's invasion of Ukraine, to drive annual inflation above 8% within months. The most recent report shows that steeper energy costs boosted UK inflation to 6.2% in the 12 months to February, a 30-year high and more than triple the Bank of England's 2% inflation ceiling. This situation encapsulates the greatest quandary for central banks. Policies such as carbon pricing to reduce the production and usage of fossil fuels are likely to boost inflationary pressures (even if it only shows up directly as a one-off jump in inflation gauges). The greatest contribution central banks might make in the quest to mitigate climate change could be to ensure their economies flourish in a low-inflationary way over the longer term, while ensuring financial stability. That would create the most favourable milieu for the political process to tackle climate change, as messy, protracted and contentious as that method might be. See the debate over Finland's forests. Author: Michael Collins, Investment Specialist |
|
Funds operated by this manager: Magellan Global Fund (Hedged), Magellan Global Fund (Open Class Units) ASX:MGOC, Magellan High Conviction Fund, Magellan Infrastructure Fund, Magellan Infrastructure Fund (Unhedged), MFG Core Infrastructure Fund [1] See, 'Finland's forests fire up debate over EU's strategy for going green.' Financial Times. 1 September 2021. ft.com/content/b7e8ae66-f002-4361-84eb-6888ded2ec87 [2] European Central Bank. 'ECB presents action plan to include climate change considerations in its monetary policy strategy.' Media release. 8 July 2021. ecb.europa.eu/press/pr/date/2021/html/ecb.pr210708_1~f104919225.en.html [3] Bank of England. 'Climate change.' bankofengland.co.uk/climate-change [4] Bank of Japan. 'Climate change.' boj.or.jp/en/about/climate/index.htm/ [5] The Federal Reserve. 'Climate change and financial stability.' 19 March 2021. federalreserve.gov/econres/notes/feds-notes/climate-change-and-financial-stability-20210319.htm [6] Sveriges Riksbank. 'Sustainability strategy for the Riksbank.' 16 December 2020. ypfsresourcelibrary.blob.core.windows.net/fcic/YPFS/sustainability-strategy-for-the-riksbank.pdf [7] Bank of England 'Climate change' for its climate goals. bankofengland.co.uk/climate-change [8] The White House. 'President Biden nominates Sarah Bloom Raskin to serve as vice chair for supervision of the Federal Reserve and Lisa Cook and Philip Jefferson to serve as governors.' 14 January 2022. .gov/briefing-room/statements-releases/2022/01/14/president-biden-nominates-sarah-bloom-raskin-to-serve-as-vice-chair-for-supervision-of-the-federal-reserve-and-lisa-cook-and-philip-jefferson-to-serve-as-governors/ [9] Sarah Raskin. 'Why is the Fed spending so much money on a dying industry?' 28 May 2020. nytimes.com/2020/05/28/opinion/fed-fossil-fuels.html [10] Sarah Raskin. 'Changing the climate of financial regulation.' Project Syndicate. 10 September 2021. project-syndicate.org/onpoint/us-financial-regulators-climate-change-by-sarah-bloom-raskin-2021-09 [11] World Economic Forum. 'How central banks are tackling climate change risks.' 4 May 2021. weforum.org/agenda/2021/05/central-banks-tackling-climate-change-risks/ [12] SeeJohn Cochrane. 'The fallacy of climate change risk.' Project Syndicate. 21 July 2021. project-syndicate.org/commentary/climate-financial-risk-fallacy-by-john-h-cochrane-2021-07. See also, 'Could climate change trigger a financial crisis?'. 4 September 2021. The Economist. economist.com/finance-and-economics/2021/09/04/could-climate-change-trigger-a-financial-crisis [13] A problem could arise if climate regulations ensured rapid collapses. But governments would be at fault then, not central bankers. [14] Carmen Reinhard and Kenneth Rogoff. 'This time is different'. Princeton University Press. 2009. See preface. [15] Federal Reserve Bank of New York. 'How bad are weather disasters for banks?' November 2021. Revised January 2022. newyorkfed.org/research/staff_reports/sr990 [16] The Economist. 12 February 2022. 'The truth behind dirty assets.' economist.com/leaders/2022/02/12/the-truth-about-dirty-assets [17] Congress, for example, has given the Fed a triple mandate to achieve "maximum employment, stable prices and moderate long-term interest rates. The triple mandate is often referred to as a 'dual mandate' because people ignore the goal of moderate rates. See the Federal Reserve. 'Federal Reserve Act.' 'Section 2A. Monetary policy objectives. federalreserve.gov/aboutthefed/section2a.htm [18] Jens Weidmann. 'Bundesbank chief: How central banks should address climate change.' Financial Times. 19 November 2020. ft.com/content/ed270eb2-e5f9-4a2a-8987-41df4eb67418 [19] Bank of England. 'Options for greening the Bank of England's Corporate Bond Purchase Scheme.' 21 May 2021. bankofengland.co.uk/paper/2021/options-for-greening-the-bank-of-englands-corporate-bond-purchase-scheme [20] European Central Bank. Op cit. [21] US Department of the Treasury. 'Financial Stability Oversight Council identifies climate change as an emerging and increasing threat to financial stability.' 21 October 2021. home.treasury.gov/news/press-releases/jy0 telegraph.co.uk/business/2022/02/13/net-zero-may-become-divisive-brexit/ [22] See Liam Halligan. 'Net zero' may become as divisive as Brexit.' The Telegraph. 13 February 2022. telegraph.co.uk/business/2022/02/13/net-zero-may-become-divisive-brexit/ Important Information: This material has been delivered to you by Magellan Asset Management Limited ABN 31 120 593 946 AFS Licence No. 304 301 ('Magellan') and has been prepared for general information purposes only and must not be construed as investment advice or as an investment recommendation. This material does not take into account your investment objectives, financial situation or particular needs. This material does not constitute an offer or inducement to engage in an investment activity nor does it form part of any offer documentation, offer or invitation to purchase, sell or subscribe for interests in any type of investment product or service. You should read and consider any relevant offer documentation applicable to any investment product or service and consider obtaining professional investment advice tailored to your specific circumstances before making any investment decision. A copy of the relevant PDS relating to a Magellan financial product or service may be obtained by calling +61 2 9235 4888 or by visiting www.magellangroup.com.au. Past performance is not necessarily indicative of future results and no person guarantees the future performance of any strategy, the amount or timing of any return from it, that asset allocations will be met, that it will be able to be implemented and its investment strategy or that its investment objectives will be achieved. This material may contain 'forward-looking statements'. Actual events or results or the actual performance of a Magellan financial product or service may differ materially from those reflected or contemplated in such forward-looking statements. This material may include data, research and other information from third party sources. Magellan makes no guarantee that such information is accurate, complete or timely and does not provide any warranties regarding results obtained from its use. This information is subject to change at any time and no person has any responsibility to update any of the information provided in this material. Statements contained in this material that are not historical facts are based on current expectations, estimates, projections, opinions and beliefs of Magellan. Such statements involve known and unknown risks, uncertainties and other factors, and undue reliance should not be placed thereon. Any trademarks, logos, and service marks contained herein may be the registered and unregistered trademarks of their respective owners. This material and the information contained within it may not be reproduced, or disclosed, in whole or in part, without the prior written consent of Magellan. |


12 Apr 2022 - New Funds on Fundmonitors.com
|
New Funds on FundMonitors.com |
|
Below are some of the funds we've recently added to our database. Follow the links to view each fund's profile, where you'll have access to their offer documents, monthly reports, historical returns, performance analytics, rankings, research, platform availability, and news & insights. |
|
|
||||||||||||||||||||||||||||
| Quay Global Real Estate Fund (AUD Hedged) | ||||||||||||||||||||||||||||
|
||||||||||||||||||||||||||||
|
||||||||||||||||||||||||||||
| Talaria Global Equity Fund - Currency Hedged (Managed Fund) | ||||||||||||||||||||||||||||
|
||||||||||||||||||||||||||||
| View Profile | ||||||||||||||||||||||||||||
 |
||||||||||||||||||||||||||||
|
Metrics Credit Partners Wholesale Investments Trust |
||||||||||||||||||||||||||||
|
||||||||||||||||||||||||||||
| View Profile | ||||||||||||||||||||||||||||
|
|
||||||||||||||||||||||||||||
| Merkle Tree Capital Digital Asset Fund | ||||||||||||||||||||||||||||
|
||||||||||||||||||||||||||||
| View Profile | ||||||||||||||||||||||||||||
|
|
||||||||||||||||||||||||||||
| ListedReserve Managed Fund | ||||||||||||||||||||||||||||
|
||||||||||||||||||||||||||||
| View Profile | ||||||||||||||||||||||||||||
|
Want to see more funds? |
||||||||||||||||||||||||||||
|
Subscribe for full access to these funds and over 650 others |
||||||||||||||||||||||||||||


12 Apr 2022 - Russia-Ukraine conflict
|
Russia-Ukraine conflict 4D Infrastructure March 2022 The politics Putin's reasoning behind the Russian invasion of Ukraine seems principally related to Ukraine's potential desire to join the North Atlantic Treaty Organisation (NATO), and Putin seeing this as a threat to Russia. The Western world quickly united (including the traditionally neutral Switzerland) in opposing Russia's actions and introducing a broad array of sanctions. NATO is unlikely to directly assist Ukraine militarily as Ukraine is not a member, and such an intervention would lead to the first ever direct conflict between two nuclear armed super-powers. Hence the importance and extent of the non-military, economic and political sanctions. If the sanctions can effectively target and hurt wealthy Russians, then they may also ultimately influence Putin, or a social movement to oust him. Further afield, China's Xi Jinping will be watching the evolving situation - and importantly, the West's response - closely. Our view is that Xi's biggest concern is domestic social unrest, which could derail his leadership. As such, we don't believe he can achieve this by supporting Russia (discussed further below). However, nor do we believe China will condemn Russia. 4D's exposure to Russia 4D has never had any direct exposure to Russian securities. Our investment process incorporates a country review process, which looks at four key parameters (economic, financial, political and ESG risks) to determine whether we believe a country is an acceptable investment destination. This review is undertaken before we even look at assets within that country. Russia is graded Red (uninvestible) under our process, and has been so since our initial review in 2015, when 4D began. The principal reason for this is Russia's invasion of Crimea in 2014 and its subsequent annexation. International sanctions were imposed (and remain) on Russia as a result of that aggressive action. While they are nowhere near as extensive as today's, they clearly indicated unacceptable behaviour - hence the Red grading and no core exposure to Russian assets (see Annexure for the short form of our 2021 Russian country review). As a consequence of the more recent sanctions, we reviewed our portfolio for any exposure to Russian assets, no matter how negligible. We placed trading restrictions on any exposed positions until companies had confirmed an exit from Russia or a writedown of assets to zero (where exit was not immediately possible), as we expect all our portfolio positions to support the current democratic stance against the invasion. As a result, negligible exposure has now been written off or the stock is restricted. Global economic implications of the Russian invasion IMF[1] analysis suggests that, in addition to the suffering and humanitarian crisis from Russia's invasion of Ukraine, the entire global economy will feel the effects of slower growth and faster inflation. The IMF identified three main channels through which impacts will flow.
The IMF added that, while some effects may not fully come into focus for many years, there are already clear signs that the war and resulting jump in costs for essential commodities such as oil will make it harder for policymakers in some countries to strike the delicate balance between containing inflation and supporting the economic recovery from the ongoing COVID pandemic. China's response There are concerns that China may provide assistance to Russia in its invasion of Ukraine. This could lead to the imposition of sanctions on China, similar to those imposed on Russia. At a virtual meeting on Friday 18 March 2022, US President Biden warned Chinese President Xi of possible 'consequences' for supporting Russia; and Chinese President Xi indicated that 'The Ukraine crisis is not something we want to see'. He added that the events again show that countries should not come to the point of meeting on the battlefield. Conflict and confrontation are not in anyone's interest, and peace and security are what the international community should treasure the most. Why would China assist Russia in Ukraine? Reasons could include global politics and ensuring Russia's future political and potential military support of China. It would also underpin a powerful military alliance balanced against the might of US/NATO in Europe. China may also see business opportunities in Russia given the economic void created by the sanctions. Why wouldn't China support Russia in Ukraine? Put simply, economics, domestic politics and China's self interest. Differing global GDP positions In considering whether China would support Russia in the Ukraine war it is important to acknowledge that China's position in the global economy is vastly different to that of Russia. China is the world's second-largest economy behind the US, with a GDP of US$14.9 trillion in 2020 (~17.8% of global GDP). Russia is only the 11th largest economy in the world, with a GDP of US$1.48 trillion (~1.74% of global GDP). By way of comparison, Australia has a GDP of US$1.35 trillion (~1.7% of global GDP)[2]. With this economic context, there is far less incentive for China to risk its globally dominant economic position to engage in a major conflict at this point in time. China and global trade[3] International trade is the lifeblood of the world economy, but is subject to constant change from economic, political and environmental forces. Emerging economies have seen their share of total global trade rocket in recent years. China's economic interests are different from its security concerns. China is deeply integrated into the global economy. Its share of global trade has increased significantly during the global pandemic, as has its share of global direct investment inflows. China's share in global trade at the end of 2021 was about 17%, and its share in global direct investment inflows at the end of 3Q21 was ~19%. Its total trade flows, which exceeded $US6 trillion last year, dwarf those of Russia. China's firms and leadership are aware that major efforts to support Russia and violate existing sanctions could bring down secondary sanctions on them, especially if such support were to include military assistance. Russia is vulnerable to such sanctions; China would be even more exposed. Below is a table highlighting China's 15 top trading partners in terms of export sales. That is, these countries imported the most Chinese shipments by US$ value during 2020. Also shown is each import country's percentage receipt of total Chinese exports.
Source: China's Top Trading Partners 2020 (worldstopexports.com) Notably: Clearly, any trade sanctions imposed on China by the US or the rest of the world would have a material negative impact on its economy. Chinese domestic politics In summary The domestic political and economic case for China to avoid supporting Russia in the Ukraine war, and risk severe sanctions from the rest of the world, is clear. Unfortunately, rational, humane decision-making has not been a feature of the Ukraine war so far, and we continue to monitor the situation closely. Impact on infrastructure In broader sector terms, we have assessed the immediate and longer-term impact on infrastructure assets in terms of direct and indirect consequences of the current conflict. Energy The conflict has seen an immediate and sharp increase in power prices across Europe as the flow of Russian gas is disrupted and countries scramble to source alternative fuel sources. In the short term this could see coal re-enter the generation mix. Over the medium to longer term we see alternative gas sources being secured, the development/extension of nuclear generation, and further fast-tracking of renewable generation as countries look to balance the social needs of their populous with decarbonisation goals. Those utilities exposed to merchant pricing will be directly and immediately impacted by rising prices, which is a core reason why we don't regard merchant energy as 'infrastructure'.
Transport Immediate impacts of the conflict can be felt in the transport space, due to closure of air space and ports as well as the disruption in commodity sources and supply chains.
As discussed above, inflation will remain high given the contribution of energy in the CPI bucket, which continues to favour transport names (as well as real rate utilities) that have an explicit inflation hedge. However, a significant jump in fuel prices around the globe has a number of flow-on effects to infrastructure names.
Chart 1: Sensitivity of Italian motorway traffic to fuel prices
Source: Mediobanca Chart 2: Sensitivity of Italian motorway traffic to GDP growth Source: Mediobanca
Conclusion The situation in Ukraine is, above all else, a major concern from a humanitarian and global stability standpoint. The positive aspect so far is just how fast the Western world has united in opposing Russia's actions, introducing a large and diverse suite of sanctions designed to punish Russia economically and isolate it internationally. Potentially there are more sanctions to come. While it will be a matter of waiting to see how effective sanctions are in influencing Russia's behaviour, from an investment perspective there are some clear near-term negative impacts (fuel prices, energy costs and inflation uptick), but also some short-term and long-term relative winners in the infrastructure space, including user pay assets (inflation link), rail (increased competitiveness and soft commodity exposure), energy infrastructure (volume support) and utilities building for the future (integrated and pure play regulated utilities). As always, 4D looks to maintain a diversified (regional and sector) portfolio of the best combination of value and quality within the infrastructure sector. At the same time, we look capitalise on long-term infrastructure thematics while remaining cognisant of near-term head and tail winds, including the current conflict and resultant political and economic responses. |
||||||||||||||||||||||||||||||||||||||||||||||||||||||||||||||||||||
|
Funds operated by this manager: 4D Global Infrastructure Fund, 4D Emerging Markets Infrastructure Fund[1] 'War in Ukraine Reverberates Around World', IMF Weekend Read, 19 March 2022 [2] Source - Stastistics.com [3] SMH 16 March 2022: 'As China quietly joins sanctions against Russia, Xi night be too rational to risk arming Putin'. Tianlei Huang and Nicholas R. Lardy are China experts with the Peterson Institute for International Economics, a Washington-based think tank. [4] Cheniere announced on 9 March 2022 that it had agreed to amend the LNG sale and purchase agreement it has with Engie to increase the contracted volumes and extend the term of the agreement. [5] Published in 2021 by BIMCO and International Chamber of Shipping (ICS)
The content contained in this article represents the opinions of the author/s. The author/s may hold either long or short positions in securities of various companies discussed in the article. This commentary in no way constitutes a solicitation of business or investment advice. It is intended solely as an avenue for the author/s to express their personal views on investing and for the entertainment of the reader. This information is issued by Bennelong Funds Management Ltd (ABN 39 111 214 085, AFSL 296806) (BFML) in relation to the 4D Global Infrastructure Fund and 4D Emerging Markets Infrastructure Fund. The Funds are managed by 4D Infrastructure, a Bennelong boutique. This is general information only, and does not constitute financial, tax or legal advice or an offer or solicitation to subscribe for units in any fund of which BFML is the Trustee or Responsible Entity (Bennelong Fund). This information has been prepared without taking account of your objectives, financial situation or needs. Before acting on the information or deciding whether to acquire or hold a product, you should consider the appropriateness of the information based on your own objectives, financial situation or needs or consult a professional adviser. You should also consider the relevant Information Memorandum (IM) and or Product Disclosure Statement (PDS) which is available on the BFML website, bennelongfunds.com, or by phoning 1800 895 388 (AU) or 0800 442 304 (NZ). Information about the Target Market Determinations (TMDs) for the Bennelong Funds is available on the BFML website. , ... |
||||||||||||||||||||||||||||||||||||||||||||||||||||||||||||||||||||

12 Apr 2022 - The Rate Debate - Episode 26
|
The Rate Debate - Episode 26 Yarra Capital Management 06 April 2022 How high and how fast can rates go? The RBA expects to see economic data that will drive them to hike interest rates earlier than expected. Markets have already jumped the gun and priced future hikes into bond prices. Is the economy as strong as central banks believe, and will interest rates go up as aggressively as the market suggests? Tune in to hear Darren and Chris discuss this in episode 26 of The Rate Debate. |
|
Funds operated by this manager: Yarra Australian Equities Fund, Yarra Emerging Leaders Fund, Yarra Enhanced Income Fund, Yarra Income Plus Fund |

11 Apr 2022 - Global stocks provide clues to accelerating inflation
|
Global stocks provide clues to accelerating inflation Janus Henderson Investors April 2022 Key Takeaways
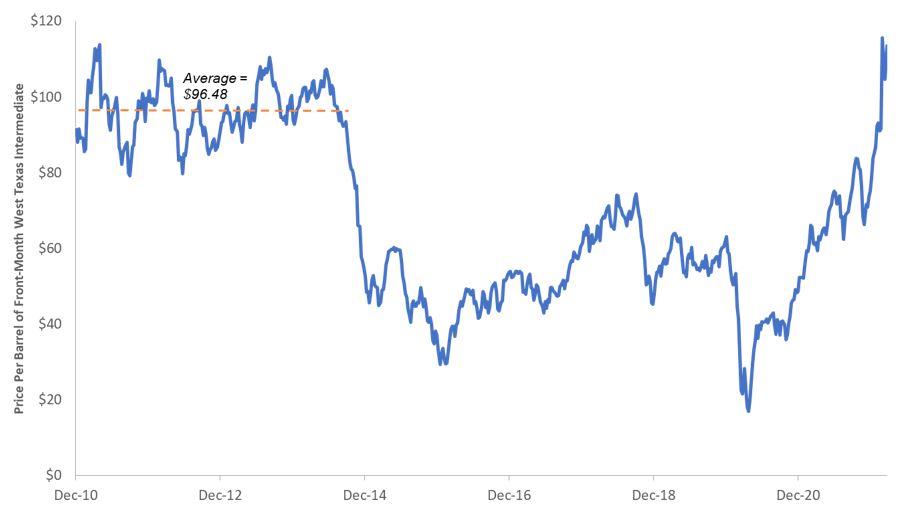
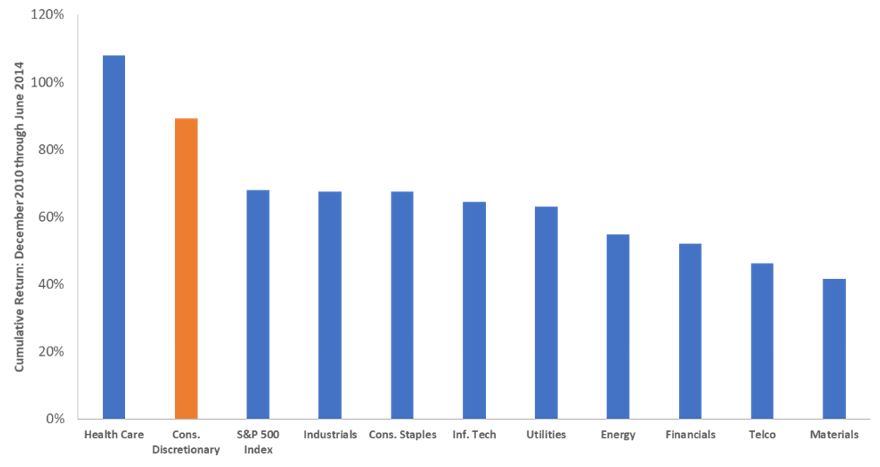
Accelerating inflation has rightly caught the attention of policy makers and investors alike. Expectations that rising prices would cool during the latter half of 2021 proved misplaced as annual US inflation, as measured by the Consumer Price Index, rose 7.9% in February. The core reading, which strips out volatile food and energy, climbed 6.4%. Both are multi-decade highs. The risk that a rapid rise in prices poses to the US - and global - economy is perhaps best illustrated by how quickly the Federal Reserve (Fed) has pivoted toward overtly hawkish policy, with the US central bank now forecasting the equivalent of seven 25 basis point (bps) rate hikes this year. The blunt instrument of higher policy rates is not the only factor that gets a vote in the future trajectory of prices. An economic maxim is 'the cure for higher prices is higher prices'. In more conventional parlance, economists refer to this phenomenon as demand destruction, the notion that prices can rise by such a degree that consumer behaviour is altered, thus removing a catalyst for any additional step up in inflation. A contemporaneous Google search will show that demand destruction is top of mind for market participants these days, especially with respect to the jarring rise in energy prices. An anecdotal gauge for measuring the potential for demand destruction is signals from equity markets. Not only do investors vote with their sell orders on sectors that may be at risk of slowing earnings growth, but also some management teams revise forward guidance based on their expectations for customers' tolerance of higher prices. What are these signals presently telling us about the possibility of pinched consumers cutting back on purchases? They have not reached that point - yet. While acknowledging that inflation has already entered consumers' psyches, several factors lead us to believe that prices still have some room to run before shoppers' behaviour is altered to the degree that it itself becomes a headwind to growth. Household balance sheets remain strong, and historical precedent indicates that current prices at the pump and other rapidly rising costs can be tolerated - albeit begrudgingly - by consumers. Still, the degree to which prices have risen and the fact that two-thirds of US economic activity is based on consumption means the situation merits monitoring, especially given the glaring inaccuracy of recent inflation forecasts. Make up your mindConventional wisdom was that early 2021 inflationary pressure was due to the low base effects of 2020 lockdowns and would eventually roll off. More recently, the pandemic has also been cited as the cause of inflation due to supply disruptions in key industrial inputs - among them semiconductors and labour. Possibly hoping to be forgotten by policymakers has been the material effects of $4.8 trillion of liquidity that the Fed has injected into the economy since the onset of the pandemic. While extraordinary support was merited during the depth of economic lockdowns, we were concerned that the magnitude of this stimulus would result in the unintended consequence of inflation and that the lagging nature - typically over a year - of these initiatives would mean attempts to rein in accelerating prices would prove a day late and more than a dollar short. All these inflationary ingredients were present even before Russia's incursion into Ukraine sent prices on certain energy and materials products on a near vertical trajectory. Regardless of the cause, elevated inflation is here, and it is up to equities investors to figure out how to navigate this environment. Coincidentally, data on both the sector and individual company level can provide important clues about how inflation is evolving and how consumers are reacting to these developments. A likely suspectEnergy prices' contribution to inflation cannot be ignored. They rose 25.6% compared to February 2021 and are a main driver of overall inflationary pressure. How much more consumers can bear elevated energy costs depends upon both their duration and the degree to which they keep climbing. With respect to duration, the absence of Russian products in global markets does not bode well. When reviewing company-level plans for capital expenditure, there are virtually no short-cycle projects that can be quickly brought online to meet existing demand. Consumers have weathered worse without being compelled to alter consumption patterns. Energy consumption in the US tends to be inelastic, meaning consumers are relatively insensitive to rising prices. Between 2011 and the July 2014, crude as measured by West Texas Intermediate, averaged nearly $100 per barrel. If consumers had felt the need to compensate for higher gasoline prices by scrimping elsewhere, the most likely target would have been discretionary purchases. Yet during this period, the consumer discretionary sector outperformed the broader S&P 500® Index and was the stock market's second-best-performing sector. Price per barrel of West Texas Intermediate Crude
Source: Bloomberg, as of 25 March 2022. Cumulative total return by S&P 500 sector: January 2011-June 2014
Cumulative total return by S&P 500 sector: year-to-date 2022
Although the ultimate duration of this period of elevated energy prices remains unknown, prices for crude and refined products are lower than the 2011-2014 period in real (inflation-adjusted) terms. Looking forward, there is no magic number as to when demand destruction kicks in. Often mentioned are $150 per barrel of crude and a $5.00 national average at the pump. The reality is, however, that prices are drifting higher and at some point, consumers may be forced to prioritise expenditures. Exacerbating the situation is that lower-income households will be most acutely affected by sustained higher energy prices as a greater percentage of their monthly outlays are allocated toward energy. A similar dynamic is facing emerging market consumers. In Europe, households and businesses are receiving a secondary gut punch in the form of higher utility costs given their greater reliance upon Russian energy exports. The takeaway for investors is that discretionary sectors that cater to these cohorts may be most exposed to forced changes in consumer behaviour. In a sign that energy demand remains steady, the margins - or cracks - for refiners between their crude input costs and the revenues derived from end products have thus far held up. Should demand falter, we would expect to see refiner margins narrow. Rainy day fundsAnother factor that leads us to believe that the economy is not yet at risk of seeing a curtailment in consumption is the robust health of household finances. Although consumers' monthly savings rates have recently slid as the most generous period of fiscal stimulus is behind us, the cumulative effects of these extraordinary programs have left consumer balance sheets at historic levels. As of the fourth quarter 2021, cumulative household savings have reached a record $18 trillion. This cushion has, thus far, enabled households to weather the current bout of inflation. Household and nonprofits' savings
An indicator that peak stimulus has passed is the recent deceleration of retail sales in an array of categories. To compensate for the upheaval caused by pandemic-related shutdowns, we looked at two-year growth rates to gauge which segments have experienced the most deceleration. As of December, this rate for retail sales ex automobiles and gasoline was 18.9%, well below November's 22.6%. There is some noise in these data, as holiday purchases were likely pulled forward to the October/November period, thus meaning the post-holiday figures may have only fallen back to longer-term trends. Furthermore, there are only so many things consumers can buy, and we are not alone in believing that at some point, purchases will shift from the goods that buoyed retail over the past two years toward services such as travel and entertainment. Any potential dip in sales of goods over the next few months may reflect, in part, this transition rather than solely alarmed consumers snapping their wallets shut. Two-year US retail sales growth rates
Still, some retail data points flash signs of caution. Deceleration has been particularly notable in department stores, electronics and appliance stores and non-store retailers. The path does not appear any easier as the hurdle - as measured by two-year comparables - for upcoming months is considerably higher across many retail segments in contrast to those of last autumn. A canary in the coal mineTo-be-determined is whether the sequential slowdown in these categories is the result of pulled-forward purchases or inflation beginning to bite. Should the latter be what's unfolding, one would expect consumers to first cut back on nonessential purchases. And this is largely how the market is interpreting it. Year-to-date, through March 24, the consumer discretionary sector has returned -9.8%, well below the -6.0% of the S&P 500 Index. Yet, we believe it is too early to draw firm conclusions that lower prospects for discretionary stocks are directly tied to rising inflation. Other contributing factors are also likely at play. Entering the year, the sector's forward price-earnings (P/E) ratio sat well above its long-term average and was exposed to the risk of multiple compression in the face of rising interest rates (its full-year P/E ratio fell by as much as 24% before slightly rebounding). Also, categories that include goods might see earnings and multiple pressure, although that may be offset, to a degree, by strength in experiences-related sectors. The takeaway for investors is that a cocktail of inflation, rising rates and multiple compression represents a risk to consumer-related stocks - and equities markets more broadly - until the ultimate cadence and ending point of monetary tightening are established. As previously stated, in the 2011 through mid-2014 period of high oil prices, consumer discretionary was the second-best-performing sector. There have been periods of inflation-induced demand destruction, namely the late 1970s and the years preceding the Global Financial Crisis, but notably, consumers' finances were nowhere near as healthy as they are at present and the US economy was substantially more energy intensive, meaning consumers and businesses were much more vulnerable to an uptick in oil prices. Based on our conversations with management teams, we have been able to tease out some potential risks and opportunities within the retail sector, should inflation remain elevated. Given the ability of higher-income consumers to absorb elevated food and energy prices, we believe that companies catering to this market segment are better positioned to sustain margins. The same holds true for companies with pricing power, meaning they can pass along higher input costs to customers. We are more circumspect on companies exposed to low-end wage inflation. Physical retailers already face staffing challenges, and absent any meaningful growth in the labour force, we foresee the bidding war for workers to continue. Part and parcel with stimulus checks is the pulling forward of certain purchases. Retailers focusing on durable goods such as appliances, as well as other home-centric categories, may be vulnerable to revenue air pockets caused by this phenomenon. Lastly, higher transportation costs have the potential to exacerbate lingering supply chain disruptions as retailers have come to rely upon higher priced alternatives - such as air freight - to get products to market. Should this trend continue, current estimates for discretionary sector operating margins could prove too optimistic. Looking forwardNearly 8% headline inflation has forced the Fed to react. Given the delayed effect of rate hikes - along with still very low levels - the point at which tighter policy begins to constrict growth is likely some ways off. Yet the tempering effects of demand destruction likely remain relatively farther on the horizon as well. An unprecedentedly level of consumer savings will likely enable households to tolerate a relatively extended period of higher prices. The question is how long will this stand. Supply disruptions, wage pressures, fiscal largesse and commodities upheaval have all contributed to the inflationary backdrop. Corralling these forces stands to be tall task and investors should be prepared for how a sustained period of elevated prices will reverberate through equity markets. Consumer Price Index (CPI) is an unmanaged index representing the rate of inflation of the U.S. consumer prices as determined by the U.S. Department of Labor Statistics.
This information is issued by Janus Henderson Investors (Australia) Institutional Funds Management Limited ABN 16 165 119 531, AFSL 444266 (Janus Henderson). The funds referred to within are issued by Janus Henderson Investors (Australia) Funds Management Limited ABN 43 164 177 244, AFSL 444268. The value of an investment and the income from it can fall as well as rise and you may not get back the amount originally invested. Past performance is not indicative of future performance. Prospective investors should not rely on this information and should make their own enquiries and evaluations they consider to be appropriate to determine the suitability of any investment (including regarding their investment objectives, financial situation, and particular needs) and should seek all necessary financial, legal, tax and investment advice. This information is not intended to be nor should it be construed as advice. This information is not a recommendation to sell or purchase any investment. This information does not purport to be a comprehensive statement or description of any markets or securities referred to within. Any references to individual securities do not constitute a securities recommendation. This information does not form part of any contract for the sale or purchase of any investment. Any investment application will be made solely on the basis of the information contained in the relevant fund's PDS (including all relevant covering documents), which may contain investment restrictions. This information is intended as a summary only and (if applicable) potential investors must read the relevant fund's PDS before investing available at www.janushenderson.com/australia. Target Market Determinations for funds issued by Janus Henderson Investors (Australia) Funds Management Limited are available here: www.janushenderson.com/TMD. Whilst Janus Henderson believe that the information is correct at the date of this document, no warranty or representation is given to this effect and no responsibility can be accepted by Janus Henderson to any end users for any action taken on the basis of this information. All opinions and estimates in this information are subject to change without notice and are the views of the author at the time of publication. Janus Henderson is not under any obligation to update this information to the extent that it is or becomes out of date or incorrect. |
|
Funds operated by this manager: Janus Henderson Australian Fixed Interest Fund, Janus Henderson Australian Fixed Interest Fund - Institutional, Janus Henderson Cash Fund - Institutional, Janus Henderson Conservative Fixed Interest Fund, Janus Henderson Conservative Fixed Interest Fund - Institutional, Janus Henderson Diversified Credit Fund, Janus Henderson Global Equity Income Fund, Janus Henderson Global Multi-Strategy Fund, Janus Henderson Global Natural Resources Fund, Janus Henderson Tactical Income Fund |
 Source: Bloomberg, as of 25 March 2022.
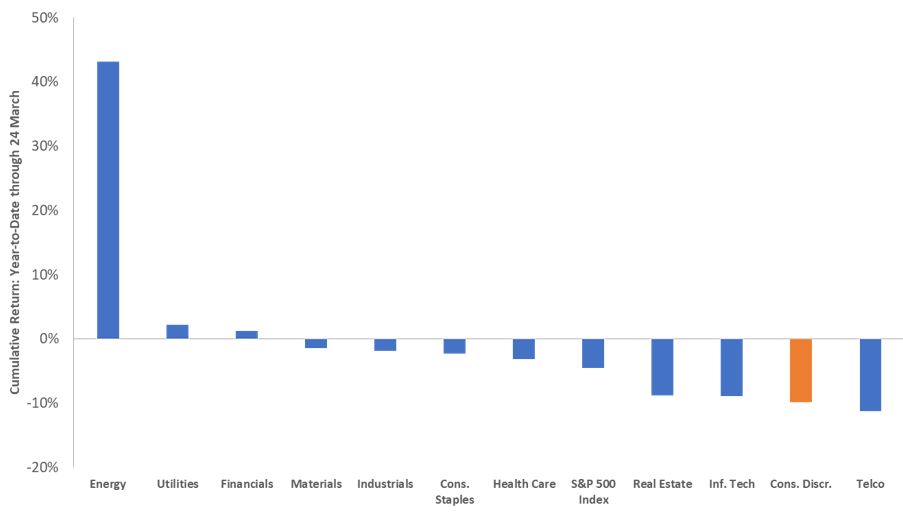 Source: Bloomberg
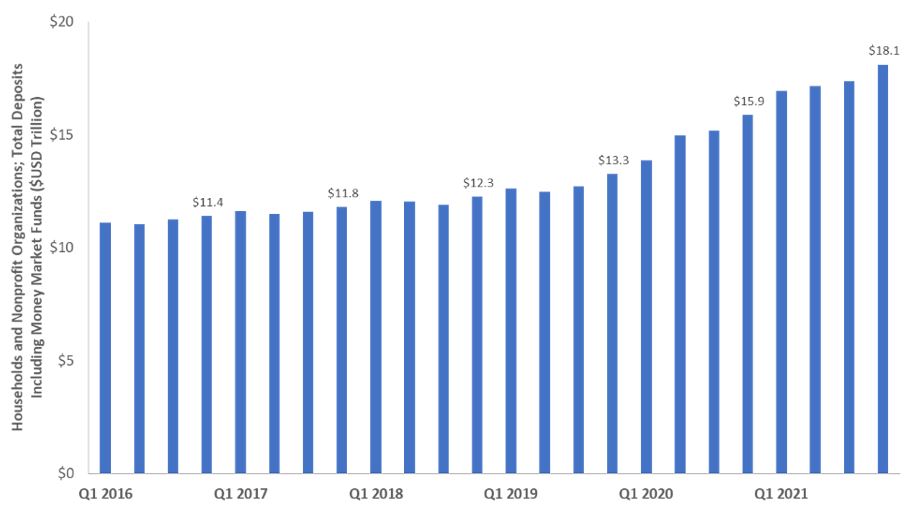 Source: Federal Reserve, as of 31 December 2022.
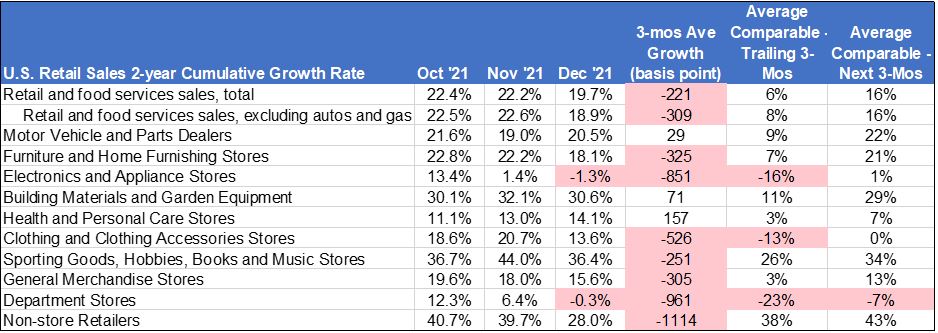 Source: U.S. Census Bureau, as of 31 December 2022.
8 Apr 2022 - The French presidential election
|
The French presidential election abrdn April 2022 It's election time in France, as the nation heads to the polls on 10 April. There will then be a runoff between the top two candidates on 24 April. So, how do we think the election will play out? And what could it mean for investors? A quick recap Unlike other European states, the French president is the main figure in the nation's political system. He/she holds executive and legislative powers, including the appointment of a prime minister that reflects the parliamentary majority. The president therefore drives the policymaking agenda. He/she is also the head of national defence and diplomacy. Where do we stand? Ahead of April's vote, President Macron enjoyed a comfortable lead in both the first- and second-round polls. His handling of the Russia-Ukraine crisis has bolstered his standing in the eyes of many voters. Further, the 2022 elections are taking place against a very different economic and political backdrop than previous campaigns. France has experienced one of the strongest recoveries from the Covid-19 pandemic and is no longer regarded as one of the 'sick men' of Europe. Angela Merkel's retirement has left Macron as Europe's senior statesperson. As a result, he enjoys stronger support at this stage of the campaign than his two predecessors. Nonetheless, support for populist candidates is once again robust. Veteran far-right leader Marine Le Pen remains Macron's main challenger. Her Euroscepticism has moderated since 2017 as she attempts to appeal to the political centre. Le Pen's tone is less incendiary than in previous campaigns. Meanwhile, higher inflation is eroding workers' purchasing power. She and others are evoking the spectre of 'green inflation' to scare-up votes. This is putting the efficacy of France's climate strategy at the heart of the electoral debate. That said, the political spectrum is more fragmented than ever. The candidacy of Eric Zemmour could potentially fracture the far-right vote. As a candidate, he combines controversial stances on immigration with liberal (but vague) economic policies. Unlike Le Pen, he seems to recognise the unsustainability of the French pension system. At the same time, he is even keener to pick a fight with the EU on legal sovereignty. At the opposite end of the political spectrum, Jean-Luc Mélenchon represents a different type of economic danger. As an avowed socialist, he wants to increase tax on overtime work, raise marginal tax rates and re-regulate labour markets. Each of these would undermine progress to improve the competitiveness of the French economy. Nonetheless, Mélenchon's campaign has picked up considerable momentum in recent weeks. The result - a market perspective In the event France elects a far-right candidate, assets would likely come under pressure. We would expect to see a widening of French sovereign bond spreads and underperformance of domestically-oriented French equity and credit securities. However, given populists' retreat from hardline Eurosceptic views, the fallout would likely be less extreme than if it had occurred in 2017, or what we saw after the 2018 Italian elections. The largest risk is less the outright victory of an extreme candidate, but rather a more fragmented parliament following regional elections in June. A second-term centrist government is likely to have to compromise with parties of both the left and right over economic, energy, and European policy. This has the potential to lead to policy stasis. By contrast, markets would welcome the re-election of Macron. His victory would imply policy continuity and further progress on the reform agenda. We could possibly see further EU integration and a renewed attempt to tackle pension reforms. Further, Macron is an advocate for more investment in green and nuclear technologies. However, he will be wary of raising fuel or carbon taxes for fear of reviving the Gilets Jaunes movement. Pension reform will be the hardest issue to tackle. Macron wants to increase the retirement age from 62 to 65. Many will find that hard to swallow. It could also revive the social tensions that plagued the first years of his presidency. The largest risk is less the outright win of an extreme candidate, but rather a more fragmented parliament following regional elections in June. Who will win? At the time of writing, Macron remained in the driving seat. By our numbers, he will likely face Le Pen in the second round of voting, despite Mélenchon's recent surge. Thereafter, we expect Macron will retain the presidency, albeit on a tighter margin than we thought a month ago. Indeed, two polls published on 28 March showed Le Pen narrowing the gap by three points. If they faced each other in the final round, an Ifop-Fiducial group indicated Macron would win by just 53% versus Len Pen's 47%. One potential risk to this scenario is historically low voter turnout following a race overshadowed by the Russia-Ukraine crisis. That said, there's little consensus as to which candidates would suffer most from more voters staying at home. All in all, it promises to be an interesting week ahead. We'll bring you our latest analysis once the final votes are counted. Author: Alexandra Popa, Macro ESG Research, Abrdn Research Institute |
|
Funds operated by this manager: Aberdeen Standard Actively Hedged International Equities Fund, Aberdeen Standard Asian Opportunities Fund, Aberdeen Standard Australian Small Companies Fund, Aberdeen Standard Emerging Opportunities Fund, Aberdeen Standard Ex-20 Australian Equities Fund (Class A), Aberdeen Standard Focused Sustainable Australian Equity Fund, Aberdeen Standard Fully Hedged International Equities Fund, Aberdeen Standard Global Absolute Return Strategies Fund, Aberdeen Standard Global Corporate Bond Fund, Aberdeen Standard International Equity Fund , Aberdeen Standard Life Absolute Return Global Bond Strategies Fund, Aberdeen Standard Multi Asset Real Return Fund, Aberdeen Standard Multi-Asset Income Fund |