

Find a Fund
Peer Group Analysis View All»
| Index Selector Links | 1 Year | 3 Year | 5 Year |
|---|---|---|---|
8.41% |
7.02% |
8.38% |
|
5.96% |
5.95% |
3.07% |
|
45.16% |
40.64% |
48.57% |
|
20.19% |
10.53% |
6.55% |
|
12.54% |
8.27% |
9.13% |
|
14.15% |
11.57% |
10.67% |
|
15.16% |
9.50% |
7.95% |
|
12.90% |
10.71% |
11.36% |
|
17.83% |
16.34% |
11.76% |
|
20.31% |
11.45% |
10.04% |
|
20.69% |
17.27% |
11.68% |
|
15.17% |
8.89% |
10.39% |
|
9.40% |
7.53% |
7.10% |
|
8.20% |
8.42% |
7.45% |
|
7.87% |
0.36% |
4.35% |
|
8.88% |
8.75% |
7.76% |
Hedge Clippings

8 Nov 2024 - Hedge Clippings | 08 November 2024
|
|
|
|
Hedge Clippings | 08 November 2024 It's been a big week for markets, central banks, mainly due of course to the clear-cut US election result, which seemed to surprise everyone it seems, except Trump and his die-hard supporters. While we know there's never a dull moment, this week might take the cake--or at least a sizable slice of it. Trump's Victory: What It Means for Australia Well, it's official. While Donald Trump won't actually be back in the White House until January, the ripples are being felt globally. As expected, the initial market reaction was a mix of higher US Treasury yields, a stronger dollar, and a predictably unpredictable response from equities. For Australia, the implications are numerous and, unfortunately, somewhat clouded by uncertainty. There's been plenty of chatter, not least from our friends at the RBA, on what a Trump presidency could mean for us. What does this mean for investors here? Perhaps the biggest takeaway is uncertainty. Tariffs could impact Australian exports indirectly via China, US policy changes might affect currency markets, and there's a general sense that volatility could remain a dominant theme for a while yet. Shane Oliver at AMP summed it up neatly: Trump's policies may give a short-term productivity boost in the US, but at the risk of stoking inflation and leading to a global flow-on effect. Expect more of the same - and a nervous RBA. Cash Rates: RBA Holds Steady as the Fed eases 0.25%. If all the election noise wasn't enough, this week also saw major central bank decisions on both sides of the Pacific. The RBA held its cash rate at 4.35%, as most expected, while the US Fed opted to lower its rate by 0.25 basis points--a more dovish move aimed at balancing a "generally eased" labour market and still-high inflation. RBA Governor Michele Bullock, speaking at the Senate budget estimates, noted that there's plenty of speculation, but no one really knows for sure. The combination of potentially higher tariffs, larger budget deficits, and fiscal changes in the US could lead to higher global interest rates and, ultimately, increased inflationary pressures here at home. If that sounds familiar, it's because we've seen this movie before--last time Trump was in office, his tariffs hit global trade and pushed costs up across the board. The RBA is right to be cautious. The RBA Governor was clear that, while she acknowledged inflation has eased, the RBA is not ready to take its foot off the brake just yet. The message remains consistent: inflation is still the main game, and the RBA wants to see clearer signs of it being under control before even contemplating rate cuts. Bullock was equally clear in her warning to Albanese and Treasurer Chalmers - higher government spending, and further pre-election cash-splash promises, are inflationary. So, what's the upshot for Australia? In the immediate term, not much--but with the US easing and Australia staying put, we could see increased pressure on the Aussie dollar. And with markets now contemplating the chances of no RBA cut until mid-2025, the gap between US and Australian rates could widen further. But then again, if there's one thing we know for sure, it's that predictions can easily be thrown out the window--particularly when Trump's involved. No Time to Be Predictably Predictable As always, uncertainty is the only certainty. We've got an unpredictable US President, an RBA sticking to its inflation-first mantra, and markets that are trying to make sense of it all. For investors this is a time to stay vigilant, diversify where possible, and, as always, keep one eye firmly on the bigger picture. The RBA might be on hold, but the world around us certainly isn't. Until then, keep your powder dry--and perhaps a glass of pinot handy. We'll all need it. News & Insights Quarterly State of Trend report - Q3 2024 | East Coast Capital Management Anticipating the Future of Luxury | Insync Fund Managers October 2024 Performance News |
|
|
If you'd like to receive Hedge Clippings direct to your inbox each Friday |

5 Dec 2024 - Manager Insights | East Coast Capital Management (From rubber to oats )
|
Chris Gosselin, CEO of FundMonitors.com, speaks with Richard Brennan, Strategy Ambassador at East Coast Capital Management. The ECCM Systematic Trend Fund has a track record of 4 years and 10 months. The fund has outperformed the SG Trend benchmark since inception in January 2020, providing investors with an annualised return of 15.09% compared with the benchmark's return of 6.97% over the same period. Key to its success were high commodity market allocations and a systematic, risk-managed approach, offering strong diversification benefits with low correlation to traditional asset classes like the ASX 200.
|

5 Dec 2024 - The Australian: Donald Trump 2.0 puts global markets on edge
|
The Australian: Donald Trump 2.0 puts global markets on edge JCB Jamieson Coote Bonds November 2024 Uncertainty will reign after the re-election of Donald Trump and the Republican Red sweep on Capitol Hill, giving the Grand Old Party (GOP) a clear mandate for significant change. After a campaign dominated by personal insults and grubby fearmongering, actual hard policy detail is somewhat scant. Initially, markets have responded by backing Trump and team GOP, with risk assets rallying, thrilled with an outlook of perceived positive growth policies centred around tax cuts, deregulation and less focus on environmental issues. However, markets must wait for more detail to truly release the animal spirits, as some touted Trump policies may threaten such growth outcomes by taking momentum out of the economy. Will the bark of Trumpian policy be equal to the bite, or does the "art of the deal" translate into vocal threats without the downside of chosen short-term pain? The US budgetary outlook will provide guardrails to these expectations. 2024 has been a year of toppling sitting governments, as voters remain angry in a post-Covid world with extreme cost-of-living pressures. Opposition parties the world over are being swept into power, only to find that governance in the aftermath of such an environment is quite difficult: it is far easier to criticise from the opposition benches than solve the complex problems in government. While the GOP has a clear voter mandate to lift living standards and restore low and stable inflation, some of the publicly suggested policy combinations threaten to deliver the opposite outcomes if enacted. Such moves could take the gloss off the initial market enthusiasm enjoyed since the election announcement. Trump has touted an across-the-board 10 per cent import tariff as a tool to drive change in trade policies, attempting to level the playing field by making US products more competitive against lower-cost producers, while also encouraging US-based investment. He has also targeted specific countries, such as China, proposing tariffs as high as 60 per cent. While this would help improve the US fiscal position by generating revenue from tariff taxes on imported goods, it effectively acts as a direct tax on American consumers, who would face higher prices on everyday items due to increased import costs. This would raise the general price level, stimulating inflation at a time when the Federal Reserve is lowering interest rates from emergency settings used to combat the last bout of Covid-induced inflation shocks. It would likely be very politically unpopular and, despite the sweeping mandate just received, the midterm elections of 2026 are always in the back of political minds. Trump has similarly proposed cutting up to $US2 trillion in deficit spending by appointing Elon Musk as a change agent to drive efficiency across federal government operations. While reducing waste is beneficial in the long term, the US economy is already reliant on significant government spending to bolster its somewhat slight growth profile―- all things considered―- given the already massive intervention of the government in the economy. The deficit spend is simply unprecedented for non-war times, running at 6-7 per cent of GDP under the Biden administration. Such massive government spending is only generating a tepid 2.8 per cent GDP growth, all while the economy experiences significant positive tailwinds from immigration. Removing such a large amount of spending from the economy would have significant growth implications if not replaced by other positive accretive outcomes such as a productivity enhancement. In these delicate political times, choosing such a deacceleration of economic activity seems an unlikely political choice. Delicate choices and policy combinations need to be made by the Trump administration as tax cuts and spending for growth require financing inside a US budget set up that is already strained after large Covid spending programs. Bond markets are on watch around the sustainability of the US fiscal position, now exceeding $US35 trillion and climbing (120 per cent of GDP), amid concerns that the budget has little room to provide a counter-cyclical buffer should the economy experience any type of recessionary outcomes. Since the election, yields have stabilised, supported by ongoing interest rate cuts from central banks such as Sweden's Riksbank, the Bank of England, and the Federal Reserve. Markets remain cautious, noting the potential risks of politically driven policies that lack economic foresight - highlighted by the swift removal of British Prime Minister Liz Truss after bond markets reacted sharply to her fiscal plans. Until US policy plans are laid out in full, we maintain a preference for Australian and European fixed income assets, which offer stronger fiscal conservatism and higher credit quality. Overall, this environment underscores the importance of diversification, careful monitoring of fiscal policy announcements, and considering exposure to regions with more stable economic policies. Funds operated by this manager: CC Jamieson Coote Bonds Active Bond Fund (Class A), CC Jamieson Coote Bonds Dynamic Alpha Fund, CC Jamieson Coote Bonds Global Bond Fund (Class A - Hedged) |

4 Dec 2024 - The big get bigger - concentrating on the
|
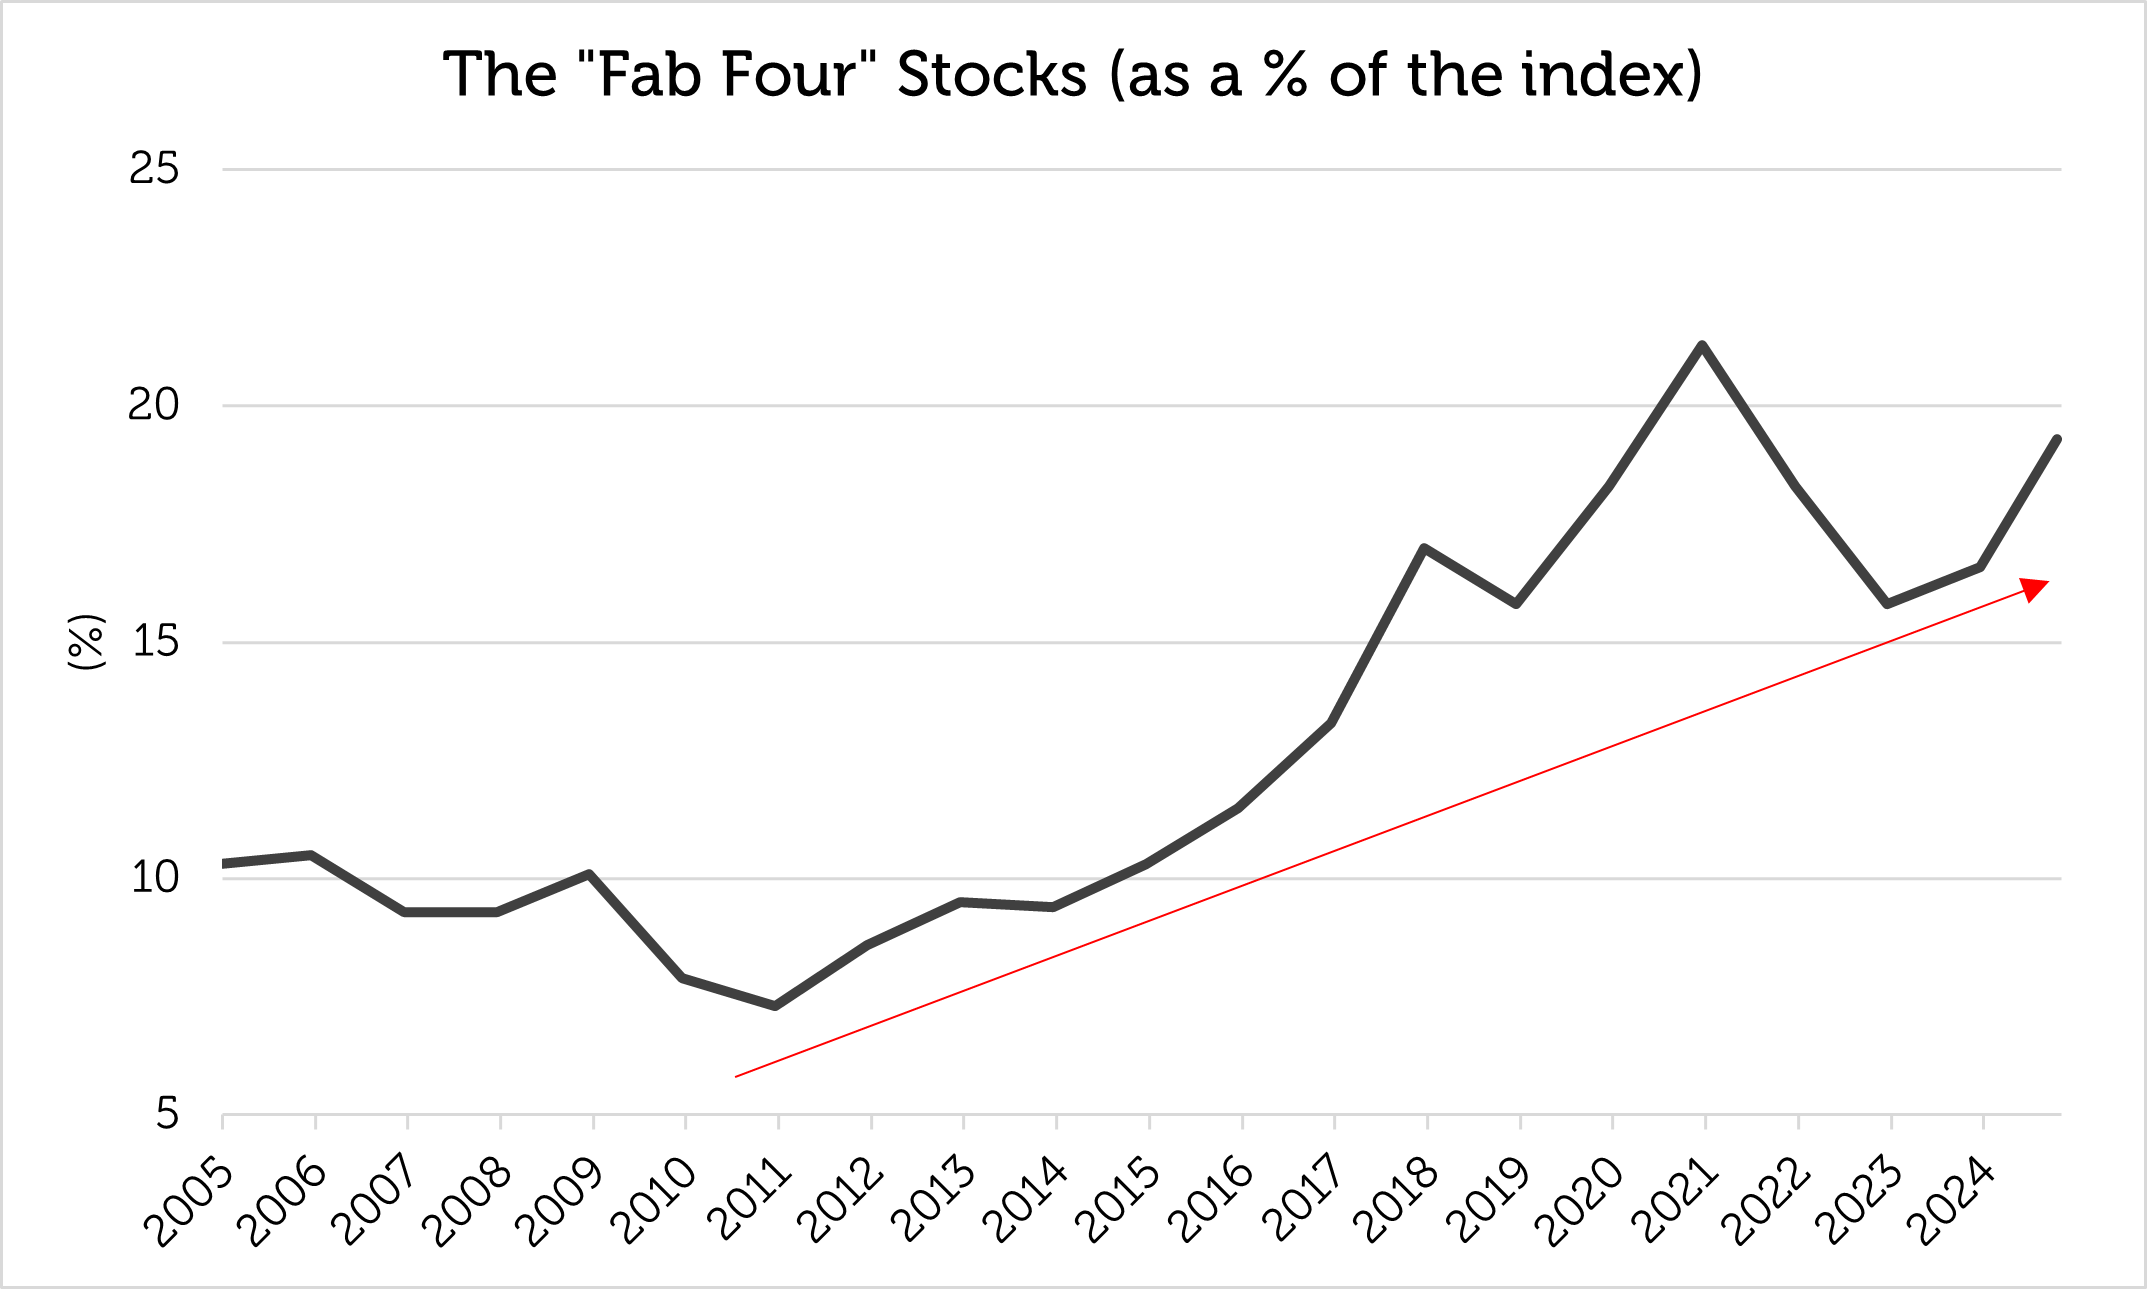
The big get bigger - concentrating on the "Fab Four" Redwheel November 2024 |
|
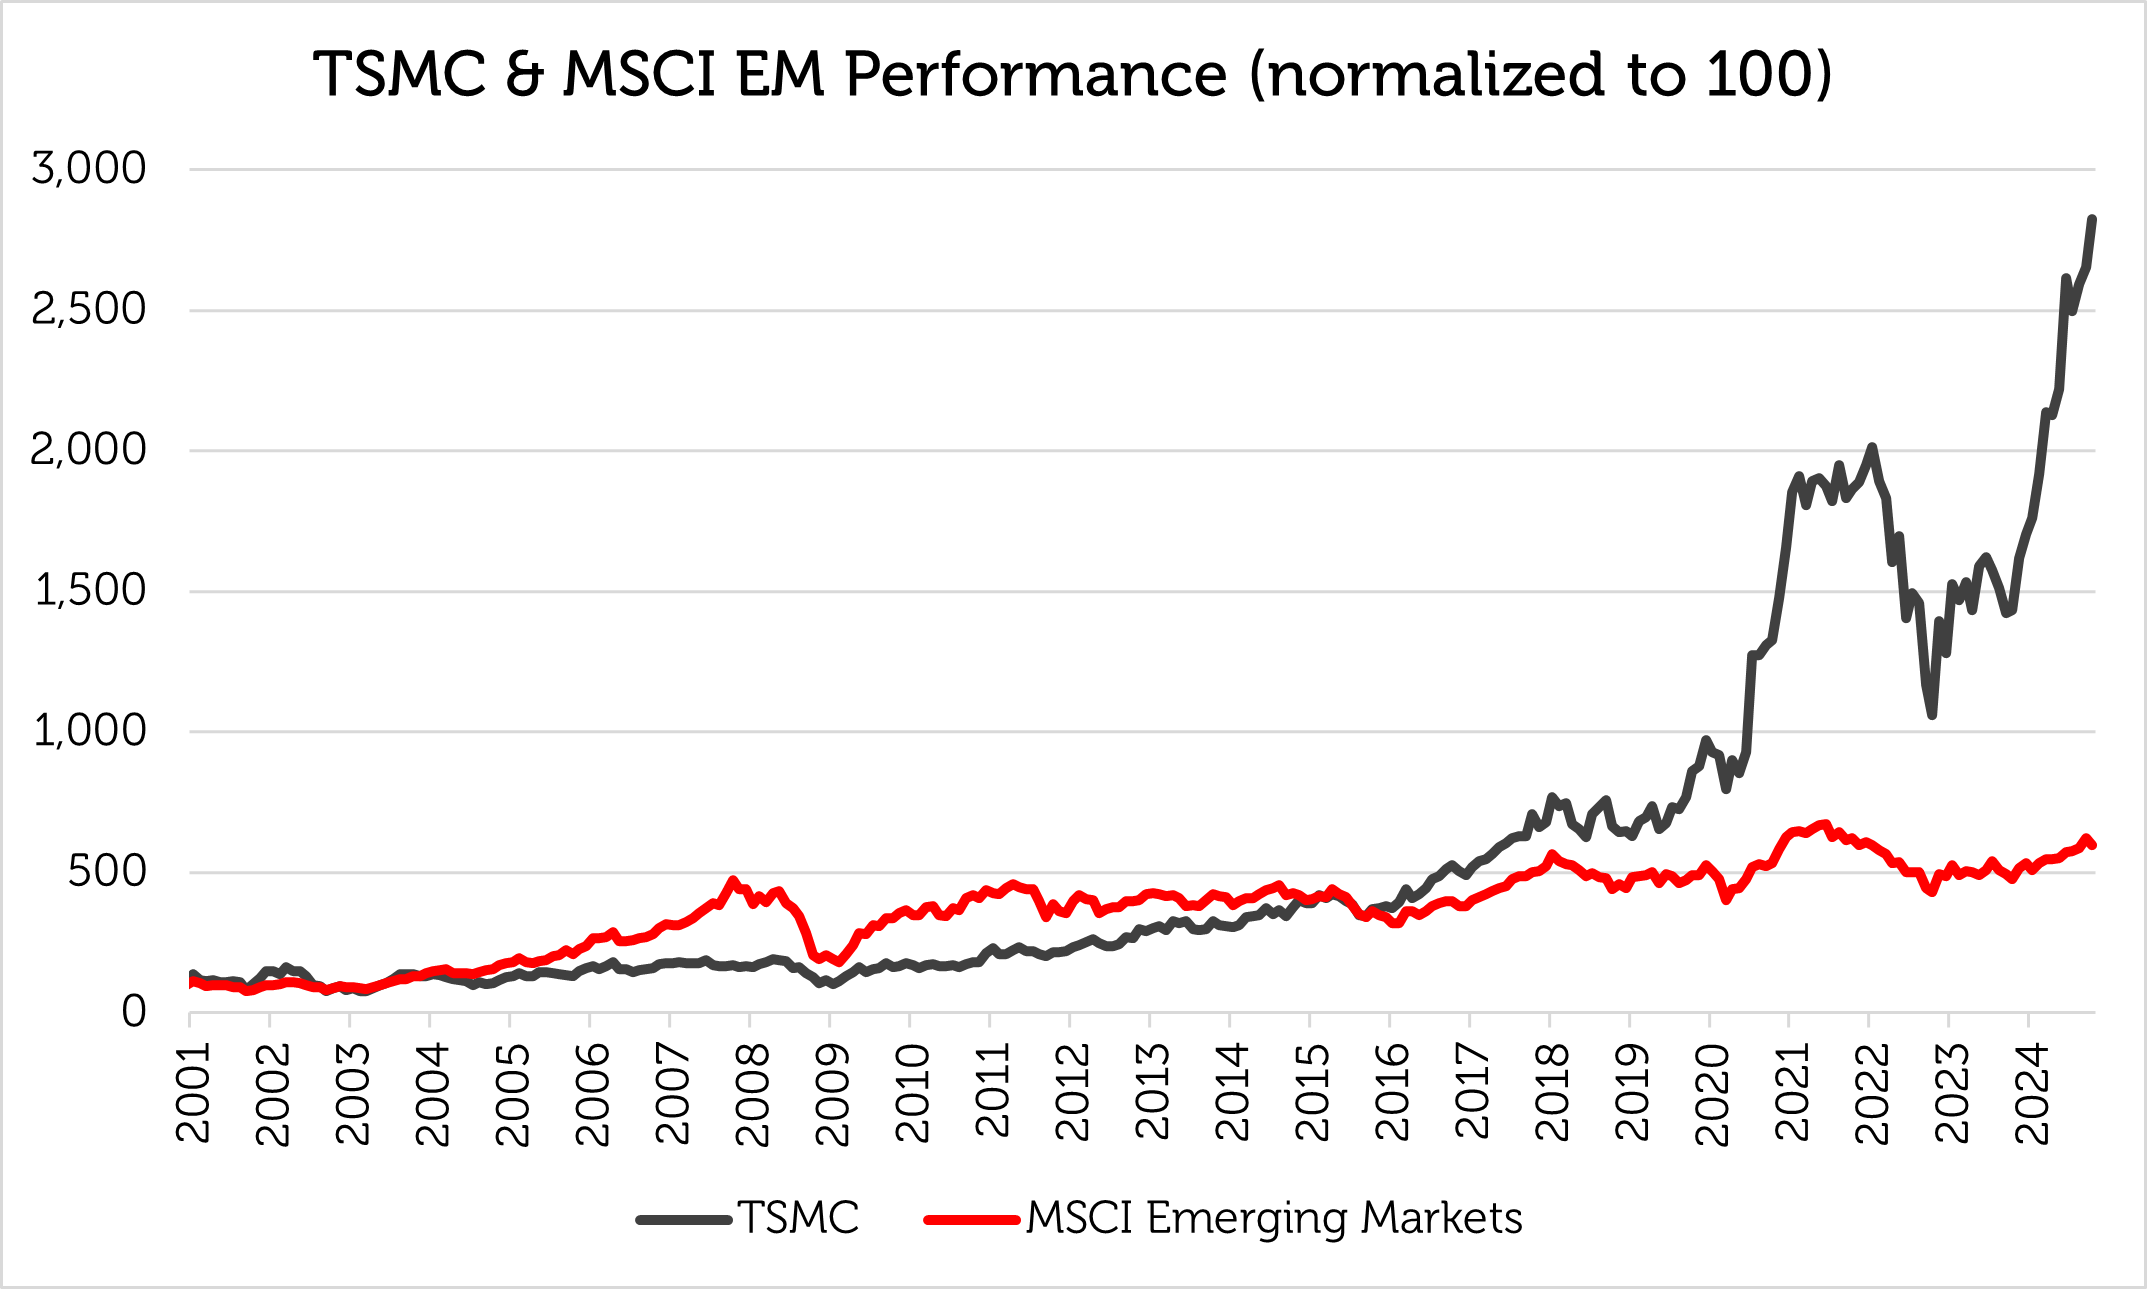
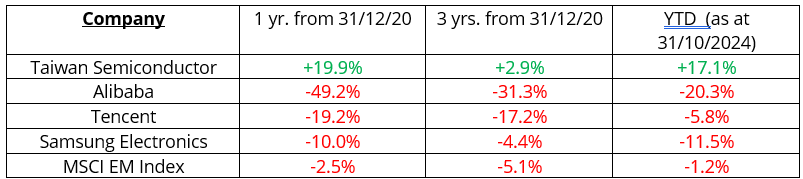
Investors have become familiar with the "Magnificent 7" US stocks that have been important contributors to index returns and comprise over a quarter of the benchmark S&P 500 weight (as at 31 October 2024). The MSCI Emerging Markets Index has an equivalent "Fab Four" stocks, sectors and countries that have come to dominate its composition and performance. The "Fab Four" Companies: Alibaba, Samsung Electronics, Taiwan Semiconductor, Tencent - are they unstoppable? The largest four stocks in the MSCI Emerging Markets Index have increased their combined weight from 8% - 10% in the 2000s to 15% - 20% of the index in the 2020s and have been responsible for a significant proportion of its total return. The same companies have occupied the top four slots in the MSCI Emerging Markets Index since June 2016: Taiwan Semiconductor Manufacturing (TSMC), Tencent, Samsung Electronics and Alibaba.
Source: Bloomberg, Redwheel as of 31 October 2024. Past performance is not a guide to future results. Taiwan Semiconductor, the largest of them, now accounts for c.10% of the index, equalling or even exceeding the relative size of Apple, Microsoft and NVIDIA in the Nasdaq Index. Since the beginning of 2001, Taiwan Semiconductor has outperformed the MSCI Emerging Markets Index by about 10% per annum. Up until 31 October 2024, Taiwan Semiconductor has accounted for approximately 35% of this year's total return of the MSCI Emerging Markets Index. At the current weight of c.10%, it has become practically impossible for most fund managers to neutralize or exceed the weight of Taiwan Semiconductor while adhering to guidelines for concentration and diversification. Excessive size and the inability of fund managers to replicate an enormous index weight might indicate that a stock is approaching the end of its outperformance because of a potential lack of new buyers.
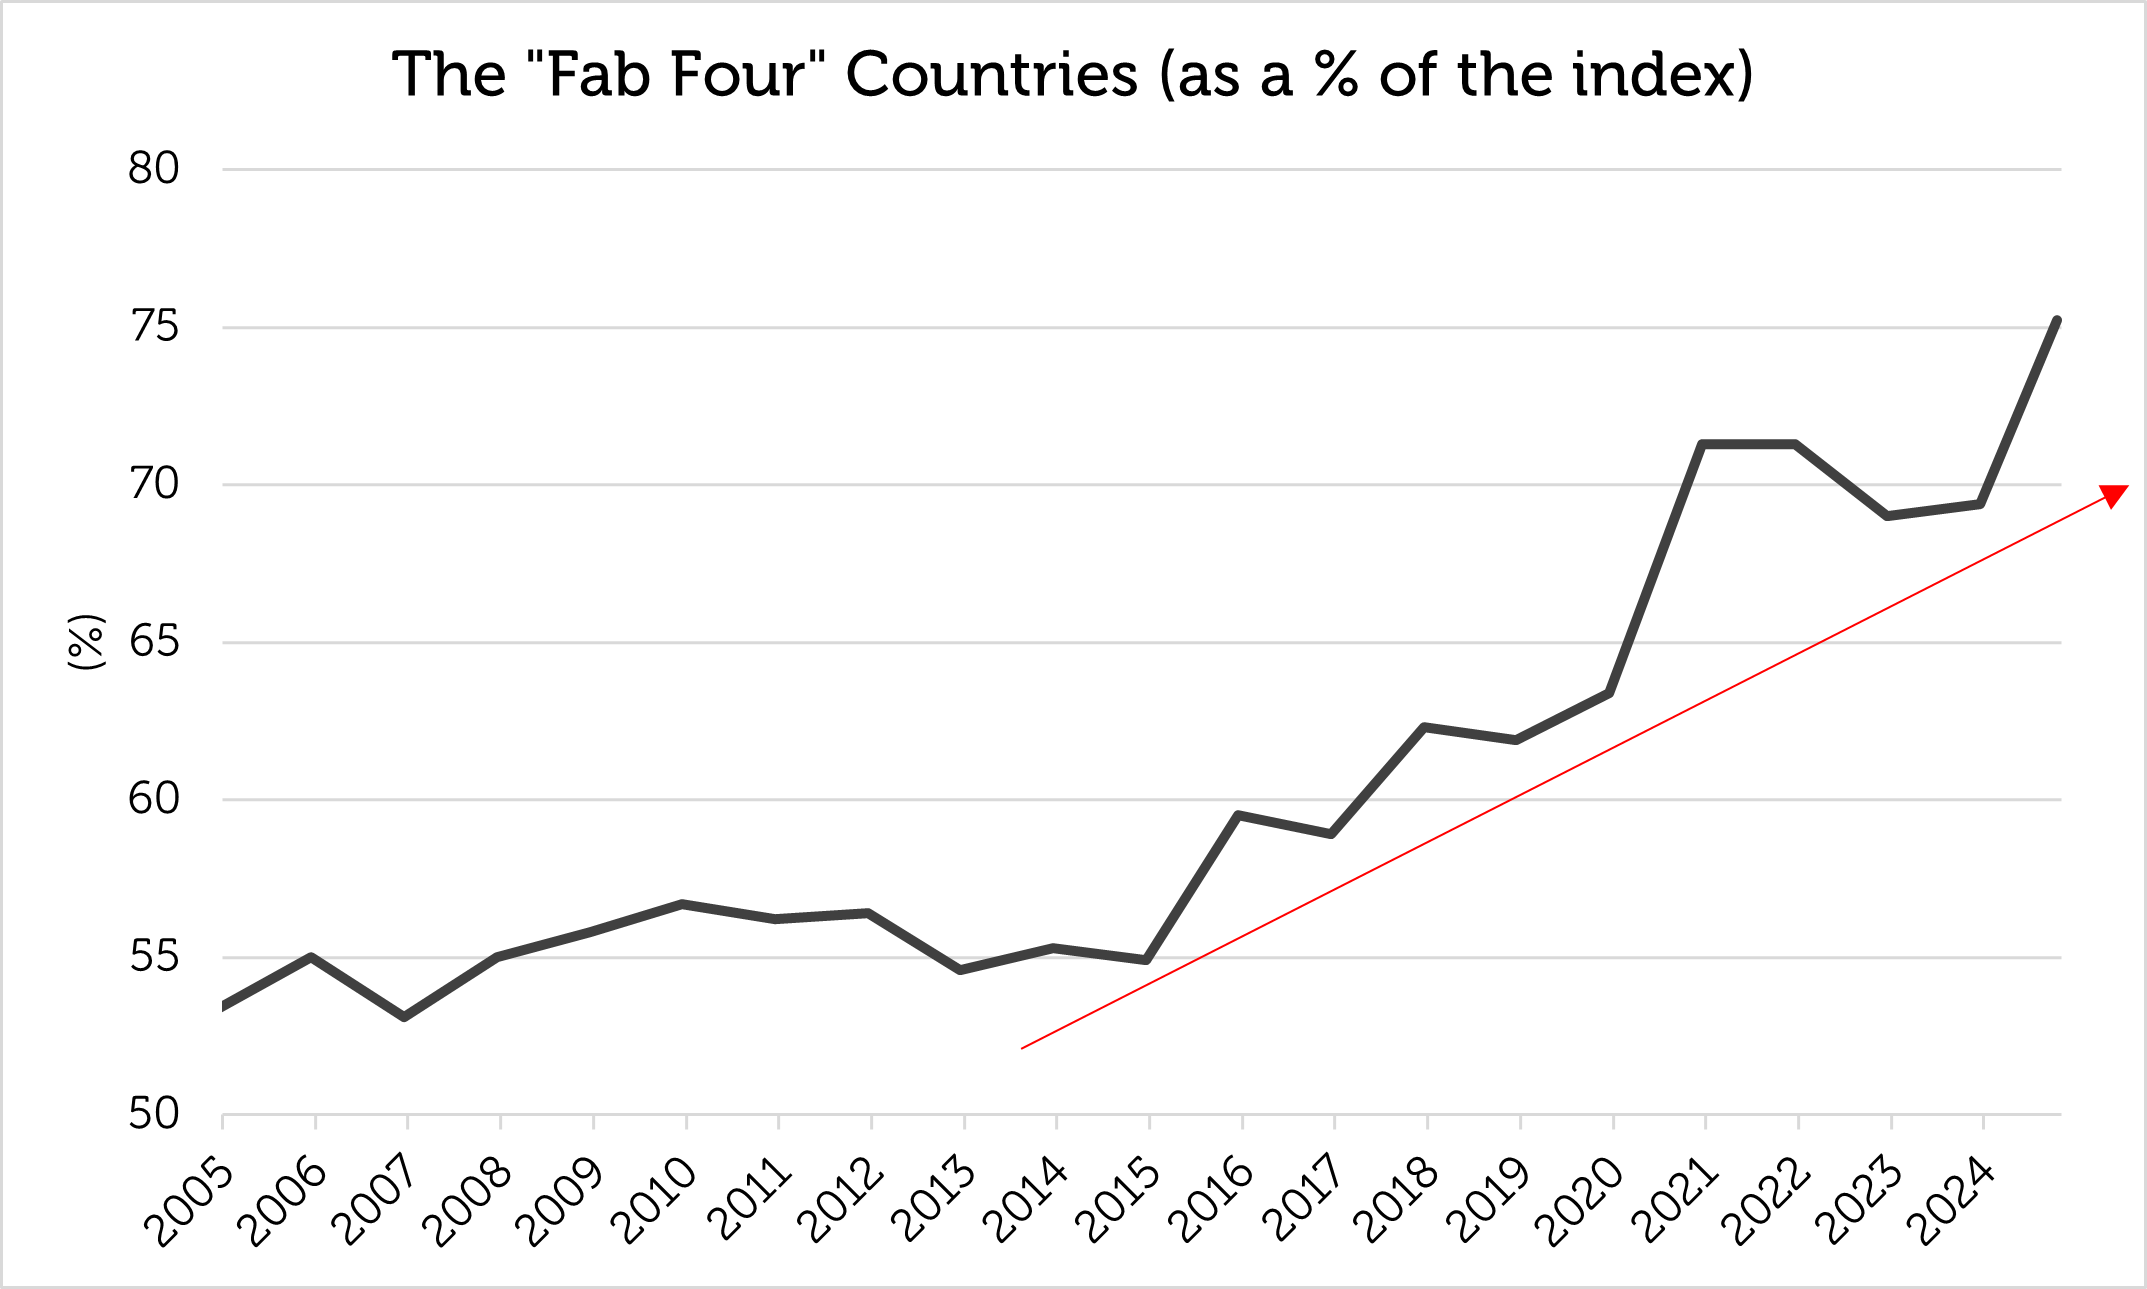
Source: Bloomberg, Redwheel as of 31 October 2024. MSCI Emerging Markets uses the MSCI Emerging Markets Net Total Return Index. Returns in US$. Past performance is not a guide to future results. The "Fab Four" Countries: China, India, Korea, Taiwan - is EM now just Asia? Country concentration mirrors stock concentration, with the same four countries dominating the index, their weight growing from the range of 50% - 60% between 2005 and 2017 to over 70% today (as at 31 October 2024): China, India, Korea and Taiwan. It has been almost ten years since a Latin American country (Brazil) has been in the top four, and nearly twenty years since an EMEA country (South Africa) has made an appearance. The concentration has become particularly pronounced since the mid-teens and means that the other 20 or so countries in the MSCI Emerging Markets Index account for an average weight of just over 1% each, making it difficult to achieve geographic diversification outside Asia.
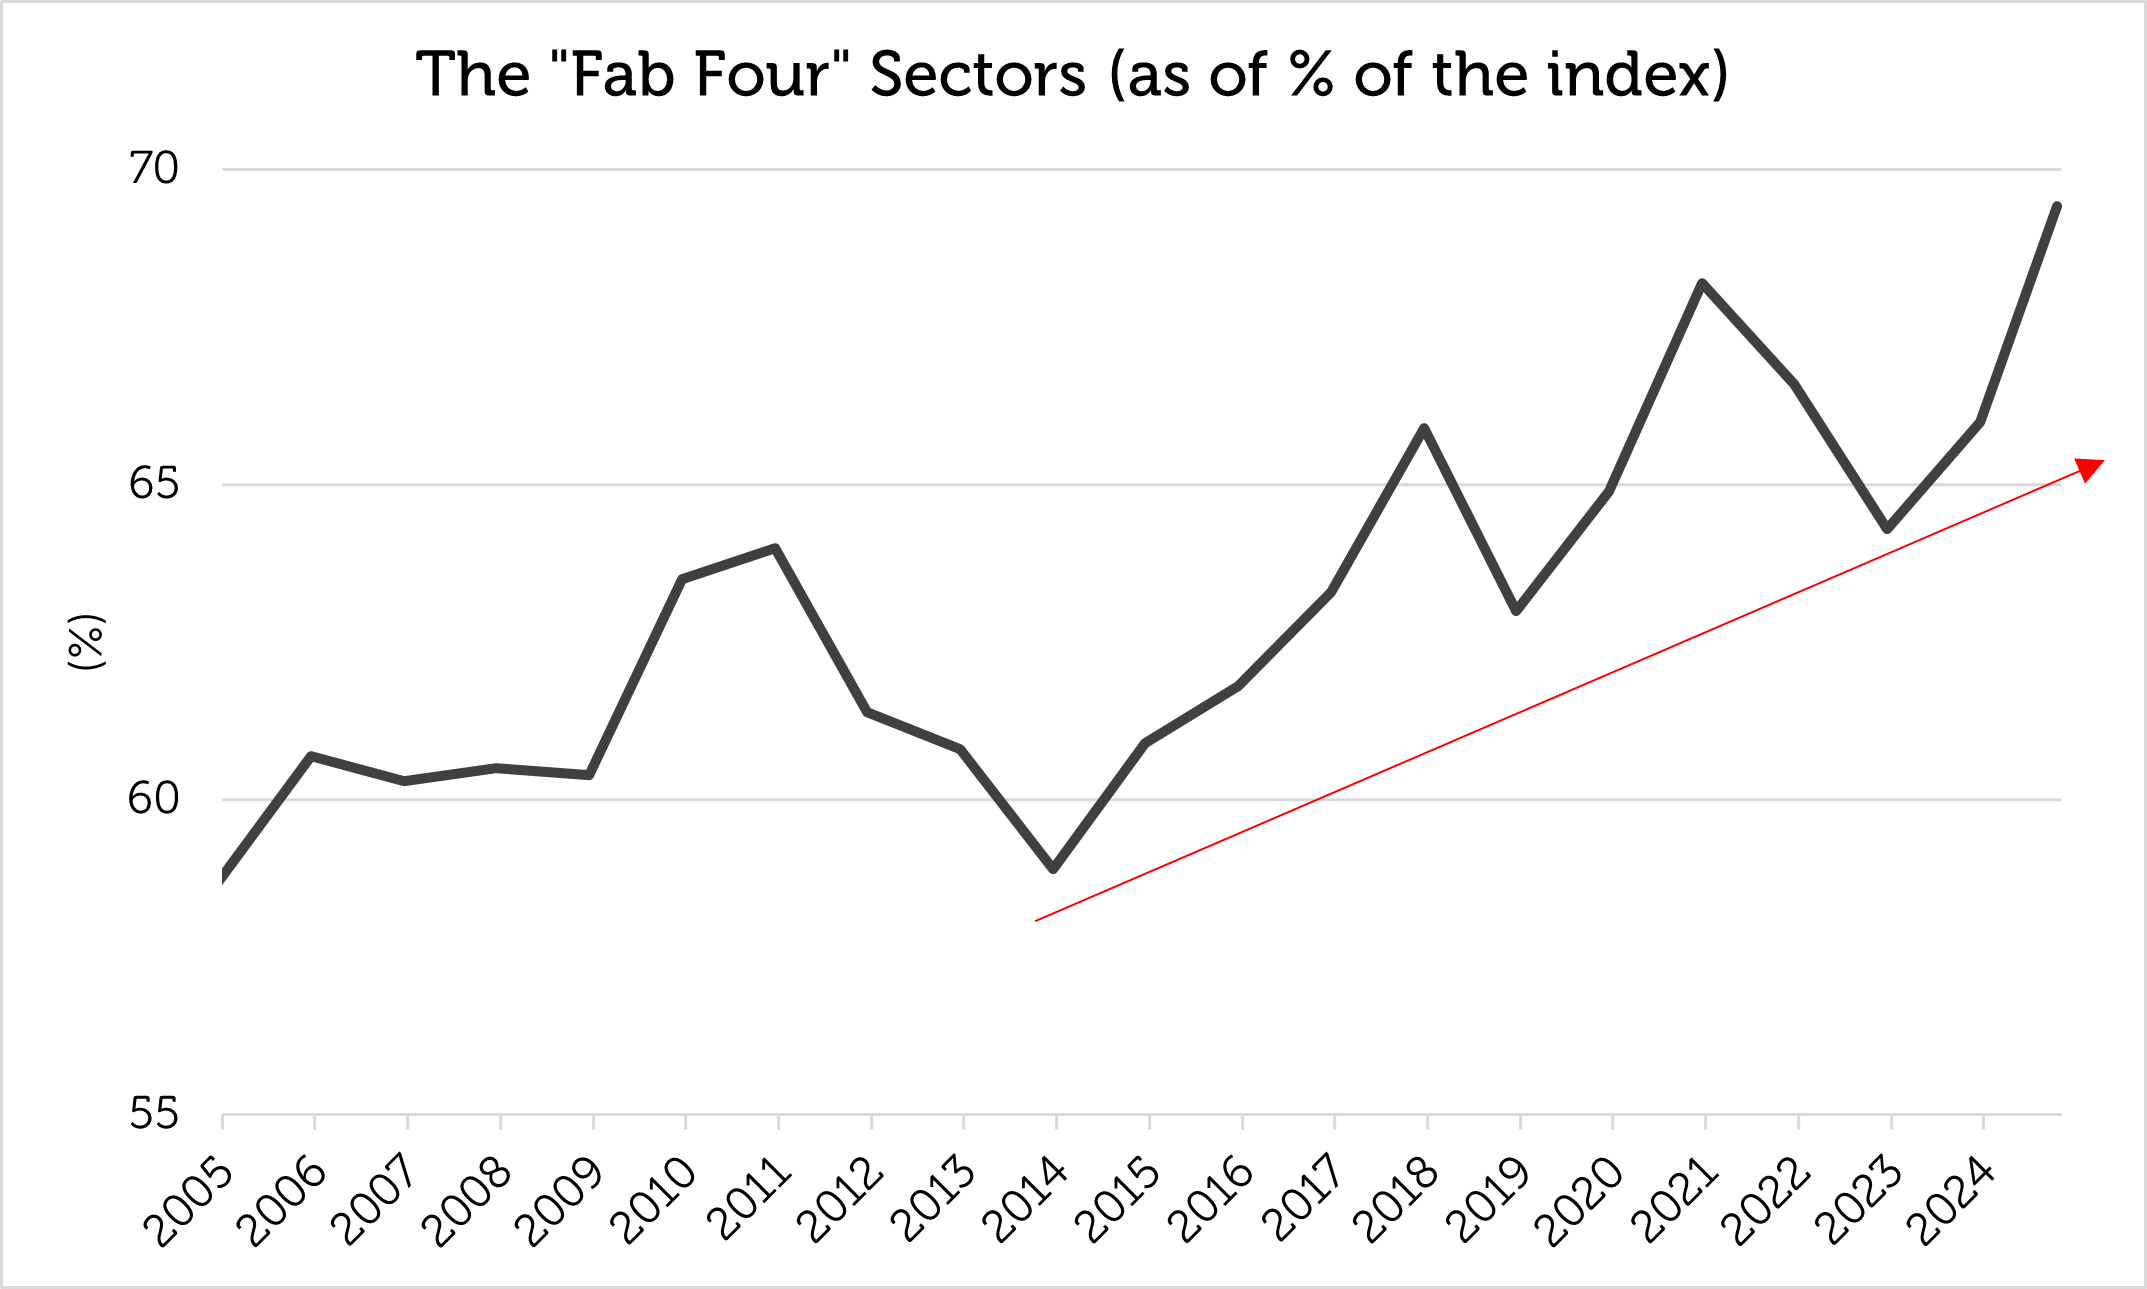
Source: Bloomberg, Redwheel as of 31 October 2024. Past performance is not a guide to future results. China has a uniquely large position, having risen from 6.8% of the MSCI Emerging Markets Index at the start of 2004 to an unprecedented 35.9% at the end of 2020, outperforming the index by just over 1% per annum along the way, but has underperformed by around 9% per annum since the end of 2020. China has dropped back to c.25% of the index but is still the largest country in the investable universe. Excessive weight of, perhaps, over one-third of the index might suggest that a single country is close to its maximum appeal with two dozen other countries from which to choose. The "Fab Four" Sectors: Technology, Financials, Consumer Discretionary, Communication Services The "Fab Four" effect is less obvious by sector, the top four usually comprising around two-thirds of the index and the top two currently accounting for 47% of the index. Although the "Fab Four" sectors have been static, like countries for several years, Energy and Materials used to be significant weights during commodities' bull cycles.
Source: Bloomberg, Redwheel as of 31 October 2024. Past performance is not a guide to future results. What are the lessons of index concentration? 1.Being big is not as good as getting big - the biggest are not always the best The size of a stock in an index is not a guarantee of future returns. In fact, size can be the enemy of returns. For example, of the "Fab Four" stocks at the peak of size concentration at the end of 2020, only Taiwan Semiconductor outperformed the index in the ensuing one and three years.
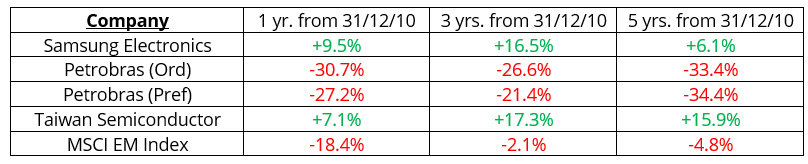
Source: Bloomberg as of 31 October 2024. Returns are in US$, periods >1 year are annualized. MSCI EM Index uses the MSCI Emerging Markets Net Total Return index. Past performance is not a guide to future results. The same is true at the point of minimum size concentration; from 2011 (the point of lowest concentration), Samsung and Taiwan Semiconductor outperformed the MSCI Emerging Markets Index while Petrobras (a member of the "Fab Four" at that time) underperformed. Being a member of the "Fab Four" is no guarantee of being a hit.
Source: Bloomberg as of 31 October 2024. Returns are in US$, periods >1 year are annualized. MSCI EM Index uses the MSCI Emerging Markets Net Total Return index. Past performance is not a guide to future results. What seems to matter is the market theme. For example, it was the Global Financial Crisis in 2008 that dethroned commodities, as Chinese growth decelerated in the 2010s and 2020s. And, while commodities have fallen from their peak, technology stocks have gained in importance globally because of the invention and adoption of digital content, e-commerce and artificial intelligence. An important question is whether the technology sector can maintain market leadership. In the past, its relative performance has coincided with interest rate cycles. We believe a shift in market leadership occurs when there is a change in underlying economic and financial conditions. As the Federal reserve embarks on a rate-cutting cycle, market leadership might finally rotate away from technology stocks. 2. How big is too big? Is 10% a barrier for a single company, and 20% a barrier for the "Fab Four"? There are nearly 1,300 companies in the MSCI Emerging Markets Index. Idiosyncratic risk, internal position limits and diversification requirements make it hard for investors to run materially overweight positions in single issues that reach 10% of the index, implying a possible lack of incremental buyers at such a large size. In addition, the "Fab Four" stocks' dominance peaked at 21% of the index in 2020 and has not yet regained that level, suggesting a possible ceiling on their combined weight and better potential returns elsewhere. 3.Financials and Technology have consistently grown; can Energy and Materials recover? Financials and Technology have dominated index composition, often representing 20% - 25% of the index each. During the Super-Cycle of the 2000s, however, both Energy and Materials represented significantly higher weights in the index than they do today. A change in market dynamics is required for Energy and Materials to rebound, which might be caused by lower interest rates and a resumption of global growth led by China, India and other major emerging markets when interest rates decline. 4. Asia dominates; can India emulate China, and can EMEA / LatAm rebound? The MSCI Emerging Markets Index has become less geographically diversified over the past decade with the "Fab Four" countries now accounting for 75% of index capitalisation. China is the archetype of index dominance, quintupling in size from 6.7% to 35.9% between 2004 and 2020. India has almost quadrupled in size, from 5.8% to 19% over the same period. India has the population, economic potential and high growth rate possibly to emulate the rise of China as a benchmark constituent. EMEA and Latin America probably need a commodity upswing to rebound in the MSCI Emerging Markets Index. Brazil and South Africa were both "Fab Four" countries during the Super-cycle of the 2000s, and Brazil remained a "Fab Four" country until 2014. Because EMEA and Latin America have more representation in the Energy and Materials sectors than in the Technology sector, they have missed the technology boom and have been eclipsed by Asia. 5. What might cause a change in market leadership away from Asia and Technology? A new "Fab Four" generation of countries, sectors and stocks can only occur with the passage of time and a change in macroeconomic drivers. Such a change may be on the horizon with lower interest rates and China's recently announced economic stimulus that is likely to have an impact across the Emerging and Frontier Market universe. On September 18th 2024, the Federal Reserve began a loosening cycle by cutting the benchmark rate by 50 basis points, which should encourage emerging market central banks to reduce rates as well. This could boost economic activity and contribute to a weaker dollar. On September 24th 2024, Chinese authorities announced measures to boost economic growth. As China's domestic economy regains momentum, it should benefit the broader emerging market universe through higher demand for commodities used in manufacturing. We believe that these factors can create strong tailwinds for EM and create the potential for a shift in market leadership away from technology towards commodity producers in EMEA and Latin America. Within our investment process we have identified several themes we see as drivers for commodity demand: Energy Transition, Urbanization, and Reshoring and Defence. We combine a deep understanding of the themes shaping Emerging and Frontier Market economies with fundamental analysis of the companies who are able to harness the opportunities these themes represent.
As we have shown, size is not necessarily a pre-determinant of returns and we believe a thematic approach which seeks to identify the long-term growth drivers in Emerging and Frontier Markets can uncover a compelling set of bottom-up investment opportunities that looks beyond market dominance. Author: Nick Smithie |
|
Funds operated by this manager: Redwheel China Equity Fund, Redwheel Global Emerging Markets Fund |
|
Key Information |

3 Dec 2024 - Australian Secure Capital Fund - Market Update
|
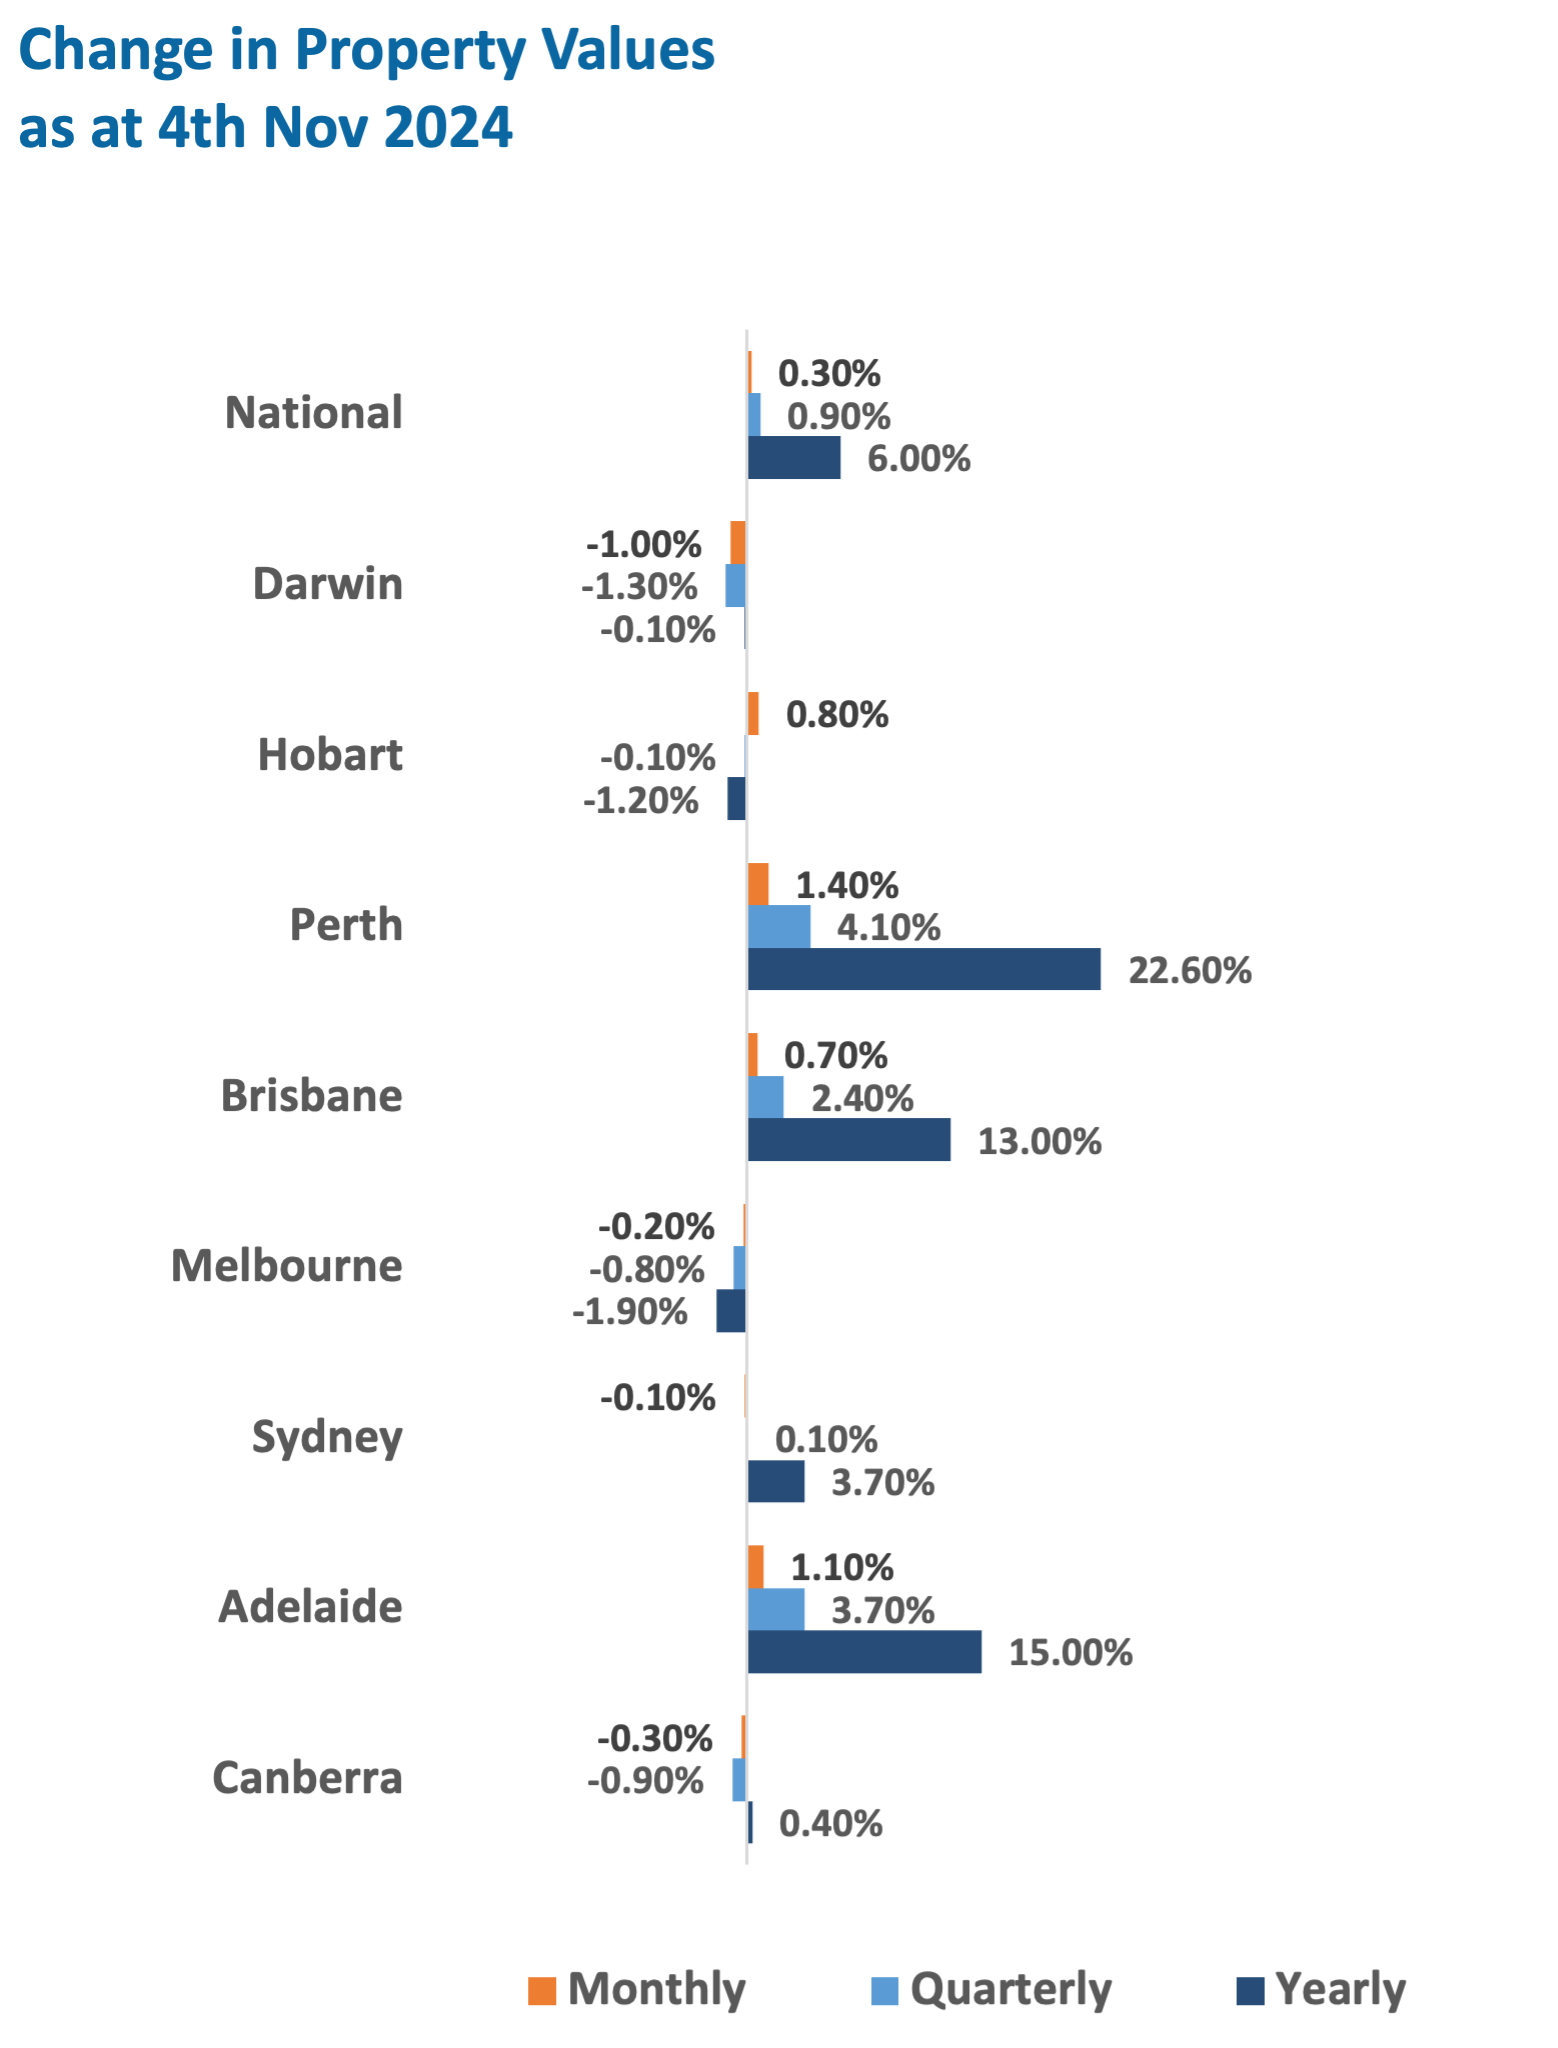
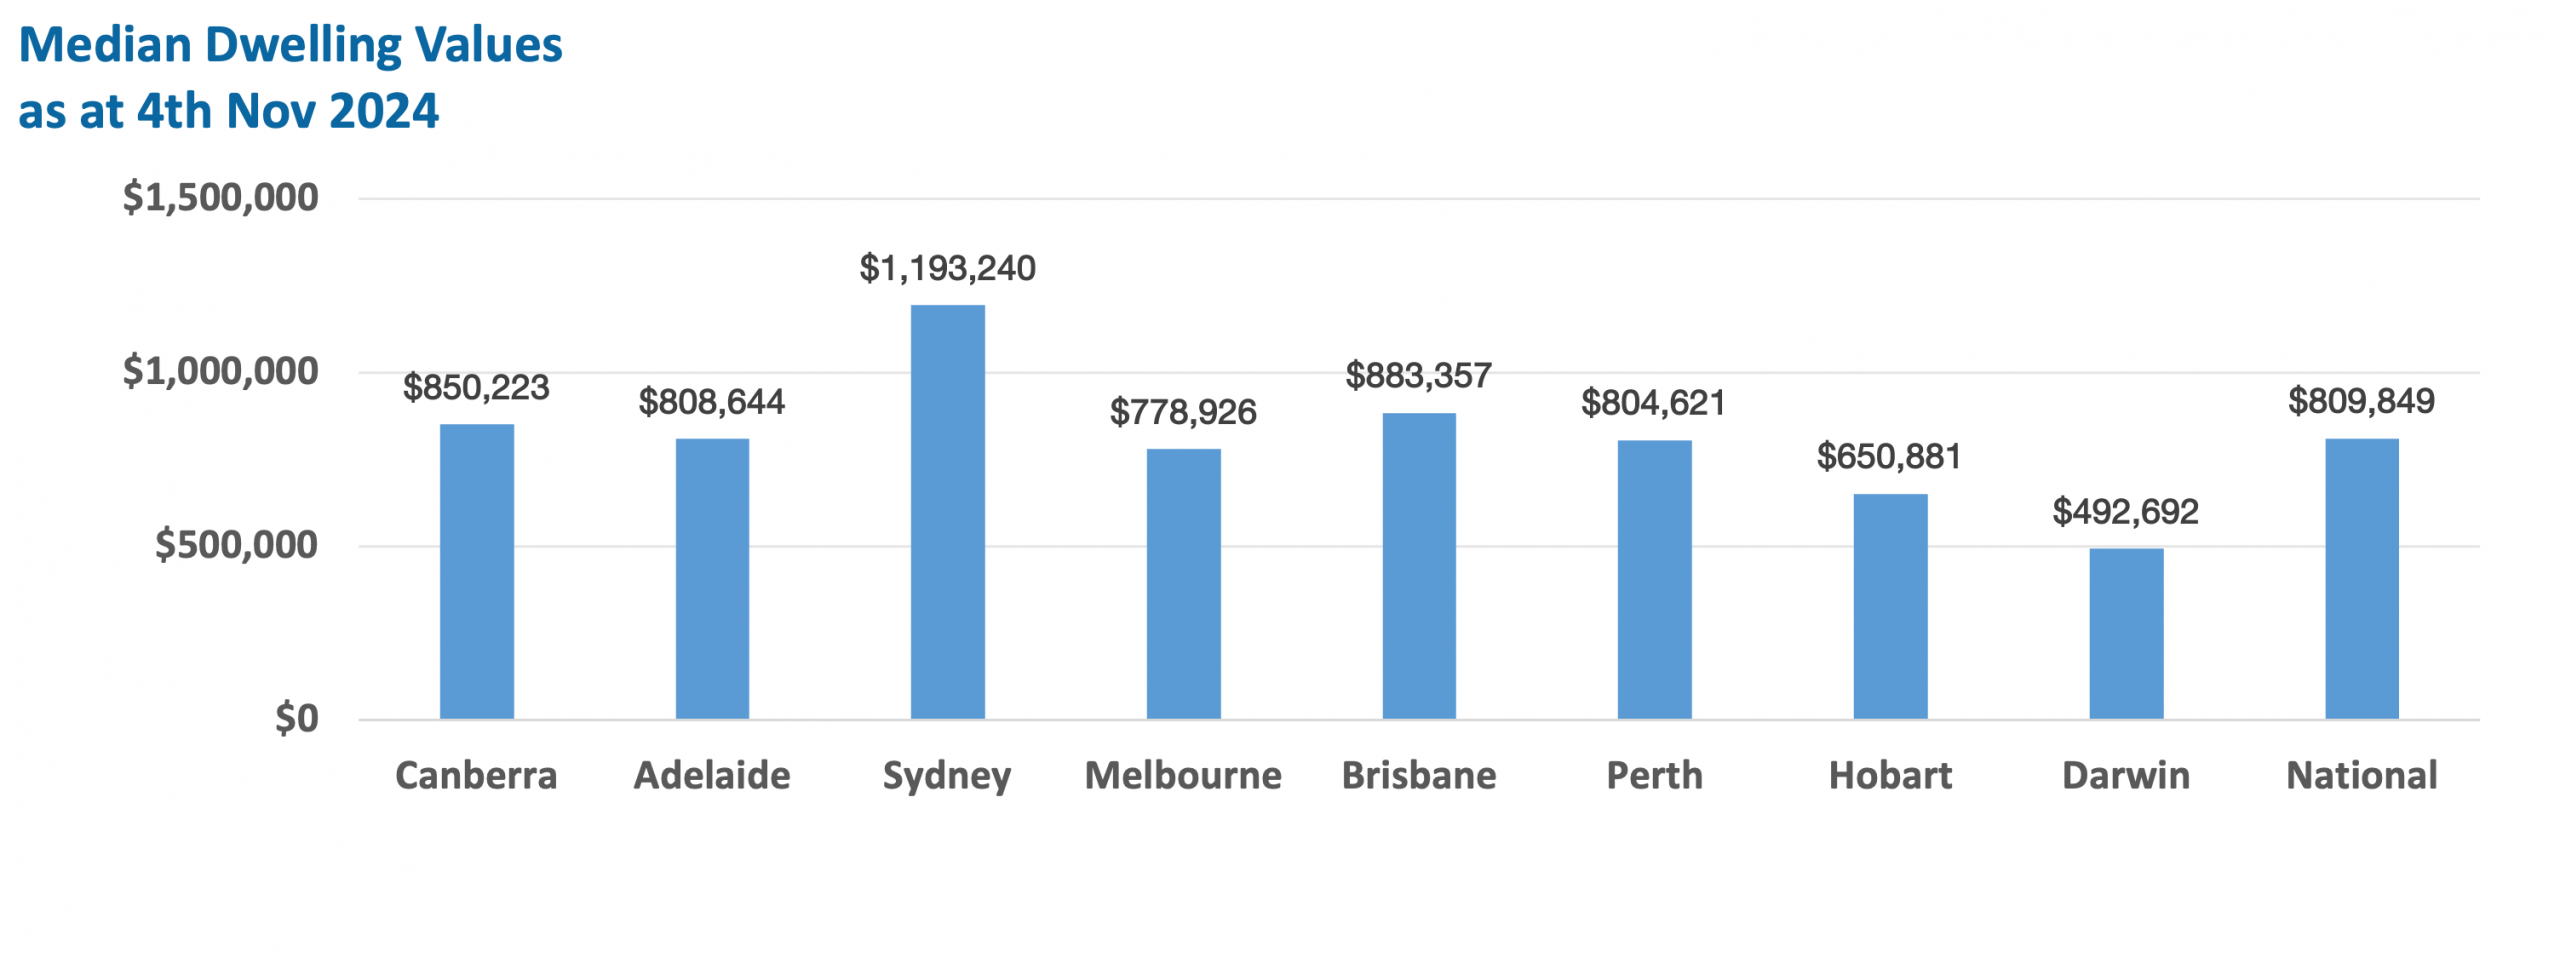
Australian Secure Capital Fund - Market Update Australian Secure Capital Fund November 2024 Australian residential property prices continued to rise for the 21st consecutive month with a 0.3% increase, but signs of easing continue with Darwin, Canberra, Melbourne and now Sydney all experiencing a decline in value according to CoreLogic's National Home Value Index, with losses of 1%, 0.3%, 0.2% and 0.1% respectively. Whilst this demonstrates that it is not all smooth sailing in the Australian property market, Brisbane, Hobart, Adelaide and especially Perth continued to perform strongly with further monthly increases of 0.7%, 0.8%, 1.1% and 1.4% respectively. Whilst the national capitals only saw a 0.2% increase for the month, the combined regionals are still performing strongly with a 0.6% monthly increase. This new monthly data with more capitals and regions beginning to see a reduction or easing in prices, has impacted quarterly data now showing that Darwin, Canberra, Melbourne and Hobart have experienced losses for the quarter (1.3%, 0.9%, 0.8% and 0.1% respectively) whilst Sydney has now only seen 0.1% quarterly growth. Brisbane, Adelaide and Perth have however continued to see significant growth for the quarter, with 2.4%, 3.7% and 4.1% respectively. As we head into the holiday season, and with the RBA remaining hesitant to reduce interest rates, it is expected to continue to see easing amongst the Sydney, Melbourne, Canberra, Hobart and Darwin markets, however the undersupply of property within Brisbane, Adelaide and Perth is likely going to see continued growth despite interest rate pressure. Property Values as at 4th of Nov 2024
|

2 Dec 2024 - Investment Perspectives: A Nike case study - lessons for real estate investors

29 Nov 2024 - Trump & Uncertainty

29 Nov 2024 - Performance Report: Insync Global Quality Equity Fund
[Current Manager Report if available]
29 Nov 2024 - Performance Report: Insync Global Capital Aware Fund
[Current Manager Report if available]

29 Nov 2024 - The Trump effect on small cap stocks
|
The Trump effect on small cap stocks Montgomery Investment Management November 2024 Since 2022, we have predicted that small cap stocks, especially those representing innovative businesses with pricing power, would do well in an environment of disinflation and positive economic growth. Since the end of 2022, the U.S. Russell 2000 Index of small-cap stocks has risen 36 per cent, the U.S. S&P SmallCap 600 index is up 31 per cent, and the S&P/ASX Small Ordinaries index has risen 12 per cent. Interestingly, most of the gains in the Russell 2000 Index (23 per cent) have been recorded since April this year, and the S&P SmallCap 600 is up 21 per cent over the same period. The bulk of the gains over the last two years have occurred in the last two or three quarters. Given the disinflation/ positive gross domestic product (GDP) picture was no different before April and after April, we can put the acceleration down to something else. That something else may just be bets that a Trump election victory would be positive. If so, why have U.S. small caps done well amid a Trump victory? Answering that question may offer some insights into what happens next (for what it's worth, I believe the small caps rally, which commenced in 2022, should continue into 2025, and we should reappraise the situation towards the end of 2025. Domestic focus: Small-cap companies often derive a significant portion of their revenue from domestic operations. The last Trump administration emphasised policies that stimulated domestic economic growth, such as infrastructure spending and tax reforms, benefiting these companies. Tax cuts and jobs act of 2017: Trump last reduced the corporate tax rate from 35 per cent to 21 per cent. Small cap companies generally paid higher effective tax rates compared to larger, multinational corporations. The reduction in taxes disproportionately benefited smaller companies, improving their profitability. Deregulation efforts: The last Trump administration pursued deregulation across various sectors, reducing compliance costs and operational burdens. Due to these policy changes, small businesses, which have fewer resources to manage regulatory complexities, found it easier to expand and invest. Trade policies: The focus on renegotiating trade agreements and implementing tariffs affected multinational corporations more than domestically oriented small cap companies. Large-cap companies with extensive international operations faced uncertainties and potential losses, whereas small caps were relatively insulated. Economic growth and consumer confidence: The period saw steady economic growth and high consumer confidence levels. Increased consumer spending boosted revenues for small businesses that rely heavily on domestic markets. Stronger U.S. dollar: A stronger dollar can negatively impact multinational companies by making exports more expensive and reducing the value of overseas earnings. With limited international exposure, small-cap companies were less affected by currency fluctuations. Infrastructure initiatives: Proposed investments in infrastructure projects promised potential contracts and growth opportunities for smaller companies in construction, manufacturing, and related industries. Together, the first time around, these factors created an environment where small-cap stocks could outperform their larger counterparts. Under a second Trump term, many investors believe the same is in store, which is why the Russell 2000 Index was up five per cent the day after Trump's win. Of course, it's important to remember honeymoons never last and stock performance is influenced by a variety of factors, including global market conditions, geopolitical conflict, investor sentiment, and, most importantly, profit growth. For now, and until late 2025 (and excepting a war with China), I believe small caps will do well. Author: Roger Montgomery Funds operated by this manager: Montgomery (Private) Fund, Montgomery Small Companies Fund, The Montgomery Fund |

28 Nov 2024 - Performance Report: TAMIM Fund: Global High Conviction Unit Class
[Current Manager Report if available]
Online Applicatons

Free, simple and secure
Olivia123 - the fast simple and secure online alternative to completing paper based application forms.